Abstract
A “cocktail” approach, which involves simultaneous administration of multiple CYP-specific probes, concurrently detects the activity of multiple CYP enzymes. We developed and validated a rapid and selective LC-MS/MS method for determining the plasma concentrations of 5 CYP probe drugs and metabolites (caffeine/paraxanthine, CYP1A2 substrate; losartan/losartan carboxylic acid (E3174), CYP2C9 substrate; omeprazole/5-hydroxyomeprazole, CYP2C19 substrate; dextromethorphan/dextrorphan, CYP2D6 substrate; and midazolam/1′-hydroxymidazolam, CYP3A4 substrate) by single-step extraction, followed by a single LC-MS/MS run. An Ostro™ 96-well plate was used for extraction of CYP substrates and metabolites from human plasma and urine. Following optimization of the chromatographic conditions, all the peaks were well separated, and retention times ranged between 4.4 and 11.7 min. The total run time for a single injection was within 13 min. The accuracy and precision values suggested that the assay had high accuracy and reliability in plasma and urine samples. No significant matrix interference was observed. To demonstrate the efficacy of this method, plasma and urine concentrations of 5 CYP probe substrates and their metabolites were determined after simultaneous oral administration of 5 drugs to 4 healthy volunteers. All the substrates and metabolites were detected over an 8 h period, and the plasma concentrations of each substrate at 8 h after administration were above the lower limit of quantification. Urine concentrations of drugs and their metabolic ratio were evaluated after the administration. In conclusion, the advantage of our cocktail approach is that it enables in vivo assessment of the activity of various drug-metabolizing enzymes in a single assay.
The CYP system, which constitutes the major drug-metabolizing machinery in humans, catalyzes the biotransformation of xenobiotics and has been reported to process over 90% of the currently marketed drugs.1,2) The drug-metabolizing activities of different CYP isoforms show high inter- and intraindividual variations; age, gender, genetics, environmental factors, dietary components, and endogenous mediators contribute to this variability.3–5) In addition, certain medications can induce or inhibit the activity of drug-metabolizing enzymes, resulting in drug–drug interactions. Variation in CYP activity results in variation in the pharmacokinetics of its substrates, which in turn may alter the pharmacodynamics of these drugs. Thus, predicting the pharmacokinetics and pharmacodynamics of the drug substrates of CYP is important for predicting potential drug interactions and for CYP substrate dose optimization.
A “cocktail” approach concurrently detects the activity of multiple CYP enzymes and involves simultaneous administration of multiple CYP-specific probes followed by the evaluation of their pharmacokinetics in a single experiment. Since the Pittsburgh cocktail was first introduced in 1997,6) several cocktails, including the Cooperstown 5+1 cocktail,7) the Karolinska cocktail, and the Inje cocktail, have been developed.8,9) However, these approaches are somewhat limited because some probes used in these cocktails, such as mephenytoin and debrisoquine, are no longer available for clinical use in many parts of the world. Moreover, these assay techniques do not permit the simultaneous analysis of multiple CYP substrates and their metabolites but can evaluate only a few drugs and metabolites in a single assay. As multiple plasma and/or urine samples (sampled at multiple points from each subject) need to be evaluated per study, these previous published assay methods were cumbersome to perform.
This study aimed to (1) develop a rapid and selective LC-MS/MS method for 5 CYP probe drugs and their corresponding CYP isoform-specific metabolites from plasma and urine samples by using a single-step extraction process followed by a single mass spectrometric run; and (2) validate this approach by pharmacokinetic analyses of the probe drugs and their metabolites in plasma and urine following oral administration in 4 healthy subjects.
Materials and methods
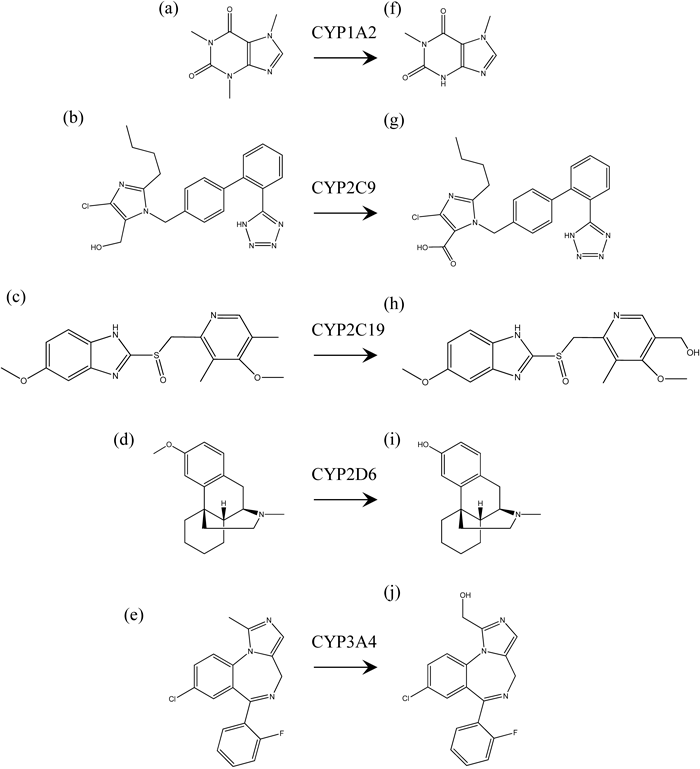
DrugsCaffeine, losartan, omeprazole, dextromethorphan, midazolam, dextrorphan, 1′-hydroxymidazolam, and nitrazepam were purchased from Sigma-Aldrich Corp. (St. Louis, MO, U.S.A.). Paraxanthine, losartan carboxylic acid (E3174), and 5-hydroxyomeprazole were purchased from Wako Pure Chemical Industries, Ltd. (Tokyo, Japan) (Fig. 1). All other chemicals were obtained from commercial sources.
Sample PreparationAn Ostro™ 96-well plate (Waters, Milford, MA, U.S.A.) was used for the extraction of a series of CYP substrates/metabolites (caffeine/paraxanthine, CYP1A2 substrate; losartan/E3174, CYP2C9 substrate; omeprazole/5-hydroxyomeprazole, CYP2C19 substrate; dextromethorphan/dextrorphan, CYP2D6 substrate; and midazolam/1′-hydroxymidazolam, CYP3A4 substrate) from human plasma. The plasma samples (300 µL) were spiked with an internal standard (100 µL of 100 ng/mL nitrazepam), and mixed with 900 µL of acetonitrile. The samples were then added to the 96-well plate, which was transferred to a 96-well vacuum manifold where vacuum suction was applied for extraction. It took less than 3 min for the precipitated sample to completely pass through the packed bed. The resulting eluent was collected in a 96-well collection plate and was dried using N2 gas at 40°C. The residue was reconstituted in 300 µL of methanol and dried again. The residue was reconstituted in 100 µL of methanol, filtered using a 0.20-µm Millex filter (Millex-LG; EMD Millipore, Billerica, MA, U.S.A.), and transferred to glass autosampler vials with glass inserts (100 µL). A volume of 10 µL was injected into the chromatographic system for analysis. The urine samples (100 µL) were treated with β-glucuronidase (500 U) in 1 mL of 50 mM sodium acetate (pH 5.0) for 24 h in a water bath at 37°C. The solutions (300 µL) were spiked with the internal standard (100 µL) and mixed with 900 µL acetonitrile. The samples were then added to a 96-well plate that was transferred to a 96-well vacuum manifold to apply vacuum suction for extraction. A volume of 10 µL was injected into the chromatographic system for analysis.
High-Performance Liquid ChromatographyLiquid chromatography was performed on an Agilent 1100 LC system (Agilent Technologies, Wilmington, DE, U.S.A.). The isolation of the 5 CYP probe drugs and of their metabolites was performed on a CAPCELL PAK C18 MGIII column (150 mm×2 mm; id, 5 µm) (Shiseido Co., Ltd., Tokyo, Japan). The column temperature was maintained at 40°C. The mobile phase A was 10 mM ammonium acetate, and the mobile phase B was acetonitrile. The flow rate of both mobile phases was 0.2 mL/min, and a gradient of 22.5–90% B was applied over a period of 6 min for sample elution. Volumes of 10 µL were injected, using an autosampler, into the Agilent 1100 LC system thermostated at 4.0°C ±0.5°C. The total HPLC run time was 13 min. The autosampler needle was rinsed with methanol before and after each injection.
Mass SpectrometryA mass spectrometer (API 3000; Applied Biosystems, Foster City, CA, U.S.A.) equipped with an electrospray ionization interface operating in the positive ion mode was used to characterize the CYP probe drugs and their metabolites. Data acquisition and analysis were performed using the Analyst software (version 1.4.1). The mass spectrometric conditions were optimized by infusing a 100 ng/mL standard solution at a rate of 5 µL/min by using an infusion pump directly connected to the mass spectrometer. For quantification, select reaction-monitoring chromatograms were acquired with the Analyst software program. The LC-MS/MS operating parameters and mass transitions are listed in Table 1.
Validation of the AssayThe parameters of linearity, precision, and accuracy were examined to validate the assay for plasma and urine. Calibration curves were generated using 6 different concentrations of each drug and metabolite within the calibration range as shown in Table 2, and the data were analyzed by weighted linear regression (weighting factor, 1/x2). Quality control (QC) samples of plasma were prepared at final concentrations of 10, 100, 1000, and 10000 for caffeine and paraxanthine, 1, 10, 100, and 1000 for losartan, E3174, omeprazole and 5-hydroxyomeprazole, 0.2, 2, 10, and 100 for dextromethorphan, 0.1, 1, 10, and 100 for dextrorphan, 0.1, 5, 10, and 100 for midazolam, and 0.1, 2, 10, and 100 for 1′-hydroxymidazolam (Table 3). QC samples of urine were prepared at final concentrations of 10, 100, 1000, and 10000 for caffeine, paraxanthine, losartan, E3174, and dextrorphan, 0.1, 1, 10, and 100 for dextromethorphan and midazolam, and 1, 10, 100, and 1000 for 1′-hydroxymidazolam (Table 4). The interday accuracy and precision of the assay were assessed by QC samples with 5 different determinations on 3 different days. The coefficient of variation (CV) was used to determine precision, and the percent spiking concentration was used as a measure of accuracy. The lower limit of quantitation (LLOQ) defined by the lowest concentration within the linear range of the calibration curves that gives an acceptable accuracy from 80% to 120% and a precision of <20%.10)
Assessment of Recovery and the Matrix EffectThe recovery and the matrix effect were assessed for QC samples of plasma and urine at 2 different concentrations (low and middle) for 5 determinations.11) QC samples were prepared for caffeine and paraxanthine (10 and 1000 ng/mL in plasma and urine), losartan (1 and 100 ng/mL in plasma; 10 and 1000 ng/mL in urine), E3174 (1 and 100 ng/mL in plasma; 10 and 1000 ng/mL in urine), omeprazole (1 and 100 ng/mL in plasma), 5-hydroxyomeprazole (1 and 100 ng/mL in plasma), dextromethorphan (0.2 and 10 ng/mL in plasma; 0.1 and 10 ng/mL in urine), dextrorphan (0.1 and 10 ng/mL in plasma; 10 and 1000 ng/mL in urine), midazolam (0.1 and 10 ng/mL in plasma and urine), and 1′-hydroxymidazolam (0.1 and 10 ng/mL in plasma; 1 and 100 ng/mL in urine). Recovery was assessed by comparing the peak areas of extracted QC samples at low and middle concentrations to the peak areas spiked at the corresponding concentrations. The matrix effect was expressed as the ratio of the mean peak area of an analyte spiked after extraction to the mean peak area of the same analyte standard multiplied by 100.
Application of the AssayThe clinical applicability of the present method was evaluated by analyzing probe drug and metabolite plasma concentrations in 4 healthy male volunteers whose ages ranged between 34 and 41 years. All the subjects provided written informed consent before the start of the study, and the study protocol was approved by the Ethics Committee of the Hamamatsu University School of Medicine. The study subjects were required to avoid the consumption of any caffeine-containing beverages 72 h prior to dosing. They received oral doses of caffeine (100 mg), losartan (50 mg), omeprazole (20 mg), dextromethorphan (30 mg), and midazolam (1 mg). Blood samples (7 mL) were collected at 0, 0.5, 1, 1.5, 2, 3, 4, 6, and 8 h after dosing. Urine was collected from 0 to 8 h following drug administration. The plasma samples collected after centrifugation and urine samples were stored at −80°C until analysis. Urinary metabolic ratio were calculated as the ratio of the amount of metabolite to that of substrate in urine.
Results and discussion
LC-MS/MS Method DevelopmentThe aim of this study was to develop and validate a rapid and selective LC-MS/MS method for the analysis of 5 CYP substrates and their metabolites in human plasma and urine. Our primary purpose was to develop a general assay that could simultaneously detect all the components of the CYP probe drug cocktail after single-step extraction of the probes and their metabolites from plasma and urine. Good sample preparation is essential for ensuring accuracy and reliability in LC-MS/MS analysis. Previously reported cocktail testing methods that assayed for CYP probe drugs required a dual analytical approach subsequent to multiple sample preparations.6–9) In contrast, we used the Ostro™ 96-well plate procedure in this study. This method is based on high affinity for phospholipids, with low selectivity toward a wide range of basic, neutral, and acidic compounds.12) We systematically compared the simple protein precipitation procedure to the new sample preparation platform and observed significant improvement in the bioanalysis. Because omeprazole is unstable in acidic solution, we employed acetonitrile for extraction in the Ostro sample preparation procedure instead of acidified acetonitrile, which is recommended to use in the standard protocol. Similarly, we could not measure the concentration of omeprazole in urine for the reason that the pretreatment of β-glucuronidase in acidic buffer for 24 h degraded omeprazole in urine sample. Selecting the internal standard is one of the important points to develop the method for LC-MS/MS. There are many advantage of the use of stable isotopes as the internal standard, while most stable isotope-labeled materials is not available commercially. We used nitrazepam as the internal standardin this method following our assay method for midazolam reported previously.13)
Recovery was assessed by comparing the peak areas of the extracted plasma samples at low and middle concentrations to the peak areas spiked at the corresponding concentrations. The recovery from human plasma and urine was greater than 66% and 76%, respectively, for all analytes (Tables 3, 4). The matrix effect was expressed as the ratio of the mean peak area of an analyte spiked after extraction to the mean peak area of the same analyte standard multiplied by 100. The matrix effect ranged from 89.6% to 115% for plasma and from 86.0% to 116% for urine (Tables 3, 4). Thus, no significant matrix interference was observed during MS/MS, suggesting that this protocol provides a fast and feasible method for excluding interfering phospholipid-based matrix effects in mass spectrometry. Under the optimized chromatographic conditions, the peaks of all substrates and metabolites were well separated from each other, and retention times ranged between 4.4 and 11.7 min (Fig. 2). The total run time per injection was below 13 min. The calibration curves for the substrates and metabolites of plasma were linear in the following concentration ranges: 10–10000 ng/mL for caffeine and paraxanthine; 1–1000 ng/mL for losartan, E3174, omeprazole, and 5-hydroxyomeprazole; 0.2–100 ng/mL for dextromethorphan; and 0.1–100 ng/mL for dextrorphan, midazolam, and 1′-hydroxymidazolam. The correlation coefficient (R2) for each curve was higher than 0.946. The accuracy and precision values ranged from 100% to 115.3% and from 0.9% to 13.4% of plasma, from 86.5% to 114.5% and from 1.4% to 15.0% of urine, respectively, suggesting that the assay had high accuracy and reliability (Table 2).
Clinical ApplicationsTo determine the utility of this method, the plasma concentrations of 5 CYP probe drugs and of their metabolites were determined after oral administration of these drugs to 4 healthy volunteers. In this study, we employed same 5 CYP probe drugs as Inje cocktail which were reported to use an optimal combination of widely used, available and well-tolerated substrates. The plasma concentrations of 5 CYP probes and of their metabolites over time (0–8 h after their administration) are provided in Fig. 3. All the substrates and metabolites were detected over the 8 h period, and the mean plasma concentrations at 8 h after administration were 2480 ng/mL for caffeine, 793 ng/mL for paraxanthine, 14.6 ng/mL for losartan, 201 ng/mL for E3174, 190 ng/mL for omeprazole, 30.4 ng/mL for 5-hydroxyomeprazole, 0.899 ng/mL for dextromethorphan, 0.872 ng/mL for dextrorphan, 1.58 ng/mL for midazolam, and 0.476 ng/mL for 1′-hydroxymidazolam. All these concentrations were above the lower limits of quantification for each substrate.
A recent study reported that a sensitive LC-MS/MS method allowed simultaneous determination of 5 probes of the Inje cocktail in subjects receiving doses 10- to 100-fold lower than the therapeutic dose.14) In the current study, we administered midazolam at a relatively low dose (10-fold lower than the therapeutic dose),13) although the other CYP probes were administered at therapeutic doses. Since plasma concentrations of all drugs could be determined 8 h after administration by our method, our protocol would allow further reduction of the other drug doses. Further micro- and mini-dose clinical studies are required to minimize the risk of adverse effects in human subjects. In the present study, we also simultaneously measured 4 drugs (caffeine, losartan, dextromethorphan, and midazolam) and their metabolites in urine following administration of the drug, in addition to determining their plasma concentrations. Recently, Oh et al. have developed a method involving simultaneous quantitation by LC-MS/MS for CYP probes and their metabolites, which were used in an Inje cocktail.14) Their report did not provide the procedure for determining the drug concentrations in urine samples. However, the urine concentration of losartan and the ratio of dextromethorphan to dextrorphan in urine were used for in vivo phenotyping of CYP2C9 and CYP2D6, respectively.9) The results of our study, which reports an analytical method involving CYP probes and can be used for both plasma and urine samples, would be useful for evaluating CYP activity in clinical trials as collection of urine samples for analysis would be a minimally invasive procedure. It would be useful to evaluate the properties and advantages of urine samples in the cocktail methods to assess CYP activity.
CONCLUSIONIn this study, we developed and validated a rapid and selective LC-MS/MS method to examine the metabolism of a cocktail of 5 CYP probe drugs administered in vivo, by using a simplified 1-step extraction followed by a single LC-MS/MS run. The advantage of our approach is that it enables in vivo assessment of the activity of multiple drug-metabolizing enzymes by the use of a single assay method.
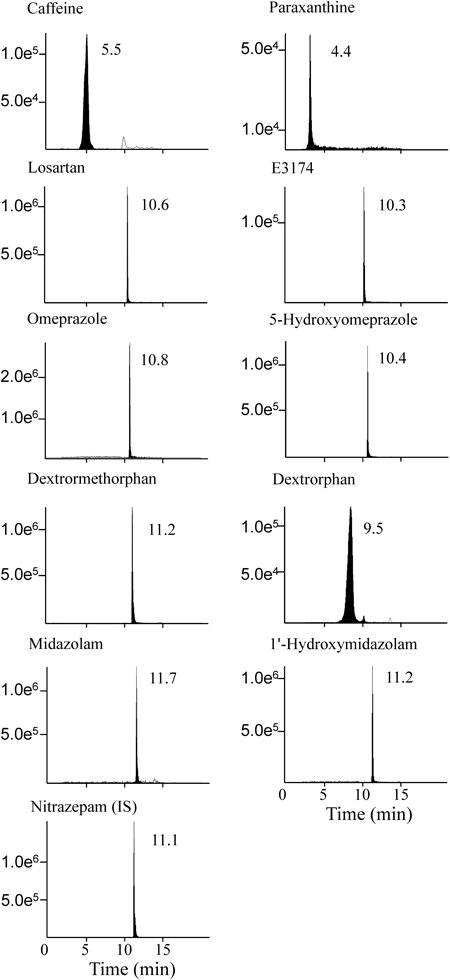
Fig. 2. LC-MS/MS Chromatograms of CYP Probe Drugs and Their Metabolites, Present at a Concentration of 100 ng/mL in Human Plasma
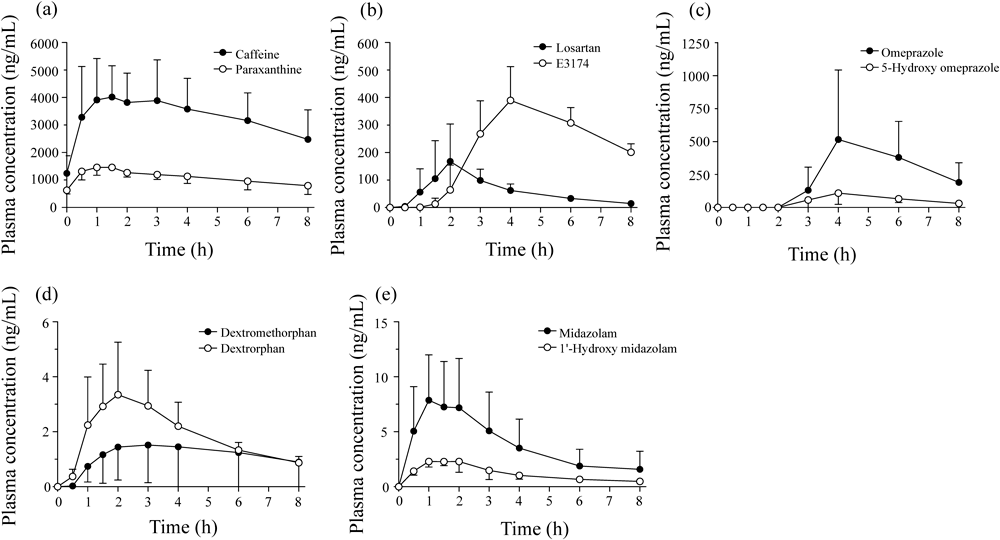
Fig. 3. Time Course of Plasma Concentrations of CYP Probe Drugs and Their Metabolites, Following Oral Administration to 4 Healthy Volunteers
Table 1. Analytical Parameters for LC-MS/MS
| CYP probe drugs/metabolite | Polarity | Precursor (m/z) | Product (m/z) | DP (V) | CE (eV) | CXP (V) |
|---|
| CYP1A2 | | | | | | |
| Caffeine | + | 195 | 138 | 60 | 30 | 8 |
| Paraxanthine | + | 181 | 124 | 60 | 30 | 8 |
| CYP2C9 | | | | | | |
| Losartan | + | 423 | 207 | 60 | 22 | 8 |
| E3174 | + | 437 | 235 | 60 | 16 | 8 |
| CYP2C19 | | | | | | |
| Omeprazole | + | 346 | 198 | 60 | 10 | 8 |
| 5-Hydroxyomeprazole | + | 362 | 214 | 60 | 12 | 8 |
| CYP2D6 | | | | | | |
| Dextromethorphan | + | 272 | 171 | 60 | 38 | 8 |
| Dextrorphan | + | 258 | 199 | 60 | 26 | 8 |
| CYP3A4 | | | | | | |
| Midazolam | + | 326 | 291 | 60 | 24 | 8 |
| 1′-Hydroxymidazolam | + | 342 | 324 | 60 | 20 | 8 |
| IS | | | | | | |
| Nitrazepam | + | 282 | 236 | 60 | 52 | 8 |
DP, declustering potential; CE, collision energy; CXP, collision cell exit potential.
Table 2. Calibration Curves, Linearity, and Sensitivity of the Assay of Human Plasma and Urine
| CYP probe drugs/metabolite | Retention time (min) | Calibration range (ng/mL) | Correlation coefficients (R2) | LLOQ (ng/mL) |
|---|
| Plasma | | | | |
| Caffeine | 5.5 | 10–10000 | 0.988±0.017 | 10 |
| Paraxanthine | 4.4 | 10–10000 | 0.946±0.043 | 10 |
| Losartan | 10.6 | 1–1000 | 0.988±0.014 | 1 |
| E3174 | 10.3 | 1–1000 | 0.968±0.018 | 1 |
| Omeprazole | 10.8 | 1–1000 | 0.990±0.010 | 1 |
| 5-Hydroxyomeprazole | 10.4 | 1–1000 | 0.980±0.014 | 1 |
| Dextromethorphan | 11.2 | 0.2–100 | 0.981±0.009 | 0.2 |
| Dextrorphan | 9.5 | 0.1–100 | 0.975±0.013 | 0.1 |
| Midazolam | 11.7 | 0.1–100 | 0.980±0.024 | 0.1 |
| 1′-Hydroxymidazolam | 11.2 | 0.1–100 | 0.986±0.011 | 0.1 |
| Urine | | | | |
| Caffeine | 5.5 | 10–10000 | 0.963±0.027 | 10 |
| Paraxanthine | 4.4 | 10–10000 | 0.990±0.012 | 10 |
| Losartan | 10.6 | 10–10000 | 0.986±0.012 | 10 |
| E3174 | 10.3 | 10–10000 | 0.983±0.022 | 10 |
| Dextromethorphan | 11.2 | 0.1–100 | 0.974±0.003 | 0.1 |
| Dextrorphan | 9.5 | 10–10000 | 0.988±0.009 | 10 |
| Midazolam | 11.7 | 0.1–100 | 0.992±0.003 | 0.1 |
| 1′-Hydroxymidazolam | 11.2 | 1–1000 | 0.988±0.011 | 1 |
LLOQ, lower limit of quantitation. Calibration curves were generated using 6 different concentrations of each drug and metabolite within the calibration range, and the data were analyzed by weighted linear regression (weighting factor, 1/x2). LLOQ defined by the lowest concentration within the linear range of the calibration curves that gives an acceptable accuracy from 80% to 120% and a precision of <20% .
Table 3. Precision, Accuracy, Recovery and Matrix Effect in the Quality Control Sample of Plasma
| CYP probe drugs/metabolite | Nominal concentration (ng/mL) | Measured concentration (ng/mL) | Precision (%) | Accuracy (%) | Recovery (%) | Matrix effect (%) |
|---|
| Caffeine | 10 | 9.92±0.08 | 0.9 | 99.2 | 102 | 94.7 |
| 100 | 108 ±8.56 | 7.9 | 108 | — | — |
| 1000 | 911±46.1 | 5.1 | 91.1 | 94.1 | 105 |
| 10000 | 9130±766 | 8.4 | 91.3 | — | — |
| Paraxanthine | 10 | 10.4±0.99 | 9.5 | 104 | 86.8 | 102 |
| 100 | 112±10.5 | 9.4 | 112 | — | — |
| 1000 | 995±133 | 13.4 | 99.5 | 83.4 | 95.3 |
| 10000 | 10100±1315 | 13.1 | 101 | — | — |
| Losartan | 1 | 0.98±0.02 | 2.2 | 97.8 | 100 | 96.2 |
| 10 | 10.3±0.49 | 4.7 | 103 | — | — |
| 100 | 99.8±9.19 | 9.2 | 99.8 | 102 | 97.5 |
| 1000 | 920±59.3 | 6.4 | 92.0 | — | — |
| E3174 | 1 | 1.00±0.06 | 6.1 | 100 | 80.0 | 115 |
| 10 | 8.83±1.03 | 11.7 | 88.3 | — | — |
| 100 | 90.6±11.7 | 12.9 | 90.6 | 72.3 | 113 |
| 1000 | 1150±31.1 | 2.7 | 115 | — | — |
| Omeprazole | 1 | 0.98±0.04 | 3.7 | 98.3 | 104 | 90.9 |
| 10 | 9.73±0.43 | 4.4 | 97.3 | — | — |
| 100 | 99.1±8.27 | 8.4 | 99.1 | 103 | 95.2 |
| 1000 | 914±104 | 11.4 | 91.4 | — | — |
| 5-Hydroxyomeprazole | 1 | 1.02±0.03 | 3.4 | 102 | 95.1 | 93.9 |
| 10 | 9.59±0.76 | 7.9 | 95.9 | — | — |
| 100 | 88.6±5.74 | 6.5 | 88.6 | 109 | 96.8 |
| 1000 | 1100±29.6 | 2.7 | 110 | — | — |
| Dextromethorphan | 0.2 | 0.20±0.004 | 1.8 | 100 | 97.4 | 108 |
| 2 | 1.73±0.26 | 15.0 | 86.5 | — | — |
| 10 | 10.8±1.06 | 9.8 | 108 | 105 | 93.3 |
| 100 | 9.67±6.26 | 6.5 | 96.7 | — | — |
| Dextrorphan | 0.1 | 0.10±0.001 | 1.0 | 100 | 66.4 | 94.8 |
| 1 | 1.04±0.14 | 13.4 | 104 | — | — |
| 10 | 10.1±0.59 | 5.9 | 101 | 67.1 | 94.5 |
| 100 | 106±9.07 | 8.6 | 106 | — | — |
| Midazolam | 0.1 | 0.11±0.01 | 7.5 | 107 | 106 | 89.6 |
| 5 | 5.18±0.60 | 11.6 | 104 | — | — |
| 10 | 10.1±0.39 | 3.9 | 101 | 112 | 96.2 |
| 100 | 93.8±3.37 | 3.6 | 93.8 | — | — |
| 1′-Hydroxymidazolam | 0.1 | 0.11±0.01 | 9.6 | 111 | 106 | 106 |
| 2 | 1.99±0.23 | 11.4 | 99.3 | — | — |
| 10 | 10.6±0.67 | 6.4 | 106 | 102 | 107 |
| 100 | 90.3±7.67 | 8.5 | 90.3 | — | — |
Measured concentration represent as mean±S.D. The interday accuracy and precision were assessed by each QC samples with 5 different determinations on 3 different days. The recovery and the matrix effect were assessed for QC samples at 2 different concentrations (low and middle).
Table 4. Precision, Accuracy, Recovery and Matrix Effect in the Quality Control Sample of Urine
| CYP probe drugs/metabolite | Nominal concentration (ng/mL) | Measured (ng/mL) | Precision (%) | Accuracy (%) | Recovery (%) | Matrix effect (%) |
|---|
| Caffeine | 10 | 9.84±0.15 | 1.4 | 98.4 | 110 | 97.4 |
| 100 | 108±2.26 | 2.1 | 108 | — | — |
| 1000 | 1110±57.3 | 5.2 | 111 | 79.6 | 80.6 |
| 10000 | 8740±1270 | 14.6 | 87.4 | — | — |
| Paraxanthine | 10 | 10.1±0.48 | 4.8 | 101 | 91.3 | 106 |
| 100 | 107±14.5 | 13.6 | 107 | — | — |
| 1000 | 946±47.3 | 5.0 | 94.6 | 116 | 110 |
| 10000 | 10200±1070 | 10.5 | 102 | — | — |
| Losartan | 10 | 9.78±0.15 | 1.5 | 97.8 | 97.0 | 100 |
| 100 | 115±11.8 | 10.3 | 115 | — | — |
| 1000 | 939±53.7 | 5.7 | 93.9 | 85.0 | 94.0 |
| 10000 | 8710±270 | 3.1 | 87.1 | — | — |
| E3174 | 10 | 9.92±0.23 | 2.3 | 99.2 | 76.2 | 87.9 |
| 100 | 106±15.9 | 15.0 | 106 | — | — |
| 1000 | 948±64.2 | 6.8 | 94.8 | 97.4 | 86.0 |
| 10000 | 9620±1180 | 12.2 | 96.2 | — | — |
| Dextromethorphan | 0.1 | 0.10±0.001 | 1.1 | 101 | 85.0 | 98.6 |
| 1 | 1.12±0.05 | 4.3 | 112 | — | — |
| 10 | 10.6±0.74 | 7.0 | 106 | 103 | 92.0 |
| 100 | 84.4±10.5 | 12.4 | 84.4 | — | — |
| Dextrorphan | 10 | 9.89±0.05 | 0.5 | 98.9 | 88.1 | 112 |
| 100 | 104±6.46 | 6.2 | 104 | — | — |
| 1000 | 1090±60.8 | 5.6 | 109 | 96.7 | 116 |
| 10000 | 8720±500 | 5.7 | 87.2 | — | — |
| Midazolam | 0.1 | 0.10±0.001 | 1.2 | 101 | 95.2 | 97.8 |
| 1 | 0.97±0.06 | 5.9 | 96.6 | — | — |
| 10 | 9.43±0.75 | 7.9 | 94.3 | 77.5 | 94.5 |
| 100 | 107±2.33 | 2.2 | 107 | — | — |
| 1′-Hydroxymidazolam | 1 | 1.01±0.03 | 2.6 | 101 | 99.6 | 90.9 |
| 10 | 10.7±1.32 | 12.4 | 107 | — | — |
| 100 | 95.5±6.25 | 6.5 | 95.5 | 97.7 | 94.4 |
| 1000 | 1060±115 | 10.9 | 106 | — | — |
Measured concentration represent as mean±S.D. The interday accuracy and precision were assessed by each QC samples with 5 different determinations on 3 different days. The recovery and the matrix effect were assessed for QC samples at 2 different concentrations (low and middle).
Table 5. Amount of Exclusion of CYP Probe Drugs and Their Metabolites and the 8 h Urinary Metabolic Ratio of 4 Healthy Volunteers
| CYP probe drugs/metabolite | Amount of excretion (µg) | Urinary metabolic ratio |
|---|
| Probe drugs | Metabolite |
|---|
| Caffeine/paraxanthine | 653±322 | 3290±2490 | 0.391±0.520 |
| Losartan/E3174 | 588±291 | 901±633 | 0.614±0.362 |
| Dextromethorphan/dextrorphan | 20.2±30.6 | 3240±1980 | 0.00808±0.0127 |
| Midazolam/1′-hydroxymidazolam | 2.38±2.19 | 385±265 | 0.00778±0.00389 |
Acknowledgment
This work was supported, in part, by a Grant-in-Aid for Scientific Research (21590171) from the Japan Society for the Promotion of Science. The authors are grateful to Ms. Michiyo Kageyama, Mr. Motoyasu Miura, and Ms. Yukie Fukai for their excellent technical assistance.
REFERENCES
- 1) Michalets EL. Update: Clinically significant cytochrome P-450, drug interactions. Pharmacotherapy, 18, 84–112 (1998).
- 2) Nebert DW, Russell DW. Clinical importance of the cytochromes P450. Lancet, 360, 1155–1162 (2002).
- 3) Shimada T, Yamazaki H, Mimura M, Inui Y, Guengerich FP. Interindividual variations in human liver cytochrome P-450 enzymes involved in the oxidation of drugs, carcinogens and toxic chemicals: studies with liver microsomes of 30 Japanese and 30 Caucasians. J. Pharmacol. Exp. Ther., 270, 414–423 (1994).
- 4) Guengerich FP. Influence of nutrients and other dietary materials on cytochrome P-450 enzymes. Am. J. Clin. Nutr., 61 (Suppl.), 651S–658S (1995).
- 5) Bebia Z, Buch SC, Wilson JW, Frye RF, Romkes M, Cecchetti A, Chaves-Gnecco D, Branch RA. Bioequivalence revisited: influence of age and sex on CYP enzymes. Clin. Pharmacol. Ther., 76, 618–627 (2004).
- 6) Frye RF, Matzke GR, Adedoyin A, Porter JA, Branch RA. Validation of the five-drug ‘Pittsburgh cocktail’ approach for assessment of selective regulation of drug metabolizing enzymes. Clin. Pharmacol. Ther., 62, 365–376 (1997).
- 7) Chainuvati S, Nafziger AN, Leeder JS, Gaedigk A, Kearns GL, Sellers E, Zhang Y, Kashuba AD, Rowland E, Bertino JS Jr. Combined phenotypic assessment of cytochrome P450 1A2, 2C9, 2C19, 2D6 and 3A, N-acetyltransferase-2, and xanthine oxidase with the “Cooperstown 5+1 cocktail.” Clin. Pharmacol. Ther., 74, 437–447 (2003).
- 8) Christensen M, Andersson K, Dalén P, Mirghani RA, Muirhead GJ, Nordmark A, Tybring G, Wahlberg A, Yaşar U, Bertilsson L. The Karolinska cocktail for phenotyping of five human cytochrome P450 enzymes. Clin. Pharmacol. Ther., 73, 517–528 (2003).
- 9) Ryu JY, Song IS, Sunwoo YE, Shon JH, Liu KH, Cha IJ, Shin JG. Development of the “Inje cocktail” for high-throughput evaluation of five human cytochrome P450 isoforms in vivo. Clin. Pharmacol. Ther., 82, 531–540 (2007).
- 10) U.S. Food and Drug Administration. “Guidance for Industry Bioanalytical Method Validation.”: ‹http://www.fda.gov/downloads/Drugs/Guidances/ucm070107.pdf›, cited May, 2001.
- 11) Matuszewski BK, Constanzer ML, Chavez-Eng CM. Strategies for the assessment of matrix effect in quantitative bioanalytical methods based on HPLC-MS/MS. Anal. Chem., 75, 3019–3030 (2003).
- 12) Adaway JE, Keevil BG. Therapeutic drug monitoring and LC-MS/MS. J. Chromatogr. B Analyt. Technol. Biomed. Life Sci., 883–884, 33–49 (2012).
- 13) Misaka S, Uchida S, Imai H, Inui N, Nishio S, Ohashi K, Watanabe H, Yamada S. Pharmacokinetics and pharmacodynamics of low doses of midazolam administered intravenously and orally to healthy volunteers. Clin. Exp. Pharmacol. Physiol., 37, 290–295 (2010).
- 14) Oh KS, Park SJ, Shinde DD, Shin JG, Kim DH. High-sensitivity liquid chromatography–tandem mass spectrometry for the simultaneous determination of five drugs and their cytochrome P450-specific probe metabolites in human plasma. J. Chromatogr. B Analyt. Technol. Biomed. Life Sci., 895–896, 56–64 (2012).