Abstract
Chondroitin sulfate–glycyl-prednisolone conjugate (CS–GP) was previously demonstrated to exhibit superior anti-arthritic effects compared to prednisolone (PD) alone. In this study, CS–GP was examined for its pharmacokinetic features and tropism for inflammatory joints using rats with adjuvant-induced arthritis in order to identify the mechanism of the potential enhancement. After intravenous injection (2.5 mg PD eq./kg), CS–GP yielded an area under the curve (AUC) of the total (free+conjugated) drug much higher than that of PD alone. After intravenous administration at the same dose, the drug distribution to the hind paw inflammatory joints was investigated. For PD alone, the PD concentration was 1.2–1.7 µg/g at 1 h and fell to 0.12–0.14 µg/g at 24 h. In contrast, CS–GP maintained the total concentration in the range of 0.55–0.97 µg/g for 1–24 h, and maintained the free PD concentration at 0.06–0.16 µg/g for 1–24 h. Furthermore, at 24 h after intravenous administration (2.5 mg PD eq./kg), CS–GP exhibited a higher total drug concentration in arthritic rats than in healthy rats. These findings suggested that CS–GP may have the ability to target inflammatory joints. As the apparent molecular weight of CS–GP became greater in plasma, it might interact with blood components and cause high plasma retention and good tropism to the inflammatory sites. Enhancement of the anti-inflammatory potential of CS–GP was found to be due to good maintenance of drug levels in the inflamed area.
Rheumatoid arthritis (RA) is a major issue in various developed countries, in which RA patients are increasing in number.1) This disease originates with a disorder or inflammation of the synovial membrane of the articular capsule, followed by the formation of pannus and neovascular vessels, and inflammatory cell infiltration into the joint cavity.2) The diseased state is likely to be chronic in RA, and joint tissues including cartilage and bone are subjected to progressive damage.2,3) Recently, genetic and environmental factors have been found to be associated with the etiology or pathogenesis of RA.4,5)
In the treatment of RA, pharmacotherapy is very important. Glucocorticoids are one of the drugs used for the treatment of RA as they display high anti-inflammatory actions rapidly.6–8) For example, prednisolone (PD) and dexamethasone are glucocorticoids widely used to treat RA.7,8) However, as glucocorticoids can cause severe toxic side effects when used with frequent dosing or at high doses, their use is often limited.9) Toxic side effects of glucocorticoids, including diabetes, hypertension and osteoporosis, are caused by systemic absorption of the drug. In order to improve such side effects, it is known to be useful to deliver the drug specifically to the target site and suppress the drug level in the systemic circulation. Recently, several drug delivery systems to carry glucocorticoids specifically to inflammatory arthritis sites, such as nanoparticles,10) liposomes11) and macromolecular prodrugs,12) have been developed to promote the drug effectiveness and reduce systemic toxic side effects. The concept is mainly based on the enhanced permeability and retention (EPR) effect at inflammatory sites and the subsequent prolonged drug retention and sustained release of the active form.13) For many drug delivery systems, highly-safe synthetic polymers are often utilized. However, when using such synthetic polymers, the problems of bioaccumulation or immunological reaction remain.
Chondroitin sulfate (CS) is distributed universally in connective tissues of various animals and is used parenterally as a medicine or ingested as a supplement and, so far, no adverse effects of CS have been reported.14–16) In view of such highly safe characteristics of CS, we developed a novel conjugate using CS as a drug carrier, as reported previously.17,18) The obtained conjugate, chondroitin sulfate–glycyl-prednisolone (CS–GP), was found to act as a macromolecular prodrug of PD and to promote anti-arthritic effects of PD,18) in which efficacy was evaluated using rats with adjuvant-induced arthritis.19,20) From the previous results of the pharmacokinetics in healthy rats, it was suggested that good retention of CS–GP in the plasma should facilitate drug distribution to the arthritic site based on the EPR effect. As the used CS has a molecular weight (MW) of only several tens of thousands,17) its EPR effect might be not very high. Therefore, in this study, the pharmacokinetic features and the extent of drug localization at the arthritis site were examined using rats with adjuvant-induced arthritis in order to elucidate the mechanism of the promoted efficacy by CS–GP. At the same time, the MW situation of CS–GP in the systemic circulation was investigated after i.v. administration.
MATERIALS AND METHODS
MaterialsChondroitin sulfate C (CS) sodium salt (CS–Na), derived from shark cartilage and containing 2.6% N and 6.6% S, was purchased from Wako Pure Chemical Industries, Ltd. (Osaka, Japan), and the ratio of 6-sulfate to 4-sulfate in CS–Na was 9 : 1, that is, 6-sulfate was greater, and the average MW was 40000–80000. N,N′-Carbonyldiimidazole (CDI), 4-dimethylaminopyridine (DMAP), N-hydroxysuccinimide (NHS) and 1-(3-dimethylaminopropyl)-3-ethylcarbodiimide hydrochloride (WSC) were also obtained from the same manufacturer. N-Tritylglycine (Tr-G) was purchased from Sigma Chemical Co. (St. Louis, MO, U.S.A.). Heat-killed and desiccated Mycobacterium tuberculosis M37Ra was obtained from Difco Laboratories (Detroit, MI, U.S.A.) and used as an adjuvant. All other chemicals were of reagent grade.
Sephadex G-50 fine powder was purchased from GE Healthcare Bio-Sciences AB (Uppsala, Sweden), and used for gel chromatography. Amicon Ultra-0.5 mL centrifugal filters with MW cutoffs of 30 K and 100 K were obtained from Merck Millipore, Ltd. (Darmstadt, Germany), and used for estimation of molecular weight distribution.
AnimalsLewis female rats (8 weeks old, 150–160 g) were obtained from Charles River Laboratories Japan, Inc. (Yokohama, Japan). They were bred on the breeding diet MF supplied by Oriental Yeast, Co., Ltd. (Tokyo, Japan) with water ad libitum at 23±1°C and relative humidity of 60±5%. They were used for the experiments a few days after purchase. The experimental protocol was approved by the Committee on Animal Research of Hoshi University, Japan. The animal experiments were performed in compliance with the Guiding Principles for the Care and Use of Laboratory Animals, Hoshi University, Japan.
Preparation and Chemical Characterization of CS–GPChondroitin sulfate–glycyl-prednisolone (CS–GP) were produced according to the previously-reported procedure.17,18) The production scheme is shown in Fig. 1. In the first step, glycyl-prednisolone (GP) was synthesized as follows. Tr-G (477 mg, 1.5 mmol) and CDI (243 mg, 1.5 mmol) were dissolved in 10 mL tetrahydofuran at 0°C and stirred for 30 min at 0°C. DMAP (15 mg, 0.12 mmol) and PD (270 mg, 0.75 mmol) were added to the solution and stirred at room temperature for 4.5 h. After evaporation of the solvent, the ester of PD with Tr-G, called Tr-GP, was obtained by washing the residue with methanol. The chemical structure of Tr-GP was confirmed by TLC, 1H-NMR, 13C-NMR, and electron ionization (EI)-MS measurements as reported previously. Then, Tr-GP (300 mg) underwent detritylation by heating in 75% (v/v) aqueous acetic acid (10 mL) at 75°C. As soon as the white precipitate began appearing while heating, the mixture was cooled on ice. After the white precipitate was removed by filtration, the filtrate was evaporated and the resultant residue was chromatographed with a silica gel column with a mixture of chloroform and methanol (15 : 1, v/v) as elution solvent. The fractions corresponding to GP were collected and evaporated to dryness. The obtained compound, GP, was confirmed for its chemical structure by TLC, 1H-NMR, 13C-NMR, and matrix assisted laser desorption/ionization-time of flight (MALDI-TOF)-MS measurements, as reported previously.
CS–GP was prepared by carbodiimide coupling as follows. CS (240 mg) was dissolved in 20 mL water, and 5 mL tetrahydrofuran (THF) containing GP (60 mg) was added. WSC (1 g) and NHS (0.6 g) were added to the solution, and the resultant mixture was stirred at room temperature for 4.5 h. The solution was chromatographed with a Sephadex G50 gel column [2.8 cm (inner diameter)×25 cm (length)] using 0.1 M NaCl aqueous solution as the elution solvent. The eluted solution was fractionated at 15 mL each. The high molecular weight fractions were collected and dialyzed against water at 4°C. The final solution was lyophilized to yield CS–GP, which was shown to contain PD at 3.9% (w/w) from the UV absorbance at 246 nm in the H2O/phosphate-buffered saline with pH 7.4 (PBS)/MeOH solution (0.4/2/0.533, v/v). CS–GP in powder form was kept stable at room temperature in a dessicator with dry silica gel, in which free PD was little found even in half a year.
In Vitro Release Studies at Inflammatory Joint pHThe in vitro release of PD from CS–GP was examined using a mixture of H2O/Buffer/MeOH (0.4/1.2/0.533, v/v), in which 1/15 M phosphate buffers of pH 6.5 and 7 (typical pH of inflamed tissue media) were used as the buffer solution (Buffer). The mixture containing CS–GP (2.13 mL) was incubated at 2.61 µg PD eq./mL at 37°C under horizontal shaking at 60 rpm. At appropriate time points, aliquot samples (50 µL) were withdrawn, and 1/10 M acetate buffer of pH 4 (150 µL) was added to stop the hydrolysis. After 150 µL of HPLC mobile phase was added, 40 µL of the mixture was injected onto HPLC to analyze the PD concentration in the incubation media.
Pharmacokinetic Experiment in Rats with Adjuvant-Induced ArthritisAnimal models with adjuvant-induced arthritis were made according to the method by Hirano et al.19) Namely, heat-killed Mycobacterium tuberculosis M37Ra was suspended in liquid paraffin at 5 mg/mL. The suspension (100 µL) was injected intracutaneously into the footpad of the right hind paw of each Lewis rat. The volume of the hind paws reached a plateau around 14 d after the adjuvant injection. Dosing samples were prepared as follows. CS–GP was dissolved in saline at 2.5 mg PD eq./mL, and PD was dissolved in 50% (w/v) PEG400 saline solution at 2.5 mg/mL.
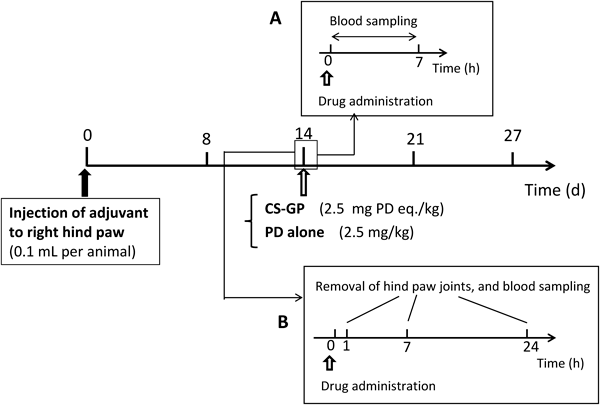
The pharmacokinetic experiment was performed according to the schedule in Fig. 2A. Namely, 14 d after adjuvant injection, the rats were administered CS–GP or PD solution at 2.5 mg PD eq./kg/mL via the jugular vein. Blood sampling (each, 0.3 mL) was performed immediately before dosing and 15 min, 30 min, 1 h, 3 h and 7 h after drug administration.
For dosing of PD alone (PD solution), the blood sample was centrifuged at 1500×g for 10 min to obtain plasma. Saturated NaCl aqueous solution (100 µL), 6% (w/v) phosphoric acid (100 µL) and 4 mL of the mixture of t-butyl methyl ether and pentane (3 : 2, v/v) were added to the plasma (100 µL). The mixture was shaken vigorously 100 times and then centrifuged at 1500×g for 10 min. The supernatant (3 mL) was taken and dried under nitrogen gas. The residue was dissolved with 100 µL HPLC mobile phase and analyzed by HPLC to determine the concentration of PD in plasma.
For CS–GP, the plasma concentration of free PD and that of total (free+conjugated) PD were measured. After centrifugation of the blood sample, two plasma samples (each, 50 µL) were obtained; one sample (50 µL) was used for analysis of the free PD concentration, and the other (50 µL) was used for measurement of the total PD concentration. First, 50 µL of the plasma sample was treated in a similar manner to PD alone. Namely, saturated NaCl aqueous solution (50 µL), 6% (w/v) phosphoric acid (50 µL) and 2 mL of the mixture of t-butyl methyl ether and pentane (3 : 2, v/v) were added to the plasma (50 µL). After the mixture was shaken vigorously 100 times and centrifuged at 1500×g for 10 min, the resultant supernatant (1.5 mL) was taken and dried under nitrogen gas. The residue was dissolved in 100 µL HPLC mobile phase and analyzed by HPLC to obtain the free PD concentration.
Second, to another plasma sample (50 µL), 50 µL of 0.1 M NaOH aqueous solution was added, mixed and then incubated at 45°C by shaking horizontally at 60 rpm for 10 min. Then, 150 µL of 0.1 M acetate buffer of pH 4 was added. Saturated NaCl aqueous solution (200 µL), 6% (w/v) phosphoric acid (200 µL) and 8 mL of the mixture of t-butyl methyl ether and pentane (3 : 2, v/v) were added to the whole resultant mixture and shaken vigorously 100 times. After the mixture was centrifuged at 1500×g for 10 min, the supernatant (3 mL) was taken and dried under nitrogen gas. The residue was dissolved in 100 µL HPLC mobile phase and analyzed by HPLC to determine the total drug concentration. The concentration of conjugated PD was calculated by subtracting the concentration of the above free PD from that of the total PD.
Drug Distribution Studies at Inflammatory Joints in Rats with Adjuvant-Induced ArthritisThe drug distribution at the inflammatory joint was analyzed as shown in Fig. 2B. This was performed separately from the above pharmacokinetic experiment. On 14 d after adjuvant injection, CS–GP or PD solution, prepared in the same manner as in the pharmacokinetic study, was injected at 2.5 mg PD eq./kg/mL into the jugular vein. At 1, 7 or 24 h after drug administration, a blood sample (0.3 mL) was taken from the jugular vein under anesthesia with ethyl ether. Immediately after, the animals were sacrificed by excessive anesthesia with ethyl ether inhalation. Then, both right and left hind paws were taken using scissors for bone resection so that the inflamed part around the ankle was taken with each neighboring side (each: approximately 0.5 cm). After the skin was removed from the taken leg part, the resultant tissue (1.0–2.0 g) was treated as follows to measure the drug concentration.
The obtained tissue containing flesh and bone was minced using scissors for bone resection and those for cutting meat in a small plastic box. After the obtained joint fragments (0.5–1 g) were put into a glass bottle, liquid nitrogen (3 mL) was added several times until the fragments were completely frozen. The frozen fragments were mixed well in the bottle and placed in an iron cylinder (1.5 cm ϕ×2.5 cm long) which had been cooled in advance by dipping in liquid nitrogen. The frozen fragments were pressed manually with a pestle at 300 kg for 30 s. Thus, 1 or 2 disks were obtained for each inflamed tissue and were preserved at –80°C until drug extraction for preparation of the HPLC sample. Small pieces of debris and liquid derived from the tissue fragments were collected by washing the plastic box, and the washings, total volume of which was set to be equal to the total weight of the above tissue disks, were put in the glass bottle used for drug extraction; the final liquid was called wash liquid and was used for preparation of the HPLC sample.
The sample for HPLC analysis was prepared as follows. A portion of the above frozen disk (0.2 g) was cut out, and 0.2 mL of the above wash liquid and 0.2 mL of 0.1 M acetate buffer (pH 4) were added. After the mixture was stirred by a vortex mixer and sonicated at 20 kHz (100 kW) at 5 min, 1.8 mL acetonitrile was added, stirred by a vortex mixer and sonicated at 20 kHz (100 kW) at 5 min. Then, the mixture was left to stand at room temperature for 1.5 h, during which the whole tissue fragments were denatured almost completely. After centrifugation, 1.2 mL of the supernatant was withdrawn, and the organic solvent was evaporated at 30°C under nitrogen gas. The remaining aqueous liquid underwent lyophilization. To the residue, 200 µL HPLC mobile phase was added, and the resultant solution was analyzed by HPLC to determine the tissue concentration of free PD.
The total (free+conjugated) PD concentration in the inflamed tissue was measured as follows. The frozen disk (0.2 g) and wash liquid (0.2 mL), prepared as above, were mixed, and 0.1 M NaOH aqueous solution (0.4 mL) was added. Then, the mixture was warmed to 45°C for 8 min while shaking horizontally at 60 rpm. Then, 0.1 M HCl aqueous solution (0.4 mL) was added to neutralize the pH, and 3.6 mL acetonitrile was added. The mixture was stirred by a vortex mixer and sonicated at 20 kHz (100 W) for 10 min, then centrifuged at 1500×g for 10 min. After 2.4 mL of the supernatant was taken, the contained organic solvent was dried at 40°C under nitrogen gas. Then, the remaining aqueous liquid was lyophilized. To the residue, 200 µL HPLC mobile phase was added, and the resultant solution was analyzed by HPLC to obtain the total drug concentration of the inflammatory joint.
Furthermore, the control study using healthy rats was performed to evaluate the passive targeting ability of CS–GP. That is, CS–GP was administered intravenously to healthy rats at 2.5 mg PD eq./kg. At 24 h after administration, the rats were sacrificed by excessive anesthesia with ethyl ether inhalation. Immediately after that, both right and left hind paws were taken using scissors for bone resection with each neighboring side (each: approximately 0.5 cm). The skin of the taken tissue was removed, and the resultant tissue (ca. 0. 3 g) was analyzed for the total PD concentration in the same manner as described above. The obtained total PD concentrations were compared between AIA and healthy rats.
Estimation of Physicochemical State of CS–GP in Systemic CirculationThe blood sample taken 1 h after i.v. injection of CS–GP was used for examination of its apparent molecular weight in the systemic circulation. First, the original molecular weight distribution of CS–GP was measured using ultrafilter membranes with MW cutoffs of 30K and 100 K (Amicon Ultra). Namely, 0.5 mg/mL CS–GP solution in phosphate-buffered saline at pH 7.4 was filtered using the ultrafilter membranes. The original solution and the filtrates were diluted with PBS and measured spectrophotometrically at 246 nm.
For the blood sample, the plasma was obtained after centrifugation. The MW distribution of CS–GP was estimated based on the total drug concentration in each eluted filtrate obtained after ultrafiltration, because the concentration of free PD is low in the plasma 1 h after i.v. injection. Namely, the examination was conducted as follows. The plasma (50 µL) and PBS (450 µL) were mixed and filtered using the ultrafilter with an MW cutoff of 100 K. In addition, the plasma (25 µL) and PBS (450 µL) were mixed and filtered using the ultrafilter of 30 K cutoff. The mixture before ultrafiltration and the filtrates were treated in the same manner as the plasma sample in the pharmacokinetic experiment. Namely, 50 µL of 0.1 M NaOH aqueous solution was added to each sample (50 µL) and then incubated at 45°C by shaking horizontally at 60 rpm for 10 min. Then, 150 µL of 0.1 M acetate buffer of pH 4 was added. Saturated NaCl aqueous solution (200 µL), 6% (w/v) phosphoric acid (200 µL) and 8 mL of the mixture of t-tributylmethyl ether and pentane (3 : 2, v/v) were added and shaken vigorously 100 times. After centrifugation, the supernatant (3 mL) was taken and dried under nitrogen gas. The residue was dissolved in 100 µL HPLC mobile phase and analyzed by HPLC to determine the total drug concentration. From the total PD amount in the sample or filtrate, the distribution of CS–GP in the individual MW range was estimated, because the free PD concentration was much less than the total PD concentration 1 h after i.v. injection.
HPLC AssayFor the HPLC apparatus, a Shimadzu LC-6AD pump was used with a Shimadzu SPD-10AV VP UV-VIS detector set at a wavelength of 246 nm and a Shimadzu C-R7A plus Chromatopac (Kyoto, Japan). A YMC Pack ODS-AM column (6 mm inner diameter×150 mm length; YMC Co., Ltd., Kyoto, Japan) was used as the analytical column. A 26% (v/v) 2-propanol aqueous solution containing 0.1% (v/v) trifluoroacetic acid was used as the mobile phase. The HPLC assay was performed at room temperature, with the flow rate set at 1 mL/min and an injection volume of 40 µL. The PD concentration was determined using the absolute calibration curve, which was obtained after treating fresh samples spiked with a known amount of the drug in the same way as the treatment of the test sample.
Statistical AnalysisStatistical analyses of more than 2 groups were performed with one-way ANOVA followed by Dunnett’s test, and comparison of two groups was conducted with unpaired t-test. Significant difference was set as p<0.05.
RESULTS AND DISCUSSION
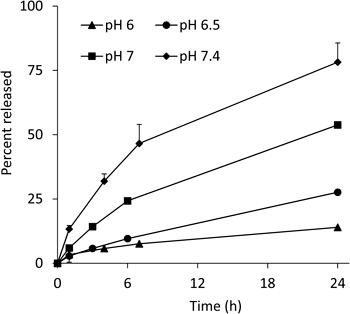
In Vitro Release of PD from CS–GP at Inflammatory Joint pHAccording to the literature on the medium pH at joints with rheumatoid arthritis, the pH is 7–7.4 in a moderate disease state, and falls to <7 as the disease condition worsens. In a severe disease state, the pH falls to 6–6.5. In the previous study, the release profiles were investigated at pH 6 and 7.4. Therefore, the release of PD was further examined at pH 6.5 and 7 in the present study. The release profiles are shown in Fig. 3, including the release profiles at pH 6 and 7.4, obtained previously. The release rate constants, obtained by pseudo-first order kinetic analysis, were 0.013 and 0.031 h−1, respectively; that is, the 50% release time periods were calculated to be 53 and 22 h at pH 6.5 and 7, respectively. Considering that the release rate of PD was dependent mainly on pH, not caused enzymatically,17) PD was considered to be released slowly over one to several days in the inflammatory joint area. As the PD release was caused gradually at physiological pH 7.4 (approximately 50% for 7 h), too long systemic circulation might be unsuitable for the localization to the diseased area. In the case of CS–GP, the systemic retention was not so long as stated below in the plasma concentration study, probably due to the metabolic fate of CS itself. Therefore, the loss by release of PD in the systemic circulation was not a critical problem, though it would be desirable to suppress the drug release in the systemic circulation maximally.
Pharmacokinetics after i.v. Injection in Rats with Adjuvant-Induced ArthritisAfter PD alone and CS–GP were intravenously administered to rats with adjuvant-induced arthritis, the plasma levels were investigated from 0.25–7 h. For PD alone, the plasma concentration immediately after i.v. injection (0 h) was calculated by extrapolation with the exponential curve obtained for the points of 0.25 and 0.5 h. Also, for CS–GP, the total PD concentration immediately after i.v. injection (0 h) was calculated in the same manner. The conjugated PD concentration (CS–GP(C)) was calculated by subtraction of the free PD level from the total level. For both administrations, the plasma concentration profiles were basically similar to those obtained previously in normal rats.18) The results are shown in Fig. 4. For PD alone, the plasma concentration was eliminated in a bi-phasic manner, in which rapid elimination at 0–30 min and slow decline at 0.5–7 h were observed. For CS–GP, the total concentration was eliminated in a mono-exponential manner from 0.25 h to 7 h. At 0.25–3 h after administration, the total concentration was more than 10 times greater in CS–GP than in PD alone; a significant difference was observed from 0 h to 3 h in comparison of PD alone with both total and conjugated PDs (p<0.05 or 0.01). The concentration of free PD was much less than the total concentration from 0 h to 7 h after administration of CS–GP, and not so different from that given by PD alone.
Thus, conjugated PD was found to contribute to the high plasma level of the total concentration of CS–GP. Considering that CS is eliminated by hepatic metabolism and urinary excretion generally with a half-life of several dozen min—a few h in human and animals,21–23) CS–GP was considered to be concentrated well in the systemic circulation. Thus, it could be proposed that the high distribution of CS–GP in the systemic circulation should promote the localization of PD at the inflamed tissue due to the enhanced permeability and retention (EPR) effect.13) Table 1 summarizes the results in moment analysis of the plasma concentration–time profiles, in which the computer program MULTI was used.24) The AUC value of the total PD was nearly 13 times significantly greater in CS–GP than in PD alone (p<0.01). As the AUC value of the conjugated PD was 11 times significantly higher than the PD level in PD alone (p<0.01), the conjugated PD was considered to raise the drug retention in the systemic circulation. The values of mean residence time (MRT) and variance of residence time (VRT) were similar among all the types of drugs in Table 1 except for the VRT value of PD alone. The greater value of VRT in PD alone was due to the slow elimination in the later phase of the plasma concentration–time curve after administration of PD alone. On the other hand, after i.v. injection of CS–GP, the concentrations of the total and free dugs decayed in a more linear manner. However, the VRT values of total, free and conjugated PD given by CS–GP were not significantly different from that given by PD alone.
Table 1. Pharmacokinetic Parameters Obtained from the Moment Analysis
| Preparation | Drug species | AUC (0–7 h) (µg·h/mL) | MRT (0–7 h) (h) | VRT (0–7 h) (h2) |
|---|
| PD alone | PD | 2.10±0.25 | 1.32±0.22 | 1.80±0.80 |
| CS–GP | Total PD | 28.37±2.70# | 1.20±0.03 | 1.37±0.16 |
| Free PD | 5.25±0.27 | 1.48±0.11 | 1.21±0.11 |
| Conjugated PD | 23.12±2.82# | 1.12±0.06 | 1.36±0.17 |
The results are expressed as the mean±S.E. (n=4). # p<0.01 vs. PD (PD alone) (Dunnett’s test).
Inflammation was found to occur most severely near the heel in both right and left hind paws. Each inflammatory joint was taken by cutting the limb and foot close to the joint. The skin of the taken joint was peeled, and the resultant peeled inflammatory joint was used as a sample for measurement of the distributed drug amount. The right hind paw joint weighed 1.5–2.0 g, and the left hind paw joint weighed 1.0–1.6 g; that is, the right hind paw joint tended to be heavier than the left hind paw joint.
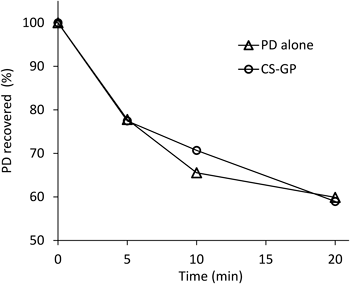
The amount of drug recovered from the inflammatory joint was determined by spiking the homogenate with a known amount of the drug and subsequent treatment for HPLC analysis. Namely, free PD was recovered by denaturation with acetonitrile under the condition of weakly acidic pH. The recovery ratio of free PD from the joint homogenate was 85% (w/w). On the other hand, total PD was investigated by hydrolysis of the ester bond with a 0.1 N NaOH aqueous solution and subsequent treatment using acetonitrile. The recovery rate of the total (free+conjugated) PD for CS–GP was 49% (w/w). The decrease in the recovery rate for the total PD was considered to be due to the use of 0.1 N NaOH at 45°C in ester hydrolysis. Therefore, the stability characteristics of PD and CS–GP were investigated using 0.1 N NaOH aqueous solution at 45°C (Fig. 5). As a result, PD remained at approximately 60% after incubation in 0.1 N NaOH aqueous solution for 10 min. For CS–GP, nearly 30% of PD was decomposed 10 min after incubation of the stability test in a 0.1 N NaOH aqueous solution. Treatment under an alkaline condition was a major reason in the decrease in the recovery of the total PD. The determination was conducted with the standard curve including these phenomena; that is, correction by the recovery rates of PD and CS–GP were taken into account in the results (see Fig. 6).
The drug concentration–time profiles in the inflammatory joint tissues were measured after i.v. administration to disease-model rats. Free PD concentration was measured after i.v. administration of both PD alone and CS–GP. The results are shown in Fig. 6. In addition, the distribution of conjugated PD was calculated by subtracting the free PD amount from the total PD amount, and is described in Fig. 6. At 1 h after i.v. administration, PD alone exhibited a higher PD level than the total PD level given by CS–GP, but the drug concentration was eliminated fairly rapidly. At 7 h after i.v. administration, the total and conjugated PD concentrations by CS–GP were higher than the PD concentration by PD alone; a significant difference was observed for the left hind paw joint (p<0.01). At 24 h, the total and conjugated PD levels were significantly higher than that by PD alone (p<0.05 for the right hind paw joint, p<0.01 for the left hind paw joint). These total and conjugated PD levels tended to be rather higher at 24 h than at 7 h. This might be due to the following reasons; although the plasma level of CS–GP decreased to the fairly low level at 7 h after administration, CS–GP still remained in the systemic circulation to some extent. Therefore, CS–GP was considered to be possibly delivered to the inflammatory site even after 7 h. In addition, CS–GP seemed to be well-retained in the joint tissues once delivered there; CS–GP might interact with the joint tissue components, which was found from the preliminary studies in the mixing of CS–GP and the tissues (data not shown). Also, as the release of PD from CS–GP was slow at the acidic joint pH, CS–GP was considered to be kept long in the conjugate form at the joint. These features were presumed to contribute to the high localization of CS–GP in the inflammatory joint at 24 h.
After administration of CS–GP, free PD was observed at a low but almost constant level, which was 0.09–0.14 µg/mL for the right hind paw joint and 0.06–0.11 µg/mL for the left hind paw joint. At 24 h after i.v. administration, the free PD concentrations were similar for both CS–GP and PD alone. Since the pH of an inflammatory joint tends to be weakly acidic, the drug release was considered to be caused slowly. As CS–GP remained in inflammatory joints at much higher level at 24 h, the free PD level was expected to be retained longer because of the drug supply from the conjugate distributed in the inflammatory tissue. On the other hand, the drug was eliminated faster for PD alone. Reportedly, the effective concentration of PD for immunological suppression was shown to be several dozen—nearly one hundred ng/mL.7,25) CS–GP showed good localization to inflammatory joints, prolonged retention there and sustained release of free PD, leading to higher efficacy of CS–GP than PD alone, which was reported previously.18)
Joint Drug Distribution in AIA and Healthy RatsIn order to evaluate the passive targeting ability of CS–GP, the concentrations of the total (conjugated+free) PD distributed into the joint tissue at 24 h after i.v. administration were compared between AIA and healthy rats. The results are shown in Fig. 7. The total PD concentration in the joint tissue was found to be higher in AIA rats than healthy rats. The total PD concentration of the left hind paw was significantly greater in AIA rats than in healthy rats (p<0.05). As to the right hind paw, the mean total PD level was more than twice greater in AIA rats than in healthy rats, though the significant difference was not found (p>0.05), which was probably due to the large variation of the data in AIA rats. These results suggested that CS–GP could give better localization of the drug in the arthritic tissue than in the normal one, which supported that CS–GP should exhibit a good passive targeting ability based on EPR effect.
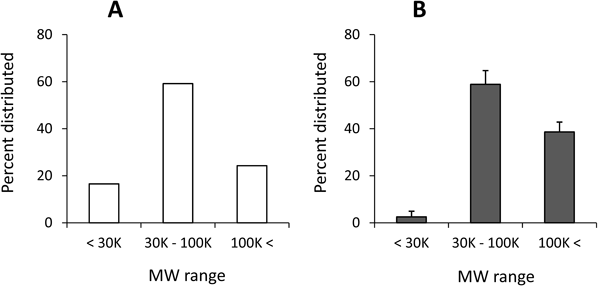
Physicochemical State of CS–GP in Systemic CirculationThe plasma sample collected 1 h after i.v. injection of CS–GP was diluted with PBS so that the resultant mixture could pass smoothly through the ultrafiltration membrane (Amicon Ultra). Namely, the plasma sample was diluted to 10-fold volume for the membrane with MW 100 K cutoff, and to 20-fold volume for the membrane with MW 30K cutoff. The diluted plasma and its filtrates obtained by ultrafiltration were analyzed for their concentration of total PD. The amount of CS–GP was calculated from the content of total PD in the MW range (<30K, 30–100 K, 100 K<). The results were obtained as shown in Fig. 8B. The MW distribution of original CS–GP was investigated in a similar manner after CS–GP was dissolved in PBS, and is shown in Fig. 8A. CS–GP in PBS was mainly distributed in the MW range of 30–100 K, which was consistent with the average MW from the company product information.
The apparent MW of CS–GP in the plasma sample was higher than the MW of original CS–GP before administration. As to this reason, two possibilities could be proposed. One was that the part of CS with low MW was eliminated by the urinary excretion, resulting in the part of CS with high MW remained in the systemic circulation. The other possibility was that the apparent molecular weight of CS might increase in the systemic circulation. In the literature, CS is known to interact with a cationic protein, lysozyme.26) Various plasma proteins, particularly cationic proteins, might be related to the interaction with CS. The interaction of CS with different plasma proteins including serum albumin will be clarified in the following report. The pharmacokinetics and MW change of CS have already been reported, and it is known to be present systemically or excreted in urine, partly with fairly high MW and partly with small fragments including sulfate ion.27–29) Namely, CS was considered to undergo its own metabolism and elimination in the body, and CS–GP was expected to be subjected to the fate of CS. CS–GP obtained from the plasma at 1 h after the intravenous injection was considered to have high MW to a considerable extent. Its MW distribution profile might imply the interaction of remaining high MW CS–GP with the plasma components. At that time, the increase in apparent molecular weight might be associated with the good localization and prolonged retention of CS–GP in inflammatory joints; generally, macromolecules with high MW display higher systemic retention and better localization at an inflammation site.30,31) The electrical properties of CS might function beneficially for passive targeting to arthritic sites. The interaction of CS and plasma components will be made clear in the future.
CONCLUSION
The pharmacokinetic features and drug distribution at the arthritic site of chondroitin sulfate–glycyl-prednisolone conjugate (CS–GP) were investigated to elucidate the mechanism of high and promoted efficacy. The release of PD from CS–GP at weakly acidic pH in rheumatoid arthritis was analyzed, in which PD was released slowly for several days or more. Pharmacokinetics and drug distribution studies were performed using rats with adjuvant-induced arthritis. From the plasma concentration–time profiles after i.v. administration, CS–GP exhibited very high retention in the systemic circulation, which suggested the passive targeting ability of CS–GP based on the EPR effect. More PD was distributed in inflammatory joints with PD alone than CS–GP at 1 h after i.v. administration, but the drug concentration was eliminated faster with PD alone. On the other hand, CS–GP exhibited prolonged joint distribution from 1 h until 24 h, and the regenerated free PD was also maintained at a fairly constant level. At 24 h after i.v. administration, the total and conjugated PD levels were much higher with CS–GP than PD alone. The good localization and prolonged retention of the drug were considered to be due to the EPR effect at the inflammatory site. The apparent molecular weight of CS–GP in the systemic circulation was observed to be high, which might be associated with the good delivery of CS–GP to the diseased site. The pharmacokinetics, biodistribution and physicochemical properties of CS–GP were considered to lead to its excellent anti-arthritic function.
REFERENCES
- 1) Lawrence RC, Felson DT, Helmick CG, Arnold LM, Choi H, Deyo RA, Gabriel S, Hirsch R, Hochberg MC, Hunder GG, Jordan JM, Katz JN, Kremers HM, Wolfe F, National Arthritis Data Workgroup. Estimates of the prevalence of arthritis and other rheumatic conditions in the United States. Part II. Arthritis Rheum., 58, 26–35 (2008).
- 2) Andreas K, Lübke C, Häupl T, Dehne T, Morawietz L, Ringe J, Kaps C, Sittinger M. Key regulatory molecules of cartilage destruction in rheumatoid arthritis: an in vitro study. Arthritis Res. Ther., 10, R9 (2008).
- 3) Liu XM, Quan LD, Tian J, Alnouti Y, Fu K, Thiele GM, Wang D. Synthesis and evaluation of a well-defined HPMA copolymer–dexamethasone conjugate for effective treatment of rheumatoid arthritis. Pharm. Res., 25, 2910–2919 (2008).
- 4) Cojocaru M, Chicoş B. Genetic differences between patients with rheumatoid arthritis. Rom. J. Intern. Med., 51, 89–91 (2013).
- 5) Glant TT, Mikecz K, Rauch TA. Epigenetics in the pathogenesis of rheumatoid arthritis. BMC Med., 12, 35 (2014).
- 6) Ward JR, Cloud RS. Comparative effect of antirheumatic drugs on adjuvant-induced polyarthritis in rats. J. Pharmacol. Exp. Ther., 152, 116–121 (1966).
- 7) Czock D, Keller F, Rasche FM, Häussler U. Pharmacokinetics and pharmacodynamics of systemically administered glucocorticoids. Clin. Pharmacokinet., 44, 61–98 (2005).
- 8) Quan LD, Purdue PE, Liu XM, Boska MD, Lele SM, Thiele GM, Mikuls TR, Dou H, Goldring SR, Wang D. Development of a macromolecular prodrug for the treatment of inflammatory arthritis: mechanisms involved in arthrotropism and sustained therapeutic efficacy. Arthritis Res. Ther., 12, R170 (2010).
- 9) van den Hoven JM, Hofkens W, Wauben MH, Wagenaar-Hilbers JP, Beijnen JH, Nuijen B, Metselaar JM, Storm G. Optimizing the therapeutic index of liposomal glucocorticoids in experimental arthritis. Int. J. Pharm., 416, 471–477 (2011).
- 10) Higaki M, Ishihara T, Izumo N, Takatsu M, Mizushima Y. Treatment of experimental arthritis with poly(D,L-lactic/glycolic acid) nanoparticles encapsulating betamethasone sodium phosphate. Ann. Rheum. Dis., 64, 1132–1136 (2005).
- 11) Teshima M, Fumoto S, Nishida K, Nakamura J, Ohyama K, Nakamura T, Ichikawa N, Nakashima M, Sasaki H. Prolonged blood concentration of prednisolone after intravenous injection of liposomal palmitoyl prednisolone. J. Control. Release, 112, 320–328 (2006).
- 12) Quan LD, Yuan F, Liu XM, Huang JG, Alnouti Y, Wang D. Pharmacokinetic and biodistribution studies of N-(2-hydroxypropyl)methacrylamide copolymer–dexamethasone conjugates in adjuvant-induced arthritis rat model. Mol. Pharm., 7, 1041–1049 (2010).
- 13) van den Hoven JM, Van Tomme SR, Metselaar JM, Nuijen B, Beijnen JH, Storm G. Liposomal drug formulations in the treatment of rheumatoid arthritis. Mol. Pharm., 8, 1002–1015 (2011).
- 14) Clegg DO, Reda DJ, Harris CL, Klein MA, O’Dell JR, Hooper MM, Bradley JD, Bingham CO III, Weisman MH, Jackson CG, Lane NE, Cush JJ, Moreland LW, Schumacher HR Jr, Oddis CV, Wolfe F, Molitor JA, Yocum DE, Schnitzer TJ, Furst DE, Sawitzke AD, Shi H, Brandt KD, Moskowitz RW, Williams HJ. Glucosamine, chondroitin sulfate, and the two in combination for painful knee osteoarthritis. N. Engl. J. Med., 354, 795–808 (2006).
- 15) Sawitzke AD, Shi H, Finco MF, Dunlop DD, Bingham CO III, Harris CL, Singer NG, Bradley JD, Silver D, Jackson CG, Lane NE, Oddis CV, Wolfe F, Lisse J, Furst DE, Reda DJ, Moskowitz RW, Williams HJ, Clegg DO. The effect of glucosamine and/or chondroitin sulfate on the progression of knee osteoarthritis: a report from the glucosamine/chondroitin arthritis intervention trial. Arthritis Rheum., 58, 3183–3191 (2008).
- 16) Imada K, Oka H, Kawasaki D, Miura N, Sato T, Ito A. Anti-arthritic action mechanisms of natural chondroitin sulfate in human articular chondrocytes and synovial fibroblasts. Biol. Pharm. Bull., 33, 410–414 (2010).
- 17) Onishi H, Matsuyama M. Conjugate between chondroitin sulfate and prednisolone with a glycine linker: preparation and in vitro conversion analysis. Chem. Pharm. Bull., 61, 902–912 (2013).
- 18) Onishi H, Isoda Y, Matsuyama M. In vivo evaluation of chondroitin sulfate–glycyl-prednisolone for anti-arthritic effectiveness and pharmacokinetic characteristics. Int. J. Pharm., 456, 113–120 (2013).
- 19) Hirano S, Wakazono K, Agata N, Mase T, Yamamoto R, Matsufuji M, Sakata N, Iguchi H, Tone H, Ishizuka M, Takeuchi T, Abe C. Effects of cytogenin, a novel anti-arthritic agent, on type II collagen-induced arthritis in DBA/1J mice and adjuvant arthritis in Lewis rats. Int. J. Tissue React., 16, 155–162 (1994).
- 20) Tachibana M, Inoue N, Yoshida E, Matsui M, Ukai Y, Yano J. Anti-inflammatory effect and low ulcerogenic activity of etodolac, a cyclooxygenase-2 selective non-steroidal anti-inflammatory drug, on adjuvant-induced arthritis in rats. Pharmacology, 68, 96–104 (2003).
- 21) Konador A, Kawiak J. Changes in chondroitin sulfate concentration in rabbit blood plasma depending on the method of its administration. Arch. Immunol. Ther. Exp. (Warsz.), 25, 895–903 (1977).
- 22) Conte A, de Bernardi M, Palmieri L, Lualdi P, Mautone G, Ronca G. Metabolic fate of exogenous chondroitin sulfate in man. Arzneimittelforschung, 41, 768–772 (1991).
- 23) Pecly IM, Melo-Filho NM, Mourão PA. Effects of molecular size and chemical structure on renal and hepatic removal of exogenously administered chondroitin sulfate in rats. Biochim. Biophys. Acta, 1760, 865–876 (2006).
- 24) Yamaoka K, Tanigawara Y, Nakagawa T, Uno T. A pharmacokinetic analysis program (multi) for microcomputer. J. Pharmacobiodyn., 4, 879–885 (1981).
- 25) Briggs WA, Gao ZH, Scheel PJ Jr, Burdick JF, Gimenez LF, Choi MJ. Differential glucocorticoid responsiveness of dialysis patients’ lymphocytes. Perit. Dial. Int., 16, 406–411 (1996).
- 26) Lee ES, Park KH, Kang D, Park IS, Min HY, Lee DH, Kim S, Kim JH, Na K. Protein complexed with chondroitin sulfate in poly(lactide-co-glycolide) microspheres. Biomaterials, 28, 2754–2762 (2007).
- 27) Wood KM, Wusteman FS, Curtis CG. The degradation of intravenously injected chondroitin 4-sulphate in the rat. Biochem. J., 134, 1009–1013 (1973).
- 28) Palmieri L, Conte A, Giovannini L, Lualdi P, Ronca G. Metabolic fate of exogenous chondroitin sulfate in the experimental animal. Arzneimittelforschung, 40, 319–323 (1990).
- 29) Ronca G, Conte A. Metabolic fate of partially depolymerized shark chondroitin sulfate in man. Int. J. Clin. Pharmacol. Res., 13 (Suppl.), 27–34 (1993).
- 30) Seymour LW, Miyamoto Y, Maeda H, Brereton M, Strohalm J, Ulbrich K, Duncan R. Influence of molecular weight on passive tumour accumulation of a soluble macromolecular drug carrier. Eur. J. Cancer, 31, 766–770 (1995).
- 31) Zhang JS, Imai T, Suenaga A, Otagiri M. Molecular-weight-dependent pharmacokinetics and cytotoxic properties of cisplatin complexes prepared with chondroitin sulfate A and C. Int. J. Pharm., 240, 23–31 (2002).