Abstract
Hematopoiesis in the bone marrow (BM) and spleen is controlled by stromal cells. Inflammation promotes myelopoiesis and simultaneously suppresses B lymphopoiesis. However, the role of the reciprocal regulation of myelopoiesis and B lymphopoiesis by stromal cells during inflammation is not fully understood. We investigated inflammation-induced alteration of hematopoietic regulation in lipopolysaccharide (LPS)-treated mice. C57BL/6 female mice were intravenously injected with a single, 5-µg dose of LPS, which induced a rapid decrease in the number of granulocyte-macrophage progenitors (colony-forming unit granulocyte-macrophage; CFU-GM) and B cell progenitors (CFU-preB) in BM. The CFU-GM count rapidly recovered, whereas the recovery of CFU-preB was delayed. LPS induced a marked increase in the number of CFU-GM but not in the number of CFU-preB in spleen. After LPS treatment, gene expression levels of positive regulators of myelopoiesis such as granulocyte colony-stimulating factor (G-CSF), interleukin (IL)-6, and granulocyte-macrophage colony-stimulating factor (GM-CSF) in BM and spleen were markedly upregulated whereas levels of positive regulators for B lymphopoiesis such as stromal cell-derived factor (SDF)-1, stem cell factor (SCF), and IL-7 remained unchanged. Meanwhile, the negative regulator of B lymphopoiesis tumor necrosis factor (TNF)-α was markedly up-regulated. The number of CFU-GM in S-phase in BM increased after LPS treatment, whereas the number of CFU-preB in S-phase decreased. These results suggest that LPS-activated stromal cells induce positive-dominant regulation of myelopoiesis and negative-dominant regulation of B lymphopoiesis, which facilitates emergency myelopoiesis during inflammation by suppressing B lymphopoiesis, thereby contributing to the host defense against infection.
Infection and inflammation augment myelopoiesis in a process referred to as emergency granulopoiesis, which is characterized by the mobilization of neutrophils from the bone marrow (BM), leading to inflammatory leukocytosis.1,2) In contrast, B lymphopoiesis is rather suppressed during infection and inflammation.3–6)
Hematopoiesis in hematopoietic tissues, such as the BM and the spleen, is regulated by positive and negative factors produced by stromal cells.7–9) In fact it has been reported that stromal cells produced positive regulators for myelopoiesis such as granulocyte colony-stimulating factor (G-CSF), interleukin (IL)-6, and granulocyte-macrophage colony-stimulating factor (GM-CSF), positive regulators for B lymphopoiesis such as stromal cell-derived factor (SDF)-1, stem cell factor (SCF) and IL-7 and negative regulators of B lymphopoiesis such as tumor necrosis factor (TNF)-α and transforming growth factor (TGF)-β.10–17) The alternative phenomena between B lymphopoiesis and granulopoiesis during inflammation suggest that the balance between positive and negative regulation of B lymphopoiesis and myelopoiesis may be reciprocally regulated during infection and inflammation.
Lipopolysaccharide (LPS), a major cell wall component of Gram-negative bacteria, is recognized by Toll-like receptor (TLR) 4 expressed on non-hematopoietic cells including stromal cells. Increased LPS caused by Gram-negative infection initiates emergent granulopoiesis by activating stromal cells to release cytokines such as G-CSF.18,19) Several in vitro studies showed that positive- and negative-regulator of B lymphopoiesis interact with each other. TNF-α down-regulated the expression of SDF-1 by stromal cell,20) TGF-β also down-regulated the expressions of SDF-1, SCF and IL-7.21–23) In contrast IL-7 down-regulates expression of TGF-β.24) It is also reported in in vivo study that inflammation induced by immunization reduced SCF and SDF-1 in the BM, resulting in suppressing B lymphopoiesis.4,5) The reduction of SDF-1 induced by immunization is attenuated in TNF-α-deficient mice, which suggests TNF-α could modulate SDF-1 production in the BM. These observations suggest the complexity of cytokine-cascade regulating B lymphopoiesis during inflammation. Furthermore, hematopoietic response was well studied about acute phase of infection or inflammation, however, the mechanism of restoration to steady-state hematopoiesis after inflammation subsides is not fully understood.
In the present study, we addressed whether the balance of stromal cell-derived positive and negative regulation of B lymphopoiesis and myelopoiesis is reciprocally altered during infection using an LPS-treated mouse model. We first observed the changes in the number of granulocyte-macrophage progenitor (colony-forming unit granulocyte-macrophage; CFU-GM) cells and B-cell progenitor (colony-forming unit preB; CFU-preB) cells in the BM and spleen of mice after LPS treatment, and then simultaneously observed the changes in gene expression levels of positive and negative regulators of myelopoiesis and B lymphopoiesis. Lastly, we observed changes in the absolute number of CFU-GM and CFU-preB cells in S-phase. The present results shed light on opposite changes in the balance between positive and negative regulation of myelopoiesis and B lymphopoiesis during infection and inflammation.
MATERIALS AND METHODS
MiceC57BL/6J female mice were purchased from CLEA Japan Inc. (Fuji, Japan). Mice were housed under pathogen-free conditions at 24±1°C and 55±10% relative humidity and with a 12-h light–dark cycle. Autoclaved tap water and food pellets were provided ad libitum. All protocols involving laboratory mice were reviewed by a peer review panel (the Interdisciplinary Monitoring Committee for the Right Use and Welfare of Experimental Animals at Nihon University School of Medicine [NUSM]) and approved by the Committee for Animal Care and Use at NUSM (experimental code 13APM028). The approved experimental protocol was performed humanely in strict accordance with the Guidelines for the Care and Use of Laboratory Animals, NUSM, Japan.
ReagentsRecombinant mouse GM-CSF and TNF-α were purchased from R&D Systems (Minneapolis, MN, U.S.A.). Fluorescein isothiocyanate (FITC)-conjugated rat anti-mouse Gr-1 monoclonal antibody (clone RB6-8C5) and phycoerythrin (PE)-conjugated rat anti-mouse CD11b monoclonal antibody (clone M1/70) were purchased from Becton Dickinson Biosciences (Franklin Lakes, NJ, U.S.A.).
LPS AdministrationEscherichia coli LPS055:B5 (Sigma Chemical Co., St. Louis, MO, U.S.A.), which is generally used in the field of experimental hematology, was diluted in pyrogen-free saline to a final concentration of 25 µg/mL, and mice were injected intravenously with a single, 5-µg dose.25,26) A control group of mice was injected with the same volume of pyrogen-free saline (i.e., 0.2 mL per mouse). Three mice from each treatment group were then evaluated 1, 3, and 6 h and 1, 2, 3, 5, and 7 d after treatment with LPS or saline.
Preparation of BM Cells and Spleen CellsBM cell suspensions were prepared by flushing the cells repeatedly from the femurs and dispersed by passing them repeatedly through a 23-gauge hypodermic needle with Iscove-modified Dulbecco’s medium (IMDM; Invitrogen Corp., Carlsbad, CA, U.S.A.) or α-minimum essential medium (α-MEM; Life Technology, Grand Island, NY, U.S.A.). BM cells from bilateral femora of three mice per experimental group were removed from each individual femur and their blood parameters were assayed separately. Splenic tissue samples were minced in ice-cold IMDM and gently homogenized with a Potter’s glass homogenizer to obtain a single-cell suspension. For the colonization assay, BM cells and spleen cells were pooled and assayed (see below).
In Vitro Colony AssaysThe method used to assay the colony formation by CFU-preB cells has been described in detail elsewhere.6,27) Briefly, BM or spleen cells were cultured in 35-mm plastic dishes (Falcon, Becton Dickinson) containing 1 mL MethoCult M 3630 medium (Stem Cell Technologies Inc., Vancouver, B.C., Canada), which consisted of IMDM containing 1% methylcellulose and supplemented with 30% fetal bovine serum (FBS), 0.1 mM 2-mercaptoethanol, 2 mM L-glutamine, and 10 ng/mL recombinant IL-7. Colony formation by CFU-GM cells was assayed using a semisolid medium containing GM-CSF.28) Briefly, BM or spleen cells were cultured in 35-mm plastic Petri dishes containing 1 mL MethoCult M 3231 medium (Stem Cell Technologies Inc.), which consisted of IMDM containing 1% methylcellulose and supplemented with 30% FBS, 1% bovine serum albumin, 0.1 mM 2-mercaptoethanol, 2 mM L-glutamine, and 10 ng/mL GM-CSF. Triplicate culture plates containing CFU-preB and CFU-GM cells were incubated at 37°C in a humidified atmosphere with 5% CO2. Aggregates of 50 or more cells were counted as colonies on day 7 for CFU-preB and CFU-GM cells.
Cell Suicide Experiments by Hydroxyurea (HU) to Count CFU-preB and CFU-GM Cells in S-PhaseEqual volumes of a cell suspension were placed into two test tubes. HU (Sigma-Aldrich) was dissolved in IMDM and added to one tube at a final concentration of 6×10⁻³ M.25,26,28) IMDM alone was added to the control. Both tubes were incubated for 1 h at 37°C. After washing three times with IMDM, CFU-preB and CFU-GM cell assays were performed. CFU-preB and CFU-GM cells in S-phase were selectively killed by HU. Thus, the proportions of cells in S-phase among CFU-preB and CFU-GM cells were calculated using the following formula: untreated colony number−HU-treated colony number/untreated colony number.
Preparation of Cultured BM Stromal CellsA stromal cell monolayer was prepared by culturing whole BM cells at 1×10⁶ cells/mL in a 6-well flat bottom plate (Falcon 3046 Becton Dickinson Labware) in 4 mL α-MEM supplemented with 10% FBS.29) After 7 d of culture, the supernatant was removed, and fresh medium was added. The cells were cultured for another 7 d, and a subconfluent stromal layer formed. Then, the supernatant was removed, and fresh medium was added again to the culture dish. After 2 d of culture, 100 ng/mL LPS was added to the culture dish. For the control, the same volume of pyrogen-free saline was added to the culture. After 1, 3, or 6 h of culture, the culture medium was removed completely, and stromal cells were used for RNA extraction.
Total RNA Extraction and Quantitative Real-Time PCR AnalysisTotal RNA was extracted from pooled BM cells from three mice per group using ISOGEN reagent (Nippongene Corp., Toyama, Japan) in accordance with the manufacturer’s instructions. The isolated mRNA was reverse transcribed using Superscript III (Life Technologies) and Oligo-dT (Promega Corp., Madison, WI, U.S.A.). Next, triplicate transcribed cDNA samples were analyzed with quantitative real-time PCR using TaqMan™ Universal Fast PCR master mix (Applied Biosystems, Foster City, CA, U.S.A.), specific primers, and probes using the Applied Biosystems 7900 Sequence Detection System. Specific primers and probes for murine SDF-1, SCF, IL-7, TGF-β, TNF-α, G-CSF, IL-6, GM-CSF, and glyceraldehyde phosphate dehydrogenase (GAPDH) genes were purchased from Applied Biosystems (TaqMan™ Gene Expression Assays; SDF-1, Mm00445552_ml; SCF, Mm00442972_m1; IL-7, Mm00434291_ml; TGF-β, Mm00441724_ml; TNF-α, Mm00113281_m1; G-CSF, Mm00438334_ml; IL-6, Mm00446190_ml; GM-CSF, Mm00438328_m1; GAPDH, Mm99999915_g1). Polymerase chain reaction (PCR) conditions and data analysis were performed in accordance with the instructions provided with the Sequence Detection System, version 2.0. All reactions were performed in triplicate. In accordance with the manufacturer’s instructions, cytokine-specific signals were normalized to GAPDH signals using the formula 2−ΔCt=2−(Ct GAPDH−Ct Cytokine), and relative levels of cytokine gene expression were calculated using the formula 2−ΔΔCt=2−(ΔCt, for LPS treatment −ΔCt, for control).
Flow Cytometry to Detect Gr-1 and CD11b Double Positive Immature Myeloid CellsBM or spleen cells were washed once with IMDM, and then cell pellets were suspended in 10 mL 0.86% NH4Cl for 5 min at 4°C to rupture the erythrocytes. Nuclear BM or spleen cells were then washed twice in IMDM. Cells were washed with PBS containing 2% FBS, and then 2×10⁵ cells suspended in 0.5 mL PBS containing 2% FBS and 0.02% NaN3 were incubated with FITC-conjugated rat anti-mouse Gr-1 monoclonal antibody and PE-conjugated rat anti-mouse CD11b monoclonal antibody for 30 min at 4°C. The cells were washed three times with PBS and placed on ice until assessment using a CytoACE-150 flow cytometer (Japan Spectroscopic Co., Ltd., Tokyo, Japan) to directly detect immature myeloid cells that are CD11b and Gr-1 double positive.
Statistical AnalysisAll data are presented as mean±standard deviation (S.D.) or mean±standard error (S.E.). The significance of differences among experimental groups was assessed using the two-tailed Student’s t-test. The cut-off value used to determine statistical significance was p<0.05.
RESULTS
Changes in the Number of CFU-preB and CFU-GM Cells in the Mouse BM and Spleen after LPS TreatmentTo observe B lymphopoiesis and myelopoiesis under inflammatory conditions, we used LPS as a substance that induced inflammation. The numbers of CFU-preB and CFU-GM progenitor cells in femoral BM were evaluated 6 h and 1, 2, 3, 5, and 7 d after treatment with 5 µg LPS. Changes in the numbers of CFU-preB and CFU-GM cells in the BM are shown in Figs. 1A and B. The absolute numbers of CFU-preB and CFU-GM cells in the femoral BM of untreated mice (day 0) were 30177±946 and 68835±2953 (mean±S.D.), respectively.
The number of CFU-preB cells in the BM of LPS-treated mice decreased to 27% of pretreatment levels by day 2, followed by a slow recovery to pretreatment levels by day 7 (Fig. 1A). The number of CFU-GM cells in treated mice showed a rapid decrease, reaching 56% of pretreatment levels by 6 h. However, the CFU-GM cell number promptly recovered to pretreatment levels by day 2, followed by an overshoot reaching 211% of pretreatment levels by day 3 and then a gradual decrease to 159% of the pretreatment levels by day 7 (Fig. 1B). The changes in the number of CFU-preB cells in LPS-treated mice were the opposite of the changes in the number of CFU-GM cells. As shown in Figs. 1A and B, recovery from the point of the lowest number of CFU-preB cells was much slower compared with that of CFU-GM cells. No overshoot was observed in CFU-preB cells during the 7 d examined in this study, whereas a large overshoot was observed for the CFU-GM cells on day 3.
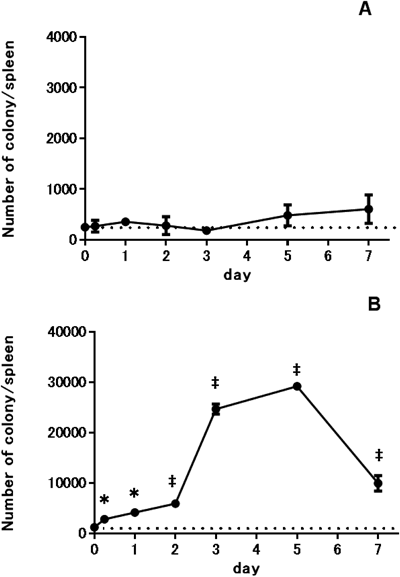
Changes in the numbers of CFU-preB and CFU-GM cells in the spleen of LPS-treated mice are shown in Figs. 2A and B, respectively. The absolute numbers of CFU-preB and CFU-GM cells in the spleen of untreated mice (day 0) were 247±65 and 1232±77 (mean±S.D.), respectively.
In the spleens of LPS-treated mice, the number of CFU-preB cells showed minimum oscillatory changes with no significant increase (Fig. 2A). The number of CFU-GM cells in LPS-treated mice, on the other hand, continuously increased, reaching 2372% of pretreatment levels by day 5. The increase was smaller for the first 2 d and then much greater for the next 3 d. After peaking at day 5, the number of CFU-GM cells decreased rapidly to 808% of pretreatment levels by day 7. Accordingly, changes in the number of CFU-preB cells and CFU-GM cells in LPS-treated mice were much different and reciprocal to each other.
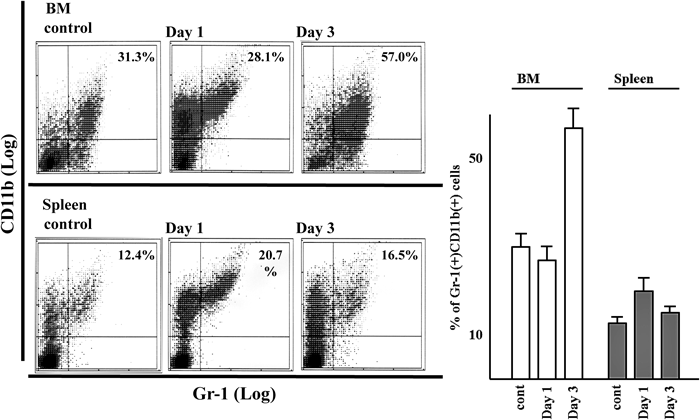
Changes in the Proportion of Immature Myeloid Cells That Were Gr-1 and CD11b Double Positive in the BM and Spleen after LPS TreatmentFigure 3 shows the change in the proportion of immature myeloid cells that were Gr-1 and CD11b double positive in the BM and spleen after LPS treatment.30) The proportions of immature myeloid cells in the BM in the non-treated control and 1 and 3 d after LPS treatment were 31.3%, 28.1%, and 57.0%, respectively. The proportions of immature myeloid cells in the spleen in the non-treated control and 1 and 3 d after LPS treatment were 12.4%, 20.7%, and 16.5%, respectively. An increase in the number of Gr-1 and CD11b double positive cells in the BM was observed as seen in the increased number of CFU-GM cells after 3 d of LPS treatment.
Changes in the Gene Expression Levels of Cytokine Regulatory Genes (SDF-1, SCF, IL-7, TGF-β, TNF-α, G-CSF, IL-6, and GM-CSF) in the BM and Spleen of LPS-Treated MiceWe next sought to determine the role of stromal cells in B lymphopoiesis and myelopoiesis in mice after LPS treatment. We evaluated the gene expression levels of SDF-1, SCF, and IL-7, which are positive regulators of B lymphopoiesis,10–12) and the gene expression levels of TGF-β and TNF-α, which are negative regulators of B lymphopoiesis.13,14) Gene expression levels of G-CSF, IL-6, and GM-CSF, positive regulators of myelopoiesis, were also evaluated.15–17) Notably, SDF-1, SCF, IL-7, TGF-β, TNF-α, G-CSF, IL-6, and GM-CSF are all expressed by stromal cells in the BM.
The gene expression levels of SDF-1, SCF, IL-7, TNF-α, G-CSF, IL-6, and GM-CSF in the BM of untreated mice were much lower than the gene expression level of TGF-β; the expression levels were 0.079, 0.0061, 0.00065, 0.096, 0.00032, 0.040, and 0.012, respectively, relative to the TGF-β level, which was set at 1.0. Similar to their expression in BM, the gene expression levels of SDF-1, SCF, IL-7, TNF-α, G-CSF, IL-6, and GM-CSF in the spleen were also markedly lower than the expression level of TGF-β (0.11, 0.095, 0.0037, 0.169, 0.028, 0.012, and 0.011, respectively, relative to TGF-β levels in untreated mice).
The gene expression levels of SDF-1, SCF, IL-7, TGF-β, TNF-α, G-CSF, IL-6, and GM-CSF in the BM of LPS-treated mice are shown in Figs. 4A–C. TGF-β mRNA expression in the BM rapidly increased after treatment to 201% of pretreatment levels by 1 h and then gradually decreased to 55% of pretreatment levels by day 1, followed by an increase to 133% of pretreatment levels by day 7 (Fig. 4A). SDF-1 expression levels in the BM rapidly increased to 347% of pretreatment levels by 1 h and then gradually decreased to 61% of pretreatment levels by day 2, followed by an oscillation between 261% and 334% of pretreatment levels (Fig. 4A).
Changes in SCF mRNA levels essentially paralleled those observed for SDF-1 mRNA levels (Fig. 4A). IL-7 expression levels in the BM rapidly increased to reach 210% of pretreatment levels by 3 h, then gradually decreased to 69% of pretreatment levels by day 1, followed by an oscillation between 96% and 214% of pretreatment levels (Fig. 4A).
TNF-α expression levels in the BM increased rapidly to reach 3480% of pretreatment levels by 1 h and gradually decreased to pretreatment levels by day 1, followed by a continuous increase up to 365% of pretreatment levels by day 7 (Fig. 4B).
G-CSF expression levels in the BM rapidly increased to reach 898267% of pretreatment levels by 1 h, and decreased to 88% of pretreatment levels by day 1, followed by an oscillation between 18% and 204% of pretreatment levels (Fig. 4C). IL-6 expression levels in the BM rapidly increased to reach 13583% of pretreatment levels by 1 h, followed by a decrease to 74% of pretreatment levels by day 3 and an increase to 225% of pretreatment levels by day 7 (Fig. 4C). GM-CSF expression levels in the BM rapidly increased to 808% of pretreatment levels by 3 h, and decreased to 89% of pretreatment levels by day 1, followed by an oscillation between 57% and 203% of pretreatment levels (Fig. 4C).
In the spleen, changes in gene expression levels of SDF-1, SCF, IL-7, TGF-β, TNF-α, G-CSF, IL-6, and GM-CSF in mice after LPS treatment were essentially the same as the changes in the BM but a little milder, as shown in Figs. 5A–C. TGF-β mRNA expression in the spleen decreased continuously after treatment, reaching 23% of pretreatment levels by day 2, followed by a gradual recovery to 105% of pretreatment levels by day 3 and then steady-state levels (Fig. 5A). The SDF-1 expression levels in the spleen decreased rapidly to 57% of pretreatment levels by 1 h, followed by a slight increase to 122% of pretreatment levels by 3 h, a gradual decrease to 6.8% of pretreatment levels by day 1, and near steady-state levels (126%) by day 7 after a steeper 161% increase to pretreatment levels (Fig. 5A). The changes in SCF mRNA levels essentially paralleled those observed for SDF-1 mRNA (Fig. 5A). IL-7 expression levels in the spleen rapidly decreased to 59% of pretreatment levels by 1 h, followed by a rapid overshoot to 271% of pretreatment levels by 3 h, a gradual decrease to 29% of pretreatment levels by day 1, and a continuous increase to 315% of pretreatment levels by day 7 (Fig. 5A).
TNF-α expression in the spleen rapidly increased to 610% of pretreatment levels by 3 h, followed by a gradual decrease to 30% of pretreatment levels by day 2, a gradual recovery to pretreatment levels by day 5, and no change thereafter (Fig. 5B).
G-CSF expression levels in the BM rapidly increased to reach 1431% of pretreatment levels by 3 h and decreased to 135% of pretreatment levels by day 1, followed by an oscillation between 91% and 395% of pretreatment levels (Fig. 5C). IL-6 expression levels in the BM rapidly increased to reach 3316% of pretreatment levels by 3 h, followed by a decrease to 78% of pretreatment levels by day 2, an increase to 299% of pretreatment levels by day 5, and no change thereafter (Fig. 5C). GM-CSF expression levels in the BM rapidly increased to 1246% of pretreatment levels by 3 h and decreased rapidly to 165% of pretreatment levels by 6 h, followed by an oscillation between 112% and 388% of pretreatment levels (Fig. 5C).
To elucidate the balance of positive and negative regulation of B lymphopoiesis, it is necessary to evaluate our models in different perspective. Thus we determined the changes in the ratio of the gene expression of cytokines to TGF-β after treatment of LPS.28) The ratios of gene expression of cytokines to that of TGF-β (cytokines/TGF-β) after treatment with LPS were calculated and are shown in Figs. 4a–c and Figs. 5a–c.
In BM, TNF-α/TGF-β rapidly increased to 1.67 (Fig. 4b), whereas SDF-1/TGF-β, SCF/TGF-β, and IL-7/TGF-β remained much lower than 0.15 (Fig. 4a). Furthermore, G-CSF/TGF-β increased to 1.42, and IL-6/TGF-β increased to 2.75 (Fig. 4c).
In the spleen, TNF-α/TGF-β rapidly increased to 1.32 (Fig. 5b), whereas SDF-1/TGF-β, SCF/TGF-β, and IL-7/TGF-β remained much lower than 0.31 (Fig. 5a). Furthermore, G-CSF/TGF-β increased to 0.51, and IL-6/TGF-β increased to 0.51 (Fig. 5c).
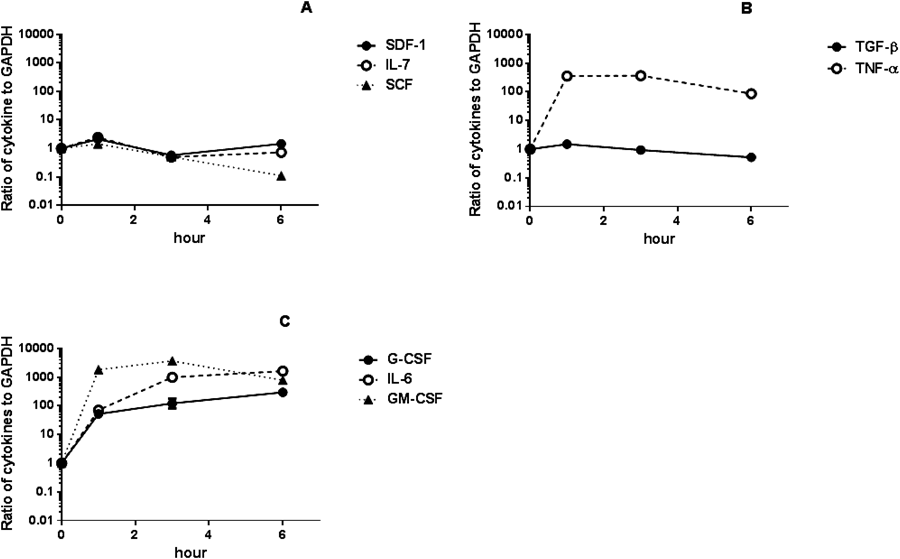
Changes in the Gene Expression Levels of Cytokine Regulatory Genes (SDF-1, SCF, IL-7, TGF-β, TNF-α, G-CSF, IL-6, and GM-CSF) in Cultured BM Stromal Cells after LPS TreatmentFigure 6 shows the changes in the expression levels of cytokines in cultured BM stromal cells after treatment with 100 ng/mL LPS. The results are expressed as the ratio to each cultured stromal cell fraction without LPS treatment.
The gene expression levels of positive regulators for B lymphopoiesis such as SDF-1, IL-7, and SCF in the cultured BM stromal cells treated with LPS are shown in Fig. 6A. The gene expression of SDF-1, IL-7, and SCF was increased to 211%, 245%, and 143%, respectively, of pretreatment levels by 1 h after LPS treatment, followed by a decrease. The gene expression levels of negative regulators for B lymphopoiesis such as TNF-α and TGF-β in the cultured BM stromal cells treated with LPS are shown in Fig. 6B. The gene expression of TNF-α was increased to 35820% of pretreatment levels by 1 h after LPS treatment and remained unchanged at 3 h, followed by a decrease. The gene expression of TGF-β was increased to 151% of pretreatment levels by 1 h after LPS treatment, followed by a decrease. The gene expression levels of positive regulators for myelopoiesis such as G-CSF, IL-6, and GM-CSF in the cultured BM stromal cells treated with LPS are shown in Fig. 6C. The gene expression of G-CSF and IL-6 was continuously increased to 29750% and 163630%, respectively, of pretreatment levels by 6 h after LPS treatment. The gene expression of GM-CSF was continuously increased to 368850% of pretreatment levels by 3 h after LPS treatment, followed by a decrease to 79190%.
Effect of TNF-α on Colony Formation by CFU-preB CellsBecause the gene expression level of TNF-α was markedly up-regulated by LPS, TNF-α may play a key role in suppression of B lymphopoiesis after LPS treatment. To determine whether TNF-α directly affects the proliferation or differentiation of CFU-preB cells, we cultured whole BM cells in a semi-solid medium system containing 10 ng/mL IL-7 in the presence of various concentrations of TNF-α and measured the number of colonies (Fig. 7). The number of CFU-preB colonies in the absence of TNF-α was 76.3±8.6 per 1×10⁵ cells. The numbers of CFU-preB colonies in the presence of 1 ng/mL and 10 ng/mL TNF-α were 67.0±9.5 and 53.3±4.9 per 1×10⁵ cells, respectively.
Changes in the Number of CFU-preB and CFU-GM Cells in S-Phase in the BM of LPS-Treated MiceChanges in the number of CFU-preB and CFU-GM cells in S-phase in the BM after LPS treatment were examined using a low concentration of HU (Fig. 8). The absolute numbers of BM CFU-preB and CFU-GM cells in S-phase in untreated mice were 11648±1237 and 17621±1664 (mean±S.E.), respectively.
The number of BM CFU-preB cells in S-phase in the LPS-treated mice decreased to 20% of pretreatment levels by day 1, remained unchanged during day 2 through day 3, and then increased to 161% of pretreatment levels (Fig. 8A). The number of BM CFU-GM cells in S-phase in the LPS-treated mice slightly increased to 120% of pretreatment levels by day 1, remained unchanged on day 2, and increased again to 363% of pretreatment levels by day 5, followed by a decrease to 217% of pretreatment levels by day 7 (Fig. 8B).
DISCUSSION
Hematopoiesis in hematopoietic tissues is strictly regulated by stromal cells via diffusible factors and direct cellular interactions with adherent molecules.7–9) During steady-state, hematopoietic progenitor cells are mostly in the resting state. However, along with an increased demand for supplying mature hematopoietic cells to the periphery, hematopoietic progenitor cells in the resting state enter the cell cycle. Consequently, hematopoietic progenitor pools become dominated by negatively acting signals during steady-state, and negative-dominant regulation of hematopoietic progenitor cells converts to positive-dominant regulation during perturbed conditions. While infection and inflammation promote myelopoiesis, B lymphopoiesis is suppressed in the BM.3–6,31) In this study, we focused on the mechanisms of such reciprocal regulatory functions of stromal cells for B lymphopoiesis and myelopoiesis using a comprehensive overview approach. Few previous reports seems to be available regarding an alternating change in the balance of positive and negative regulators produced by stromal cells for myelopoiesis and B lymphopoiesis. LPS is an inflammation-inducing compound that activates stromal cells in the BM and spleen via TLR4.18,19) Thus, LPS-treated mice are an appropriate experimental model to study how the balance of positive and negative factors between B lymphopoiesis and myelopoiesis induced by stromal cells is altered during inflammation.
An intravenous injection of LPS into mice resulted in rapid decreases in the number of CFU-preB and CFU-GM cells in the BM. An inflammatory change mobilizes not only myeloid progenitor cells but also B lymphoid progenitor cells from the BM to the peripheral circulation.32) Thus, the simultaneous decrease in the number of hematopoietic progenitor cells such as CFU-preB and CFU-GM cells in the BM soon after LPS treatment may be due to the release of hematopoietic progenitor cells from the BM to the peripheral circulation. However, recovery of the number of CFU-GM cells in the BM from the nadir was rapid, whereas the recovery in the number of CFU-preB cells was prolonged (Figs. 1A, B). These results are compatible with previous reports.5,25,31) Flow cytometry analysis showed that the proportion of immature myeloid cells in the BM was increased in parallel with the increase in CFU-GM cells 3 d after LPS treatment, which indicates that myelopoiesis in the BM was activated soon after LPS treatment (Figs. 1B, 3).
After LPS treatment, the gene expression levels of negative regulators for B lymphopoiesis such as TNF-α were markedly up-regulated in 1 h. However, the extent of the up-regulation of positive regulators for B lymphopoiesis, such as SDF-1, SCF, and IL-7, was much smaller compared with that of TNF-α (Figs. 4A, B). It is reported that the positive regulators of B lymphopoiesis such as SCF and SDF-1 were down-regulated in C57BL/6 mice immunized with acetyl-chicken γ globulin.4,5) In the case of C57BL/6 mice treated with LPS, the down-regulations of those cytokines were not observed. Because TNF-α directly inhibited the proliferation and differentiation of CFU-preB cells (Fig. 7), TNF-α probably plays a key role in suppression of B lymphopoiesis after LPS treatment. Furthermore, the small but significant increase in the TGF-β mRNA level 1 h after LPS treatment suggests that TGF-β also may play a small role in suppression of B lymphopoiesis in LPS-treated mice. In contrast, the gene expression levels of positive regulators of myelopoiesis, such as G-CSF, IL-6, and GM-CSF, were markedly up-regulated (Fig. 4C). To determine if the changes in cytokine gene expression levels observed in Fig. 4 were induced by stromal cells in BM, the effects of LPS on the expression levels of cytokines were evaluated in cultured stromal cells separated from the BM (Fig. 6). The gene expression levels of TNF-α, G-CSF, IL-6, and GM-CSF in cultured BM stromal cells were all markedly increased, whereas the increases in gene expression levels of SDF-1, IL-7, and SCF were limited. These in vitro data are compatible with those of our in vivo experiments.
Taken together, LPS likely induced negative-dominant regulation of B lymphopoiesis by activating stromal cells, whereas it induced positive-dominant regulation of myelopoiesis, which may have induce delayed recovery in the number of CFU-preB cells compared to the recovery from an overshoot in CFU-GM cells.
In untreated mice, the percentages of CFU-GM and CFU-preB cells in S-phase in the BM were 24.9±1.0% and 39.1±3.12%, respectively. Although the percentage of CFU-preB cells in S-phase was slightly higher than that of CFU-GM cells, most of the CFU-preB cells were in the resting state. The gene expression levels of positive regulators, such as SDF-1, SCF, and IL-7, in the BM of untreated mice were much lower than that of negative regulators such as TGF-β (Fig. 4A). The ratios of the gene expression levels of SDF-1, SCF, and IL-7 to that of TGF-β were 0.079, 0.0061, and 0.00065, respectively (Fig. 4A). The data suggest that B lymphopoiesis is also dominated by negative-acting signals in the steady-state. The absolute numbers of CFU-preB and CFU-GM cells in S-phase are influenced by the balance of positive and negative regulation of B lymphopoiesis and myelopoiesis controlled by stromal cells. LPS treatment decreased the number of CFU-preB cells in S-phase, whereas it increased the number of CFU-GM cells in S-phase (Fig. 8A). These data also suggest that LPS induced negative-dominant regulation of B lymphopoiesis and positive-dominant regulation of myelopoiesis in the BM.
Intravenous injection of LPS into mice resulted in a markedly increased number of CFU-GM cells in the spleen as observed in previous reports.25,26) In contrast, an increase in the number of CFU-preB cells was not observed. It is reported that increased CFU-preB number in the spleen was observed in C57 BL/6 mice immunized with acetyl-chicken γ globulin, of which phenomenon was attributed to that the down-regulation of SDF-1 in the BM facilitated the release of CFU-preB cells from the BM to the spleen.4) It seems likely that LPS dose not down-regulate SDF-1 in the BM and consequently the number of CFU-preB does not increase. After LPS treatment, the changes in the gene expression levels of the regulators of B lymphopoiesis and myelopoiesis in the spleen were similar to the changes in the BM. Specifically, LPS treatment induced negative-dominant regulation of B lymphopoiesis (TNF-α) and simultaneously induced positive-dominant regulation of myelopoiesis (G-CSF, IL-6, and GM-CSF), which markedly increased the number of splenic CFU-GM cells but not splenic CFU-preB cells.
Systemic inflammation, such as bacterial infection, seems to induce mobilization of neutrophils and a subsequent acceleration of myelopoiesis to replenish the mature, consumed neutrophils. The local regulation by stromal cells in the BM likely facilitates emergency myelopoiesis during inflammation by suppressing B lymphopoiesis, thereby contributing to the host defense against infection.
Acknowledgments
We thank Sonoko Araki and Miyuki Yuda for their technical assistance. This work was supported in part by a Grant-in-Aid for Science Research C from the Japan Society for the Promotion of Science.
REFERENCES
- 1) Basu S, Hodgson G, Zhang HH, Katz M, Quilici C, Dunn AR. “Emergency” granulopoiesis in G-CSF-deficient mice in response to Candida albicance infection. Blood, 95, 3725–3733 (2000).
- 2) Hirai H, Zhang P, Dayaram T, Hetherington CJ, Mizuno S, Imanishi J, Akashi K, Tenen DG. C/EBP beta is required for ‘emergency’ granulopoiesis. Nat. Immunol., 7, 732–739 (2006).
- 3) Nagaoka H, Gonzalez-Aseguinolaza G, Tsuji M, Nussenzweig MC. Immunization and infection change the number of recombination activating gene (RAG)-expressing B cell in the periphery by altering immature lymphocyte production. J. Exp. Med., 191, 2113–2120 (2000).
- 4) Ueda Y, Yang K, Foster SJ, Kondo M, Kelsoe G. Inflammation controls B lymphopoiesis by regulating chemokine CXCL12 expression. J. Exp. Med., 199, 47–58 (2004).
- 5) Ueda Y, Kondo M, Kelsoe G. Inflammation and the reciprocal production of granulocytes and lymphocytes in bone marrow. J. Exp. Med., 201, 1771–1780 (2005).
- 6) Minami A, Tsuboi I, Harada T, Fukumoto T, Hiramoto M, Koshinaga M, Hirabayashi Y, Kanno J, Inoue T, Aizawa S. Inflammatory biomarker, neopterin, suppresses B lymphopoiesis for possible facilitation of granulocyte responses, which is severely altered in age-related stromal-cell-impaired mice, SCI/SAM. Exp. Biol. Med. (Maywood), 232, 134–145 (2007).
- 7) Dexter TM, Allen TD, Lajtha LG. Condition controlling the proliferation of hematopoietic stem cells in vitro. J. Cell. Physiol., 91, 335–344 (1977).
- 8) Mori KJ, Fujitake H, Okubo H, Dexter TM, Ito Y. Quantitative development of adherent cell colonies in bone marrow cell culture in vitro. Exp. Hematol., 7, 171–176 (1979).
- 9) Aizawa S, Yaguchi M, Nakano M, Toyama K, Inokuchi S, Imai T, Yasuda M, Nabeshima R, Handa H. Hematopoietic supportive function of human bone marrow stromal cell lines established by a recombinant SV40-adenovirus vector. Exp. Hematol., 22, 482–487 (1994).
- 10) Nagasawa T, Kikutani H, Kishimoto T. Molecular cloning and structure of a Pre-B-cell growth-stimulating factor. Proc. Natl. Acad. Sci. U.S.A., 91, 2305–2309 (1994).
- 11) Waskow C, Paul S, Haller C, Gassmann M, Rodewald HR. Viable c-kit (w/w) mutant reveal pivotal role for c-kit in the maintenance of lymphopoiesis. Immunity, 17, 277–288 (2002).
- 12) Namen AE, Lupton S, Hjerrild K, Wignall J, Mochizuki DY, Schmierer A, Mosley B, March CJ, Urdal D, Gillis S. Stimulation of B-cell progenitors by cloned murine interleukin-7. Nature, 333, 571–573 (1988).
- 13) Lee G, Namen AE, Gillis S, Ellingsworth LR, Kincade PW. Normal B cell precursors responsive to recombinant murine IL-7 and inhibition of IL-7 activity by transforming growth factor-beta. J. Immunol., 142, 3875–3883 (1989).
- 14) Fernandez S, Knopf MA, Shankar G, McGillis JP. Calcitonin gene-related peptide indirectly inhibits IL-7 responses in pre-B cells by induction of IL-6 and TNF-alpha in bone marrow. Cell. Immunol., 226, 67–77 (2003).
- 15) Nicola NA, Metcalf D, Matsumoto M, Johnson GR. Purification of a factor inducing differentiation in murine myelomonocytic leukemia cells. Identification as granulocyte colony-stimulating factor. J. Biol. Chem., 258, 9017–9023 (1983).
- 16) Ikebuchi K, Wong GG, Clark SC, Ihle JN, Hirai Y, Ogawa M. Interleukin 6 enhancement of interleukin 3-dependent proliferation of multipotential hemopoietic progenitors. Proc. Natl. Acad. Sci. U.S.A., 84, 9035–9039 (1987).
- 17) Gough NM, Metcalf D, Gough J, Grail D, Dunn AR. Structure and expression of the mRNA for murine granulocyte-macrophage colony stimulating factor. EMBO J., 4, 645–653 (1985).
- 18) Iwasaki A, Medzhitov R. Toll-like receptor control of adaptive immune responses. Nat. Immunol., 5, 987–995 (2004).
- 19) Boettcher S, Ziegler P, Schmid MA, Takizawa H, van Rooijen N, Kopf M, Heikenwalder M, Manz MG. Cutting Edge: LPS-induced emergency myelopoiesis depends on TLR4-expressing nonhematopoietic cells. J. Immunol., 188, 5824–5828 (2012).
- 20) Zhang Q, Guo R, Schwarz EM, Boyce B, Xing L. TNF inhibits production of stromal cell-derived factor 1 by bone stromal cells and increases osteoclast precursor mobilization from bone marrow to peripheral blood. Arthritis Res. Ther., 10, R37 (2008).
- 21) Heinrich MC, Dooley DC, Keeble WW. Transforming growth factor beta1 inhibits expression of the gene products for factor and its receptor (c-kit). Blood, 85, 1769–1780 (1995).
- 22) Wright N, de Lera TL, García-Moruja C, Lillo R, García-Sánchez F, Caruz A, Teixidó J. Transforming growth factor-beta1 down-regulates expression of chemokine stromal cell-derived factor-1: functional consequences in cell migration and adhension. Blood, 102, 1978–1984 (2003).
- 23) Tang J, Nuccie BL, Ritterman I, Liesveld JL, Abboud CN, Ryan DH. TGF-β down-regulates stromal IL-7 secretion and inhibits proliferation of human B cell precursors. J. Immunol., 159, 117–125 (1997).
- 24) Dubinett SM, Huang M, Dhanani S, Wang J, Beroiza T. Down-regulation of macrophage transforming growth factor-β messenger RNA expression by IL-7. J. Immunol., 151, 6670–6680 (1993).
- 25) Hokari T, Tsuboi I, Harada T, Oshima H, Hirabayashi Y, Kanno J, Inoue T, Aizawa S. Mast cell development and biostresses: different stromal responses in bone marrow and spleen after treatment of myeloablater, 5-fluorouracil, and inflammatory stressor, lipopolysaccharide. Biol. Pharm. Bull., 34, 1533–1541 (2011).
- 26) Kumagai T, Morimoto K, Saitoh T, Tsuboi I, Aikawa S, Horie T. Age-related changes in myelopoietic response to lipopolysaccharide in senescence-accelerated (SAM) mice. Mech. Ageing Dev., 112, 153–167 (2000).
- 27) Tsuboi I, Morimoto K, Hirabayashi Y, Li GX, Aizawa S, Mori KJ, Kanno J, Inoue T. Senescent B lymphopoiesis is balanced in suppressive homeostasis: a decrease in interleukin-7 and transforming growth factor-beta levels in stromal cells of senescence-accelerated mice. Exp. Biol. Med. (Maywood), 229, 494–502 (2004).
- 28) Tsuboi I, Harada T, Hirabayashi Y, Kanno J, Inoue T, Aizawa S. Age-related decline of mast cell regeneration in senescence-accelerated mice (SAMP1) after chemical myeloablation due to senescent stromal cell impairment. Exp. Biol. Med. (Maywood), 237, 1289–1297 (2012).
- 29) Tsuboi I, Harada T, Hirabayashi Y, Kanno J, Inoue T, Aizawa S. Inflammatory biomarker, neopterin, predominantly enhances myelopoiesis, which suppressed erythropoiesis via activated stromal cells. Immunobiology, 215, 348–355 (2010).
- 30) Song X, Krelin Y, Dvorkin T, Bjorkdahl O, Segal S, Dinarello CA, Voronov E, Apte RN. CD11b+/Gr-1+ immature myeloid cells mediate suppression of T cells in mice bearing tumor of IL-1β-secreating cells. J. Immunol., 175, 8200–8208 (2005).
- 31) Zhang P, Quinton LJ, Gamble L, Bagby GJ, Summer WR, Nelson S. The granulopoietic cytokine response and enhancement of granulopoiesis in mice during endotoxemia. Shock, 23, 344–352 (2005).
- 32) Cain D, Kondo M, Chen H, Kelsoe C. Effect of acute and chronic inflammation on B-cell development and differentiation. J. Invest. Dermatol., 129, 266–277 (2009).