Abstract
Bayesian estimation enables the individual pharmacokinetic parameters of the medication administrated to be estimated using only a few blood concentrations. Due to wide inter-individual variability in the pharmacokinetics of methotrexate (MTX), the concentration of MTX needs to be frequently determined during high-dose MTX therapy in order to prevent toxic adverse events. To apply the benefits of Bayesian estimation to cases treated with this therapy, we attempted to develop an estimation method using the Bayesian least-squares method, which is commonly used for therapeutic monitoring in a clinical setting. Because this method hypothesizes independency among population pharmacokinetic parameters, we focused on correlations among population pharmacokinetic parameters used to estimate individual parameters. A two-compartment model adequately described the observed concentration of MTX. The individual pharmacokinetic parameters of MTX were estimated in 57 cases using the maximum likelihood method. Among the available parameters accounting for a 2-compartment model, V1, k10, k12, and k21 were found to be the combination showing the weakest correlations, which indicated that this combination was best suited to the Bayesian least-squares method. Using this combination of population pharmacokinetic parameters, Bayesian estimation provided an accurate estimation of individual parameters. In addition, we demonstrated that the degree of correlation among population pharmacokinetic parameters used in the estimation affected the precision of the estimates. This result highlights the necessity of assessing correlations among the population pharmacokinetic parameters used in the Bayesian least-squares method.
Bayesian estimation has been used to estimate the individual pharmacokinetic profiles of some of the medications needed to perform therapeutic drug monitoring.1–5) One of the clinical benefits of this estimation method is that it allows individual pharmacokinetic parameters (individual parameters) to be estimated using only a few blood concentrations. Attempts have been made to apply this estimation method to cases receiving high-dose methotrexate (HD-MTX), which is one of the most widely used anticancer drugs. This chemotherapy has commonly been used to treat leukemia, malignant lymphoma, and osteosarcoma. Wide inter-individual variability has been reported for the pharmacokinetic profiles of MTX in cases treated with HD-MTX therapy.6) Therefore, the frequent determination of MTX concentrations is needed to safely manage individual cases receiving HD-MTX therapy.7,8) If Bayesian estimation makes it possible to predict individual parameters using only a few concentrations determined at an early stage after the administration of MTX, it is possible to predict a delay in the excretion of MTX. This estimation will provide a key for physicians to decide the duration of the rescue dosage using calcium folinate, which protects normal cells from the toxicity of MTX.
To perform Bayesian estimation, population pharmacokinetic parameters (population parameters) that fit the case are needed to estimate individual parameters. Several population parameters have already been developed for cases receiving HD-MTX, and the usefulness of these parameters has been tested.9–19) Many of these studies were performed using NONMEM, which has been used as the standard method for population pharmacokinetic analyses including Bayesian estimation. However, this software is rarely used in clinical settings because of the difficulties associated with its use.
The Bayesian least-squares method is one of the methods that allows for Bayesian estimation, and is commonly used to estimate drug concentrations in clinical settings. This estimation method is limited by approximations that hypothesize independency among the population parameters used for the estimation.3,4) Therefore, a combination of population parameters that are strongly correlated with each other may affect the individual parameters estimated using with this estimation method, and this may, in turn, also influence the clinical conditions of cases treated based on these estimates. In contrast, because it is possible to perform Bayesian estimation in consideration of correlations among the population parameters, estimations using NONMEM are free from this issue. In addition, because an increase in the parameters included in the pharmacokinetic models increases the possible correlations among the parameters, this issue should be considered especially for medications in which the pharmacokinetic profile is a 2 or higher dimensional compartment model. MTX pharmacokinetics were previously shown to be accounted for by a 2-compartment model,9–19) which suggests that this issue needs to be considered. However, to the best of our knowledge, correlations and/or covariance among population parameters have not been considered especially in the clinical use of Bayesian estimation performed using the Bayesian least-squares method.
In the present study, we aimed to develop the population parameters needed for Bayesian estimation of individual parameters in cases receiving HD-MTX therapy. To develop mathematically preferable population parameters suited for the Bayesian least-squares method, we also focused on correlations among the population parameters.
MATERIALS AND METHODS
Collection of MTX Concentration DataMTX concentrations were determined by a fluorescence polarization immunoassay. The assay was performed using the TDx analyzer (Abbott Laboratories). According to the manufacturer’s information, the lower limit of quantification of the assay was 0.02 µmol/L. Blood samples exceeding the upper limit of the calibration range (0.00–1.00 µmol/L) were diluted according to the manufacturer’s protocol. MTX concentration data were retrospectively collected from 79 cases of malignant lymphoma or osteosarcoma receiving high-dose MTX therapy at Kagawa University Hospital between January 1995 and December 2012. Two other HD-MTX therapy regimens were used for these diseases: a relatively low dose (mean value of 4822.4 mg) and short-infusion time (3 h) regimen for cases of malignant lymphoma: regimen A, or a high dose (mean value of 12373.5 mg) and long-infusion time (6 h) regimen for cases of osteosarcoma: regimen B. Cases in which MTX concentrations were determined at 5 or more time points were chosen to develop population parameters. The points of determinations were fixed as follows: 3, 6, 12, 24, 48, 72, 96, 120, 144, and 192 h after the initiation of infusion. The first point of determination was omitted in some cases treated with regimen B, and the end point was decided for each case by physicians. Cases were divided into 2 groups: index and test groups. We firstly developed population parameters using available cases, and these cases were assigned to the index group. We then assessed our estimation method using additionally obtained cases, and these cases were assigned to the test group. The characteristics of these cases are listed in Table 1.
Table 1. Characteristics of Cases Used in the Present Study
| Index group (n=62) | Test group (n=17) |
|---|
| Age (years) | 42.0±24.0 (8–74) | 45.8±26.4 (10–80) |
| Height (cm) | 162.0±9.5 (128.0–183.0) | 156.7±10.8 (141.2–172.0) |
| Weight (kg) | 55.5±12.2 (25.3–90.0) | 50.4±15.6 (30.7–79.1) |
| Dose (mg) | 8937±4513 (3500–18000) | 8903±5260 (3500–21000) |
| SCr (mg/dL) | 0.63±0.24 (0.3–1.85) | 0.55±0.17 (0.33–0.88) |
The index group includes cases treated with regimens A (n=25) and B (n=37). The test group includes cases treated with regimens A (n=10) and B (n=7). Values are shown as the mean±S.D. (range). SCr, serum creatinine; S.D., standard deviation.
The present study was approved by the Ethics Committee of Kagawa University Faculty of Medicine.
Population Pharmacokinetic AnalysisPopulation parameters were developed by the standard 2-stage method described as follows. A two-compartment model adequately described the observed concentration of MTX used in the present study. Individual parameters were obtained using the maximum likelihood method, which hypothesizes log-normal distribution. Seven general pharmacokinetic parameters accounting for a 2-compartment model were estimated using this method: the volume of the central and peripheral compartment normalized by body weight (V1 and V2), the rate constant of elimination from the central compartment (k10), the rate constants of exchange between the central and peripheral compartments (k12 and k21), and total plasma and inter-compartmental clearance (CL and Q). The mean and coefficient of variation of these parameters were calculated as population parameters and inter-individual variations in the parameters, respectively.
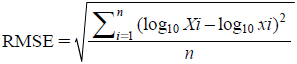
Individual Parameter EstimationMTX concentrations were estimated with the Bayesian least-squares method reported by Higuchi et al.4) The predictive performance of this method was validated using data included in the test group, which was not included in the data used to develop the population parameters. To assess predictive performance, the root mean squared error (RMSE) was calculated by the equation as follows.
where n is the total number of determinations per dose, i is the rank order of determinations, X is the observed concentration of the i-th determination, and x is the predicted concentration at the same time point as the i-th determination calculated using the individual parameters estimated.
Evaluation of the Effect of the Correlations among Population ParametersUniform random numbers generated by a physical random number generator were obtained from the random numbers library of the Institute of Statistical Mathematics.20) These random numbers were transformed to normal random numbers using Box–Muller transformation. Log-normally distributed individual parameters conforming to the mean parameter values, inter-individual variations, and the correlations among population parameters developed in the present study were generated using these normal random numbers (artificial parameters). Because these artificial parameters included uncommonly large or small values due to the generation method, which hypothesizes log-normal distribution, these atypical parameters, which were over 10-fold larger or smaller than the mean parameter values, were removed, and sets of parameters representing artificial cases were prepared. The MTX concentrations of arbitrary time points were calculated for the assigned body weight, dose, and intra-individual variation using these sets of artificial parameters, and Bayesian estimations were performed using an arbitrary combination of the population parameters and calculated concentrations. The effect of the correlations among the combination of the population parameters was evaluated using the absolute values of the relative errors of estimates and the artificial parameters.
Calculation and Statistical AnalysesCalculations were performed using an in-house Fortran program. Statistical analyses were performed using R (version 2.14.1, The R Foundation for Statistical Computing).
RESULTS
Individual Pharmacokinetic Parameter CalculationsThe characteristics of the cases treated in the present study are presented in Table 1. A total of 462 concentrations were available from the index and test groups (Fig. 1).
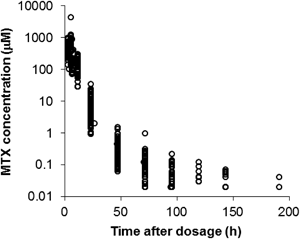
Fig. 1. Methotrexate Concentrations from 79 Cases
Based on previous studies and changes in the observed concentrations shown in Fig. 1, a 2-compartment model was chosen to develop the pharmacokinetic parameters for MTX. Individual parameters were obtained for cases in the index group using the maximum likelihood method, which hypothesizes log-normal distribution. Cases including outlier parameters examined by Smirnov–Grubbs’ outlier test (α=0.01) were excluded. Therefore, a total of 57 cases were available for the development of population parameters. Cases in the index group included those with malignant lymphoma and osteosarcoma (n=23, 34, respectively). Two other HD-MTX therapy regimens were used for these diseases: a relatively low dose and short-infusion time regimen for cases of malignant lymphoma: regimen A, or a high dose and long-infusion time regimen for cases of osteosarcoma: regimen B. A significant difference was observed in k10 (p<0.05), CL (p<0.05), and Q (p<0.01) between the cases given 2 other HD-MTX regimens. Therefore, we developed 2 population parameters to account for cases in the 2 other HD-MTX therapy regimens, respectively.
Correlation among the Calculated Individual ParametersCorrelation coefficients between the calculated individual parameters were calculated and shown as correlation matrixes in Tables 2 and 3. A 2-compartment model was accounted for by 4 parameters selected from the 7 parameters calculated and shown (V1, V2, k10, k12, k21, CL, and Q). With the exception of the combination of the parameters with a relationship equation, 21 combinations were available. To select combinations with the weakest correlations among the parameters, combinations with 0.5 or above absolute values of the correlation coefficients among the parameters shown in Tables 2 and 3 were excluded.
Table 2. Correlations among Each Parameter in Regimen A
| V1 | V2 | k10 | k12 | k21 | CL | Q |
|---|
| V1 | — | −0.05 | −0.42 | −0.18 | 0.36 | 0.88** | −0.01 |
| V2 | — | — | 0.20 | 0.53** | −0.70** | 0.05 | 0.39 |
| k10 | — | — | — | 0.45 | −0.27 | 0.04 | 0.40 |
| k12 | — | — | — | — | −0.14 | 0.03 | 0.82** |
| k21 | — | — | — | — | — | 0.22 | −0.11 |
| CL | — | — | — | — | — | — | 0.21 |
| Q | — | — | — | — | — | — | — |
Table 3. Correlations among Each Parameter in Regimen B
| V1 | V2 | k10 | k12 | k21 | CL | Q |
|---|
| V1 | — | 0.41 | 0.04 | 0.06 | −0.04 | 0.88** | 0.43 |
| V2 | — | — | 0.13 | 0.46** | −0.43** | 0.44** | 0.60** |
| k10 | — | — | — | 0.25 | 0.23 | 0.51** | 0.30 |
| k12 | — | — | — | — | 0.43 | 0.20 | 0.89** |
| k21 | — | — | — | — | — | 0.05 | 0.37** |
| CL | — | — | — | — | — | — | 0.53** |
| Q | — | — | — | — | — | — | — |
Two combinations were identified: “V1, k10, k12, and k21” and “V1, Q, k12, and k21.” The sum of the absolute value of correlation coefficients among the parameters selected in these 2 combinations were similar in Table 2 (1.82, 1.62, respectively), but were markedly different in Table 3 (1.05, 2.22, respectively). Therefore, we selected V1, k10, k12, and k21 as the combination of population parameters for regimens A and B, and the mean and coefficient of variation (CV, used as the inter-individual variation) of these parameters are shown in Table 4.
Table 4. Population Pharmacokinetic Parameters for the 2 HD-MTX Therapies Examined
| | V1 | k10* | k12 | k21 |
|---|
| Regimen A | Mean | 0.379 | 0.214 | 0.001 | 0.036 |
| CV | 0.230 | 0.106 | 0.506 | 0.445 |
| Regimen B | Mean | 0.366 | 0.265 | 0.002 | 0.040 |
| CV | 0.260 | 0.133 | 0.591 | 0.450 |
* p<0.05. CV, coefficient of variation.
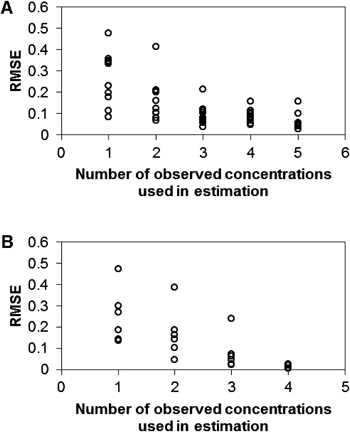
Bayesian estimation using the developed parameters was performed on cases in the test group to evaluate the precision of estimations using the population parameters developed in the present study. This group included 17 cases (n=10 and 7, for regimens A and B, respectively). Blood concentrations of MTX were determined at 5 time points (3, 6, 24, 48, 72 h after the initiation of infusion) for regimen A, and 4 time points (6, 24, 48, 72 h) for regimen B. We then performed Bayesian estimation using 1 to 5 (regimen A), or 1 to 4 (regimen B) observed concentrations. These concentrations were used in the rank order of the time of determination. Using each estimated individual parameter, the predicted concentrations of MTX were calculated at the same 5 time points as the time of determination for regimen A, or 4 time points for regimen B. RMSEs were calculated for each run of estimation by using the MTX concentrations (Fig. 2). Figure 2 shows that RMSEs decreased with an increase in the number of observed concentrations used in the estimation. RMSEs decreased to approximately 0.1 when 2 or more observed concentrations in the rank order of the time of determination were used. This result indicates that Bayesian estimation using only 2 observed concentrations can estimate individual parameters with sufficient precision.
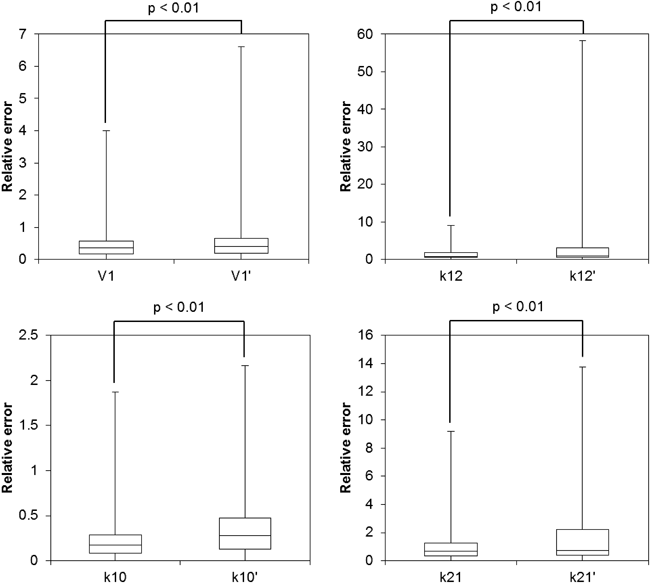
To evaluate the effect of correlations among the population parameters used for Bayesian estimation, we compared the precision of the estimation using 2 other combinations of population parameters: “V1, k10, k12, and k21” and “V1, V2, CL, and Q.” The former was the combination that had the weakest correlations in the present study, and the latter was the most frequently reported combination in previous studies.9–19) As shown above, the sum of the absolute value of correlation coefficients among V1, k10, k12, and k21 was 1.05 for regimen B, whereas V1, V2, CL, and Q was 3.29 for regimen B. Because of the relatively strong correlations among V1, V2, CL, and Q, this combination of the population parameters was considered to be a good target for a comparison with V1, k10, k12, and k21. Therefore, we prepared artificial cases whose body weights were 50 kg, dose of MTX was 10000 mg, intra-individual variation was 15%, and individual parameters (V1, k10, k12, and k21) were randomly generated according to the population pharmacokinetic profile for regimen B to evaluate the effect of correlations among population parameters on Bayesian estimates. Theoretical concentrations 6 and 12 h after the initiation of infusion were then calculated using these artificial parameters. Bayesian estimation was then performed using these calculated concentrations and 2 other combinations of population parameters, and individual parameters were estimated for 10000 artificial cases. Individual parameters estimated using V1, V2, CL, and Q as the population parameters were transformed to V1, k10, k12, and k21. To evaluate the precision of estimation using V1, V2, CL, and Q, these individual parameters were compared with artificial parameters that represented the “true” parameters of these artificial cases based on a calculation of the absolute values of relative errors. Relative errors were also calculated with the individual parameters estimated using V1, k10, k12, and k21. These results were compared using box and whisker plots (Fig. 3). The median of relative errors calculated from estimates using V1, V2, CL, and Q were at most 10% larger than those of V1, k10, k12, and k21, and significant differences were observed in all parameters (p<0.01). This result that relatively strongly correlated population parameters may have decreased the precision of Bayesian estimation using the Bayesian least-squares method.
DISCUSSION
We developed the population parameters of MTX for cases treated with high-dose therapy in the present study, and by considering correlations among population parameters, the most appropriate combination of the population parameters was found for the Bayesian estimation using the Bayesian least-squares method.
The Bayesian least-squares method has been developed with approximations that hypothesize independency among the population parameters used for the estimation.3,4) This limitation may affect estimations from this method. Therefore, to identify the most appropriate combination of population parameters for estimations using this method, we compared correlations among the possible parameters. To achieve this, we calculated all parameters accounting for the 2-compartment model (V1, V2, k10, k12, k21, CL, and Q) for cases in the index group. Significant differences were observed in 3 of the parameters developed (k10, CL, and Q) for either of the 2 regimens. The dose dependency of the elimination half-life of MTX metabolites has been reported previoulsy.21) In addition, the infusion time of MTX was shown to affect the elimination half-life of the β phase.22) The findings of these previous studies suggest that differences in the parameters developed in the present study were caused by differences in the MTX dose and/or infusion time for each regimen.
The correlation matrix of the calculated individual parameters revealed strong correlations between some pairs of parameters (Tables 2, 3). V1 and CL had the strongest correlation in both parameters for the 2 other regimens. This pair of parameters had been included in most of the previously reported population parameters.9,11–19) This result indicates that the reported population parameters may be inappropriate for the Bayesian least-squares method used in the present study. Thus, we compared correlations among the possible combinations of population parameters. As a result, we selected V1, k10, k12, and k21 as the population parameter combination with the weakest correlations. Bayesian estimation using this combination of population parameters can estimate individual parameters with satisfactory precision for cases in the test group. This result suggests that the population parameters developed in the present study were valid for estimating the individual parameters of cases treated with HD-MTX therapy. However, the present population parameters have their limitations. MTX pharmacokinetics would be affected by renal failure, because MTX is mainly eliminated via renal excretion, but the cases treated in the present study had no abnormal findings on renal function (Table 1). Therefore, the present population parameters may not give enough information to estimate MTX disposition for cases with renal failure.
Theoretically, the combination of population parameters selected in the present study was considered to be more suited than others for the Bayesian least-squares method; however, the actual effects of the correlations among the population parameters used in the estimation on estimates were not clear. To clarify this, the precision of the estimation was evaluated using 2 other combinations of parameters with different correlations and randomly generated artificial cases. Figure 3 shows that the median values of the errors of the estimates using relatively strongly correlated population parameters (V1, V2, CL, and Q: the sum of the absolute value of correlation coefficients was 3.29) were larger than those of weakly correlated parameters (V1, k10, k12, and k21: 1.04). The result of this numerical experiment revealed that the correlations among the population parameters affected the precision of the individual parameter estimation using the Bayesian least-squares method. This finding highlighted the necessity of assessing correlations among the population parameters used in the Bayesian least-squares method, and also suggests the necessity of the addition of information regarding correlations among population parameters when researchers intend to report newly developed population parameters. To generalize the present results, further studies are needed to clarify the effect of correlations among population parameters on the precision of estimations by the Bayesian least-squares method.
REFERENCES
- 1) Sheiner LB, Rosenberg B, Melmon KL. Modelling of individual pharmacokinetics for computer-aided drug dosage. Comput. Biomed. Res., 5, 441–459 (1972).
- 2) Sheiner LB, Beal S, Rosenberg B, Marathe VV. Forecasting individual pharmacokinetics. Clin. Pharmacol. Ther., 26, 294–305 (1979).
- 3) Yamaoka K, Nakagawa T, Tanaka H, Yasuhara M, Okumura K, Hori R. A nonlinear multiple regression program, MULTI2 (BAYES), based on Bayesian algorithm for microcomputers. J. Pharmacobiodyn., 8, 246–256 (1985).
- 4) Higuchi S, Aoyama T, Horioka M. PEDA: a microcomputer program for parameter estimation and dosage adjustment in clinical practice. J. Pharmacobiodyn., 10, 703–718 (1987).
- 5) Thomson AH, Whiting B. Bayesian parameter estimation and population pharmacokinetics. Clin. Pharmacokinet., 22, 447–467 (1992).
- 6) Masson E, Relling MV, Synold TW, Liu Q, Schuetz JD, Sandlund JT, Pui CH, Evans WE. Accumulation of methotrexate polyglutamates in lymphoblasts is a determinant of antileukemic effects in vivo. A rationale for high-dose methotrexate. J. Clin. Invest., 97, 73–80 (1996).
- 7) Evans WE, Crom WR, Abromowitch M, Dodge R, Look AT, Bowman WP, George SL, Pui CH. Clinical pharmacodynamics of high-dose methotrexate in acute lymphocytic leukemia. Identification of a relation between concentration and effect. N. Engl. J. Med., 314, 471–477 (1986).
- 8) Galpin AJ, Evans WE. Therapeutic drug monitoring in cancer management. Clin. Chem., 39, 2419–2430 (1993).
- 9) Odoul F, Le Guellec C, Lamagnère JP, Breilh D, Saux MC, Paintaud G, Autret-Leca E. Prediction of methotrexate elimination after high dose infusion in children with acute lymphoblastic leukaemia using a population pharmacokinetic approach. Fundam. Clin. Pharmacol., 13, 595–604 (1999).
- 10) Rousseau A, Sabot C, Delepine N, Delepine G, Debord J, Lachâtre G, Marquet P. Bayesian estimation of methotrexate pharmacokinetic parameters and area under the curve in children and young adults with localised osteosarcoma. Clin. Pharmacokinet., 41, 1095–1104 (2002).
- 11) Fukuhara K, Ikawa K, Morikawa N, Kumagai K. Population pharmacokinetics of high-dose methotrexate in Japanese adult patients with malignancies: a concurrent analysis of the serum and urine concentration data. J. Clin. Pharm. Ther., 33, 677–684 (2008).
- 12) Colom H, Farré R, Soy D, Peraire C, Cendros JM, Pardo N, Torrent M, Domenech J, Mangues MA. Population pharmacokinetics of high-dose methotrexate after intravenous administration in pediatric patients with osteosarcoma. Ther. Drug Monit., 31, 76–85 (2009).
- 13) Min Y, Qiang F, Peng L, Zhu Z. High dose methotrexate population pharmacokinetics and Bayesian estimation in patients with lymphoid malignancy. Biopharm. Drug Dispos., 30, 437–447 (2009).
- 14) Buitenkamp TD, Mathôt RA, de Haas V, Pieters R, Zwaan CM. Methotrexate-induced side effects are not due to differences in pharmacokinetics in children with Down syndrome and acute lymphoblastic leukemia. Haematologica, 95, 1106–1113 (2010).
- 15) Nagulu M, Kiran VU, Nalini Y, Reddy YN, Krishna DR. Population pharmacokinetics of methotrexate in Indian cancer patients. Asian Pac. J. Cancer Prev., 11, 403–407 (2010).
- 16) Zhang C, Zhai S, Yang L, Wu H, Zhang J, Ke X. Population pharmacokinetic study of methotrexate in children with acute lymphoblastic leukemia. Int. J. Clin. Pharmacol. Ther., 48, 11–21 (2010).
- 17) Dombrowsky E, Jayaraman B, Narayan M, Barrett JS. Evaluating performance of a decision support system to improve methotrexate pharmacotherapy in children and young adults with cancer. Ther. Drug Monit., 33, 99–107 (2011).
- 18) Johansson ÅM, Hill N, Perisoglou M, Whelan J, Karlsson MO, Standing JF. A population pharmacokinetic/pharmacodynamic model of methotrexate and mucositis scores in osteosarcoma. Ther. Drug Monit., 33, 711–718 (2011).
- 19) Jönsson P, Skärby T, Heldrup J, Schrøder H, Höglund P. High dose methotrexate treatment in children with acute lymphoblastic leukaemia may be optimised by a weight-based dose calculation. Pediatr. Blood Cancer, 57, 41–46 (2011).
- 20) The Institute of Statistical Mathematics. “Random numbers library.”: ‹http://random.ism.ac.jp/index.html›, cited 5 October, 2013.
- 21) Borsi JD, Sagen E, Romslo I, Moe PJ. Comparative study on the pharmacokinetics of 7-hydroxy-methotrexate after administration of methotrexate in the dose range of 0.5–33.6 g/m2 to children with acute lymphoblastic leukemia. Med. Pediatr. Oncol., 18, 217–224 (1990).
- 22) Borsi JD, Schuler D, Moe PJ. Methotrexate administered by 6-h and 24-h infusion: a pharmacokinetic comparison. Cancer Chemother. Pharmacol., 22, 33–35 (1988).