Abstract
Wild or cultivated Glycyrrhiza uralensis FISCHER (G. uralensis) are the main source of licorice, and they contain the similar compounds, such as the triterpenoid saponins and flavonoids, but above two kinds of the components contents are low level in the cultivated licorice. To produce the high quality cultivated licorices, researchers studied the affecting factors about the compounds producing in the plant of licorice, and then found that the growth years, genetic differences and water deficit are all the important factors. In this paper, we found that there were different distribution patterns of the main five active components (FAC) including glycyrrhizin, liquiritin, isoliquiritin, liquiritigenin and isoliquiritigenin in the taproot and stolon of G. uralensis and maybe they are also important influence factors to the FAC contents of the licorices. In wild G. uralensis, the contents of FAC tended to be lower in the younger parts of the stolon, and in the cultivated G. uralensis taproot, the contents of glycyrrhizin, liquiritin and isoliquiritin tended to increase from top to end, contrary to the contents of liquiritigenin and isoliquiritigenin, which increased first and then decreased. Our results will contribute to the analyses of factors which influence the quality of licorice, and provide some reference for cultivating high quality licorices for herbal medicine.
Licorice, is one of the most generally used herbal medicine in the world, consisting of the roots, rhizomes, and stolons of Glycyrrhiza uralensis FISCHER or G. glabra LINNÉ or G. inflata BAT. (Fam. Leguminosae).1) It has been proved to possess various bioactivities, such as anti-inflammatory, liver protection, anti-bacterial, and anti-cancer,2,3) which are attributed to the contained triterpenoid saponins and flavonoids. Among them, glycyrrhizin (I), liquiritin (II), isoliquiritin (III), liquiritigenin (IV), and isoliquiritigenin (V) (Fig. 1) are believed to be responsible for the bioactivities,4) such as antidepressant,5) liver protection,2,6) vasorelaxant effect,7) and anti-tube formation.8)

Fig. 1. Structure of Glycyrrhizin (I), Liquiritin (II), Isoliquiritin (III), Liquiritigenin (IV), and Isoliquiritigenin (V)
Wild and cultivated G. uralensis are the main sources of licorice for medicine, and the majority is from wild resources. However, because of a longstanding over-harvesting and environmental degradation in China, the wild G. uralensis resources have decreased drastically. Nowadays, the cultivated G. uralensis are increasingly becoming the alternative sources of wild G. uralensis.9) Therefore, how to produce the high quality cultivated G. uralensis is an urgent issue for the research and production fields.
It’s well known that the producing and distributing of the active components in G. uralensis are affected by many factors, such as growth years,10) genetic differences,11) and water deficit,12) even the difference occurs in all parts of the same plant, whose secondary metabolites are not uniformly distributed. Yamamoto and Tani10) reported that compound I content in cultivated Glycyrrhiza lateral root was higher than that in the taproot. The thick stolon is the important part of wild G. uralensis as well as the important medicinal resources, and it can be long up to several meters after years of growth. Hayashi et al.13) investigated the compound I content in 9 different segments of a growing stolon of G. glabra (180 cm length), and found that it tended to be higher in the older segments of the stolon. And Shibano et al.14) also discovered that the contents of I and total flavonoids increased greatly near the growth point of roots and stolons of cultivated licorice. Whereas the distribution patterns of bioactive components in G. uralensis are very important characters, but they haven’t been studied in depth.
Cultivated licorice herbs mainly come from taproots, whose stolons are usually too thin and short to be used as medicinal, but as propagating materials. In view of the above-mentioned facts, in this study, the wild stolons (200 cm length) and cultivated taproots (60 cm length, 2 years old) were collected and the distribution patterns of the contents and the amounts of five active components (FAC) in different segments of wild stolon and cultivated taproot were investigated, respectively. Of which the amounts were obtained from multiplying the contents by the dry weight of the segments. Hopefully, the present data could contribute to the analyses of factors that influence the quality of licorice, and provide some reference for cultivating high quality licorices for herbal medicine.
MATERIALS AND METHODS
MaterialsWild G. uralensis was collected from Hangjinqi in Inner Mongolia and cultivated G. uralensis was collected from northeastern Heilongjiang Province, Qiqihar city, a two-year, identified as Glycyrrhiza uralensis FISCH. by professor Shengli Wei who works at Beijing University of traditional Chinese medicine.
Three wild G. uralensis stolons were cut into consecutive segments at 20 cm intervals with the origin at the head of the taproot, a total of 28 samples (Fig. 2). The 9 strong cultivated taproots were collected, divided into three groups as three time repeated according to a set of three. Then the taproots were cut into consecutive segments at 5 cm intervals from the head, a total of 32 samples (Fig. 3). All the samples were dried (50°C) for 3 d and grounded to a fine powder (<150 µm).

Fig. 2. The 3 Stolons (S1, S2, and S3) of Wild G. uralensis Were Cut into Several Continuous Segments at 20 cm Intervals
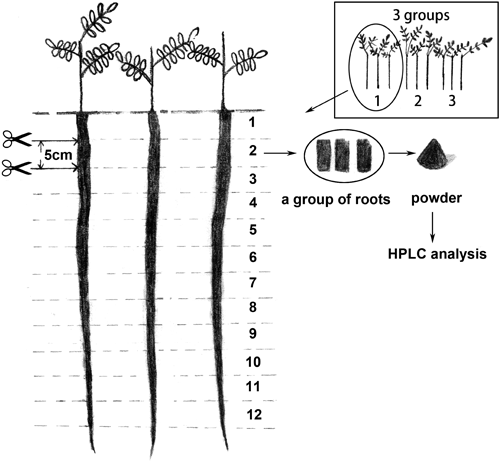
Fig. 3. The 9 Taproots (60 cm Long, 2 Years) of Cultivated G. uralensis Were Divided into 3 Groups, and Each Group of the Taproots Were Cutted into Consecutive Segments at 5 cm Intervals from the Head, and Then Grounded to a Fine Powder to Be Used for FAC Analyses
All specimens are deposited in the Chinese Medicine Resources Laboratory, Beijing University of Chinese Medicine College of Traditional Chinese Medicine (NM-HJQ-BYWS-1–10).
HPLC AnalysisQuantitative analysis by HPLC of the contents of FAC of G. uralensis was performed according to the procedure as follows. Dried samples (100 mg) were extracted with 70% EtOH (40 mL) for 30 min under ultrasonication (250 W, 40°C). And then the solution was cooled to room temperature, adjusted with 70% EtOH to original volume, mixed and passed through a membrane filter having 0.45 µm porosity. A volume of 10 µL was used for HPLC analysis. Analyses were performed on a Waters Series liquid chromatograph (Waters Technologies, MS, U.S.A.), consisting of Warters-1525 pumps, a 2707 autoinjector connected to a Warters-2489 UV detector. Samples were separated on a DIKMA Diamonsil™-C18 column (5 µm, 250 mm ×4.6 mm). Column temperature was 30°C. The mobile phase consisted of HPLC-grade CH3CN (A) and water containing 0.05% H3PO4 (B). A gradient profile was used as follows: 0 min, 20% A; 8 min, 20% A; 30 min, 38% A; 42 min, 50% A; and 45 min, 95% A. The flow rate was 1.0 mL/min. I, II, and IV were monitored by measuring absorbance at 237 nm, and III and V were detected at 365 nm.
The standard of compound I was from China Pharmaceutical Biological Products Analysis Institute. II, III, IV, and V standards were from Shanghai Winherb Medical Technology Co., Ltd., with a purity of greater than 98% (Fig. 4).
Calibration Curves and Limit of Quantification (LOQ)The calibration curves of FAC were carried out using an external standard. The stock solutions of the FAC were prepared by dissolving accurately weighted portions of the standards in 70% EtOH. The concentration of each compound is 0.336 mg/mL (I), 0.0832 mg/mL (II), 0.02324 mg/mL (III), 0.0104 mg/mL (IV), and 0.00324 mg/mL (V). Then the standard solution was further diluted into a series of different concentration solutions. A volume of 10 µL was analyzed respectively to form the regression equation. And the LOQ under the present chromatographic condition was determined at a signal-to-noise (S/N) ratio of 10. The results were shown in Table 1.
Table 1. The Calibration Curves of FAC and LOQ
| Active components | The linear range (µg) | Regression equations | Correlation coefficient (R2) | Limit of quantitation (LOQ/ng) |
|---|
| I | 0.224–3.36 | y=7×10⁵x−3847 | 0.9995 | 2.87 |
| II | 0.069–0.832 | y=4×10⁶x−43123 | 0.9998 | 1.26 |
| III | 1.63×10⁻²–0.2324 | y=4×10⁶x−5342 | 0.9999 | 8.73 |
| IV | 8.46×10⁻³–0.104 | y=3×10⁶x−4332 | 0.9997 | 1.57 |
| V | 2.135×10⁻³–3.24×10⁻² | y=6×10⁶x−4022 | 0.9998 | 0.25 |
Statistical treatments (one-way ANOVA, correlation) were performed using SPSS software (Chicago), calculated using considered significant at p<0.05.
RESULTS
Distribution Patterns of the Contents of FAC among Different Segments in G. uralensis.Wild StolonThe segments of wild stolons (S1, S2, S3) were analyzed in triplicate. The contents of FAC among different segments were given in Table 2 and the content and amount variations of FAC among different segments were shown in Fig. 5.
Table 2. Contents of FAC in the Segments of Wild G.
uralensis Stolons
| Components | Stolons | FAC contents of the segments (%) |
|---|
| 1 | 2 | 3 | 4 | 5 | 6 | 7 | 8 | 9 | 10 |
|---|
| S1 | 2.6998 | 3.1069 | 3.0389 | 3.1221 | 3.5082 | 3.9166 | 3.4791 | 3.9865 | 3.8729 | |
| I | S2 | 3.9179 | 4.1216 | 4.5686 | 4.7359 | 5.2454 | 5.1874 | 5.8041 | 4.7286 | 3.3534 | 3.3651 |
| S3 | 3.9316 | 4.0809 | 4.0529 | 4.3029 | 4.2717 | 4.1161 | 4.5949 | 4.4435 | 4.4819 | |
| S1 | 0.1773 | 0.2197 | 0.2252 | 0.1906 | 0.2245 | 0.2811 | 0.2464 | 0.3224 | 0.2826 | |
| II | S2 | 0.3556 | 0.3689 | 0.3998 | 0.4003 | 0.4791 | 0.4757 | 0.4982 | 0.3789 | 0.2204 | 0.2285 |
| S3 | 0.3118 | 0.3881 | 0.3804 | 0.3729 | 0.3309 | 0.3252 | 0.3790 | 0.3840 | 0.3774 | |
| S1 | 0.2502 | 0.3112 | 0.2976 | 0.2912 | 0.2980 | 0.3356 | 0.3046 | 0.3379 | 0.3137 | |
| III | S2 | 0.2925 | 0.2603 | 0.3361 | 0.3317 | 0.3653 | 0.3697 | 0.3965 | 0.3529 | 0.1995 | 0.2094 |
| S3 | 0.2454 | 0.2897 | 0.2865 | 0.3257 | 0.2967 | 0.2648 | 0.2548 | 0.3134 | 0.3083 | |
| S1 | 0.1758 | 0.1874 | 0.1807 | 0.1819 | 0.2678 | 0.2362 | 0.1819 | 0.2263 | 0.2055 | |
| IV | S2 | 0.1791 | 0.1836 | 0.1469 | 0.2171 | 0.2115 | 0.2198 | 0.2692 | 0.2519 | 0.1225 | 0.0768 |
| S3 | 0.2280 | 0.1819 | 0.1760 | 0.1587 | 0.2963 | 0.2302 | 0.2047 | 0.1373 | 0.1358 | |
| S1 | 0.0250 | 0.0242 | 0.0248 | 0.0303 | 0.0379 | 0.0372 | 0.0345 | 0.0362 | 0.0302 | |
| V | S2 | 0.0304 | 0.0256 | 0.0369 | 0.0377 | 0.0351 | 0.0319 | 0.0379 | 0.0427 | 0.0293 | 0.0294 |
| S3 | 0.0377 | 0.0343 | 0.0294 | 0.0449 | 0.0473 | 0.0288 | 0.0289 | 0.0273 | 0.0274 | |
Notes: FAC is the abbreviated name about five active components including glycyrrhizin (I), liquiritin (II), Isoliquiritin (III), liquiritigenin (IV), and isoliquiritigenin (V).

As indicated in Fig. 5, throughout the whole stolons, the contents of FAC all showed first increased and then decreased trends from segments 1 to 10. Compounds I and II were highest at segment 7 and III at segment 8. Overall, they were all highest at around 3/5 of the stolon from the taproot to the stolon end (segment 10), while the highest contents of IV and V at 1/2 of the stolon (segment 5), and the lowest near the stolon end. This result was in accordance with previously findings of Hayashi et al.13) Moreover, there are significant differences in the contents of FAC among different segments of the wild stolon. The I and II highest contents (4.626±1.163%, 0.375±0.126%) are 1.37-fold and 1.64-fold higher than the lowest one (3.365%, 0.228%), respectively. Interestingly, the average contents of compounds I, II, III, IV, and V, respectively of 3.903±0.725%, 0.322±0.092%, 0.298±0.034%, 0.199±0.040%, and 0.034±0.007% from segments 1 to 5 were close to the average contents of the whole wild stolon (4.067±0.734%, 0.329±0.089%, 0.301±0.046%, 0.196±0.048%, 0.033±0.006%). And I content is at least 3.0%, meeting the requirements of Chinese Pharmacopoeia (2.0% or more).
The amounts of FAC among different segments were showing a trend of declining-rising-declining from segments 1 to 10. Outside III amount, they were all highest in the same places with the highest contents of FAC. And III amount was highest at segment 9. But compared with the above contents, the amounts of FAC were lowest at the 1/5 of the whole stolon (segment 2) from the taproot. It could be explained by diameter thinning at that place.
Cultivated TaprootAs was seen in Fig. 3, with the taproot lengthening, its diameter decreased, and the contents of FAC showed different variations among the segments of cultivated G. uralensis taproots (Fig. 6)
Compound I content increased gradually on a whole, varying from 1.659±0.110% to 2.139%, with an average of 1.976±0.156%. Among the 12 segments, I content in segments 1 and 2 couldn’t reach the licorice standard of Chinese pharmacopoeia (2.0% or more), but the contents at segments 3 to 12 exceeded the above criteria. These results were in accordance with previously findings of Yamamoto and Tani.10) And the average I content was 2.069±0.101% in segments 4 to 6, close to the overall average value (1.976±0.156%). In addition, compound I amount was gradually decreased among consecutive segments from segments 1 to 12.
Compound II content showed similar trends with that of I, ranging from 0.232±0.026% to 0.524±0.054%, showing a wide variation among different segments. And the average II content was 0.409±0.038% in segments 4 to 6, close to the overall average value (0.407±0.101%). While among the 12 segments, in addition to II content at the segment 10, other couldn’t reach the licorice standard of Chinese pharmacopoeia (0.5% or more). On the other hand, compound II amount did not change obviously.
Compound III content also increased gradually, ranging from 0.143±0.034% to 0.253±0.039%, the average content of 0.218±0.039%. The III content in segments 1 to 3 were lower than the average value, while it was higher in segments 4 to 12. And the average III content was 0.219±0.03% in segments 3 to 5, close to the overall average value. Similar to I amount, III amount decreased gradually.
Compounds IV and V contents changed similarly as the amounts of them, both increasing first and then decreasing. The average IV and V contents (0.0572±0.004%, 0.0385±0.003%) in segments 6 to 9 were close to the overall average value (0.066±0.028%, 0.044±0.012%), respectively.
Above results should prove valuable for studies on the distribution of active components in the different parts of cultivated G. uralensis.
Relationships between the Contents of FAC in G. uralensisTable 3 provides the correlations between the contents of FAC. The compound I content was positively correlated with that of II both in wild and cultivated G. uralensis, consistent with the result of Kojoma et al.11) And similar results were also present between I and III, II and III, IV and V. In wild stolon, however, there were also positive correlations between II and IV, III and IV, II and V, III and V, contrary to those of cultivated taproots. The specific reasons need to be further studied.
Table 3. Relationships between the Contents of FAC of the Wild and Cultivated G.
uralensis| W.G | C.G |
|---|
| I | II | III | IV | V |
|---|
| I | | 0.464** | 0.666** | 0.002 | 0.062 |
| II | 0.955** | | 0.865** | −0.574** | −0.596** |
| III | 0.665** | 0.619** | | −0.312 | −0.325 |
| IV | 0.334 | 0.224 | 0.471* | | 0.891** |
| V | 0.442* | 0.331 | 0.432* | 0.532** | |
W.G, wild G. uralensis; C.G, cultivated G. uralensis. * Correlation is significant at the 0.05 level (2-tailed). ** Correlation is significant at the 0.01 level (2-tailed).
DISCUSSION
The Standard and Quality of LicoriceIn China, licorice is usually ranked according to its taproot diameter, the thicker the better. In this study, however, we observed different distribution patterns of the contents of FAC among the taproot and stolon of cultivated G. uralensis with different diameters. The contents of IV and V are higher in the large diameter position, while the I, II, and III contents are higher in the small one. These results suggest that the quality of licorice, when employed as materials for cosmetic, sweetener, food additiveand confectionery food, cannot be judged only by its taproot diameter, but depend on the specifically actual demand. Furthermore, our present observations that compound I content was higher in thinner licorice provide some potential guidance for the rational utilization of the licorice resource, as people usually use the thicker position as medicine, and consider the thinner position for other uses, resulting in a waste of resources.
The Fitting Sampling Part during Licorice Quality Evaluation ProcessIn the quality evaluation of licorices from different places, collection of samples in different producing areas is usually necessary. However, it is not easy for licorice sampling to ensure the integrity of the medicinal materials, which will inevitably result in the inaccurate analysis data. Therefore, it is necessary to establish a effective sampling method, by which we can take less samples and get more accurate results. From our results, we successfully found the distribution patterns of the contents of FAC both in the whole wild stolon and cultivated taproot, and some parts in which the average content of FAC respectively was close to its overall average value. This study can help to choose the fitting sampling part according to the desired active component, and to provide some practical guidance.
Reasons for Differences in the Distribution of the Contents of FAC in LicoriceWe found that the contents of FAC tended to be lower in the younger parts of the wild G. uralensis stolon, and the contents of I, II, and III tended to increase from top to end of the cultivated taproot. These phenomenons are probably ascribe to the internal and external reasons. In terms of the external one, the factors including water, heat, soil strength, nutrient status, and even oxygen in soil are the major causes of active component difference in G. uralensis.15) Take oxygen for example, hypoxia is a common occurrence in metabolically active root tissues,16) and licorice root apical zones, with rapid rates of O2 consumption and few intercellular spaces to conduct O2 by gaseous diffusion, are liable to hypoxia. Studies have shown that plants protect themselves, such as to address the ecological pressures, by producing secondary metabolites.17) As I has been confirmed to be one of the products by which licorice produces against adversity,10–12) so, the above external causes stress may be the force inducing licorice to biosynthesize the secondary metabolites, such as I, to help itself to survive. As for the internal causes, plants themselves can mobilize their defense mechanisms, and regulate actively the strength of the synthesis of secondary metabolites to improve the accumulation of defensive secondary metabolites in face of environmental stress. Therefore, the results of this study also need to be further explored from a functional gene level.
Acknowledgment
This work was supported by the Beijing Natural Science Foundation of China (7122094).
REFERENCES
- 1) China Pharmacopoeia Committee. Pharmacopoeia of People’s Republic of China, Vol. 1, Chemical Industry Press, Beijing, pp. 22–23 (2010).
- 2) Asl MN, Hosseinzadeh H. Review of pharmacological effects of Glycyrrhiza sp. and its bioactive compounds. Phytother. Res., 22, 709–724 (2008).
- 3) Tian Q, Guan Y, Zhang B, Liu H. Research advances on pharmacological activities of components in licorice. Natural Product R & D, 18, 343–347 (2006).
- 4) Zhang Q, Ye M. Chemical analysis of the Chinese herbal medicine Gan-Cao (licorice). J. Chromatogr. A, 1216, 1954–1969 (2009).
- 5) Zhao Z, Wang W, Guo H, Zhou D. Antidepressant-like effect of liquiritin from Glycyrrhiza uralensis in chronic variable stress induced depression model rats. Behav. Brain Res., 194, 108–113 (2008).
- 6) Kim YW, Ki SH, Lee JR, Lee SJ, Kim CW, Kim SC, Kim SG. Liquiritigenin, an aglycone of liquiritin in Glycyrrhizae radix, prevents acute liver injuries in rats induced by acetaminophen with or without buthionine sulfoximine. Chem-Biol. Interact., 161, 125–138 (2006).
- 7) Yu SM, Kuo S. Vasorelaxant effect of isoliquiritigenin, a novel soluble guanylate cyclase activator, in rat aorta. Br. J. Pharmacol., 114, 1587–1594 (1995).
- 8) Kobayashi S, Miyamoto T, Kimura I, Kimura M. Inhibitory effect of isoliquiritin, a compound in licorice root, on angiogenesis in vivo and tube formation in vitro. Biol. Pharm. Bull., 18, 1382–1386 (1995).
- 9) Wei S. Studies on geographical variation and provenance selection of Glycyrrhiza uralensis FISCHER. Northeast Forestry University, Shenyang (2003).
- 10) Yamamoto Y, Tani T. Growth and glycyrrhizin contents in Glycyrrhiza uralensis roots cultivated for four years in eastern Nei-Meng-gu of China. Journal of Traditional Medicines, 19, 87–92 (2002).
- 11) Kojoma M, Hayashi S, Shibata T, Yamamoto Y, Sekizaki H. Variation of glycyrrhizin and liquiritin contents within a population of 5-year-old licorice (Glycyrrhiza uralensis) plants cultivated under the same conditions. Biol. Pharm. Bull., 34, 1334–1337 (2011).
- 12) Li WD, Hou JL, Wang WQ, Tang XM, Liu CL, Xing D. Effect of water deficit on biomass production and accumulation of secondary metabolites in roots of Glycyrrhiza uralensis. Russian Journal of Plant Physiology, 58, 538–542 (2011).
- 13) Hayashi H, Fukui H, Tabata M. Distribution pattern of saponins in different organs of Glycyrrhiza glabra. Planta Med., 59, 351–353 (1993).
- 14) Shibano M, Ozaki K, Watanabe H, Tabata A, Taniguchi M, Baba K. Determination of flavonoids in licorice using acid hydrolysis and reversed-phase HPLC and evaluation of the chemical quality of cultivated licorice. Planta Med., 76, 729–733 (2010).
- 15) Zu Y, Zhao Z, Yang F, Cao J. Influences of artificial disturbing degrees on soil conditions and liquorice roots system. Acta Ecologica Sinica, 24, 724–729 (2004).
- 16) Drew MC. Oxygen deficiency and root metabolism: Injury and acclimation under hypoxia and anoxia. Annu. Rev. Plant Mol. Biol., 48, 223–250 (1997).
- 17) Mazid M, Khan TA, Mohammad F. Role of secondary metabolites in defense mechanisms of plants. Biology and Medicine, 3, 232–249 (2011).


