Abstract
Estimating the extent to which drugs inhibit uridine 5′-diphosphate-glucuronosyltransferases1A1 (UGT1A1) enzyme activity is important for predicting hepatotoxicity and neurotoxicity. UGT1A1 enzyme activity is commonly evaluated by detecting the elimination of bilirubin substrate or the generation of bilirubin glucuronides. However, the present methods are inadequate for accurately assessing bilirubin metabolism, selecting incubation conditions, and comparing different systems. Therefore, in our study, we first established a ultra-performance liquid chromatography (UPLC)-MS/MS method to identify bilirubin and bilirubin glucuronides. To ensure the reaction was linear, we performed assays to optimize the protein concentration and incubation time. Finally, we measured UGT1A1 activity using three different systems. Data revealed the optimum incubation conditions were 10 min with 0.5 mg/mL human liver microsomes (HLM), recombinant human UGT1A1 (rUGT1A1), and rat liver microsomes (RLM). Bilirubin glucuronidation obeyed Michaelis–Menten kinetics in all three systems. The diversity in bilirubin metabolism among species was revealed. rUGT1A1 had the strongest binding affinity for bilirubin, but the lowest metabolism velocity. Compared with the other systems, RLM exhibited a significant difference. It has the lowest CLint and the highest Km. The difference in parameters between three systems may be attributable to the species differences. In conclusion, these in vitro studies provide useful information regarding drug interactions and the prediction of toxicity for future studies.
Bilirubin is an endogenous substance formed from heme degradation. Approximately 250–400 mg of bilirubin is produced in a normal adult each day.1) In vivo, bilirubin exists mostly in the form of unconjugated bilirubin (UCB), which is metabolized predominantly by the liver. Hepatic glucuronidation, which is catalyzed primarily by uridine 5′-diphosphate-glucuronosyltransferases1A1 (UGT1A1) enzyme (UGT1A1), is an essential step for the elimination of bilirubin. It involves the conjugation of a glucuronyl moiety to either of the two propionic acid side chains of bilirubin, which are located on the C-8 and C-12 carbons of the two central pyrrole rings. This creates two bilirubin monoglucuronide (BMG) isomers (BMG1 and BMG2), which can be further glucuronidated to form an 8,12-diglucuronide (BDG2,3); Fig. 1). Both BMGs and BDG are more soluble for excretion into bile.4)
The partial or complete loss of UGT1A1 activity leads to the accumulation of unconjugated bilirubin in plasma.5) Furthermore, the inhibition of UGT1A1 might also cause elevated bilirubin levels in the blood. This would further exacerbate hyperbilirubinemia-induced apoptosis, cytotoxicity, and neurotoxicity, which results in irreversible brain and neurological damage such as Gilbert’s syndrome or Crigler–Najjar syndrome.6,7) Therefore, glucuronidation by UGT1A1 is an essential step that facilitates the elimination of the potentially toxic substance bilirubin.5)
Numerous studies have reported that several drugs, particularly traditional Chinese medicine, exhibit hepatotoxicity.8–10) The mechanism behind the cytotoxic effects of several of these components is the inhibition of UGT1A1.11) Therefore, establishing a reliable and effective method to detect UGT1A1 enzyme activity is important for further studies of the potential hepatotoxicity of these drugs. Currently, the most frequently used methods are to detect the elimination rate of specific enzyme substrates such as bilirubin or the formation of its metabolites. Several such studies have used microsomes or human recombinant UGT1A1. Because commercial products to measure bilirubin glucuronidation are unavailable, these studies only estimated the levels of bilirubin and its main metabolites using UV absorption without further mass spectra-based identification.12–14) As the two-phase bilirubin metabolism reaction involves glucuronidation and sulfation, its glucuronides and sulfides have the same molar extinction coefficient as does bilirubin; therefore, bilirubin metabolism cannot be confirmed using only UV. Because bilirubin metabolism is a sequential reaction that produces two monoglucuronides and a diglucuronide, it is important to optimize the incubation conditions, such as protein concentration and incubation time, to guarantee the initial rate. Some studies reported significant disparities in estimating the kinetic parameters for bilirubin glucuronidation when insufficient attention had been paid to selecting the initial conditions. The Km (Michaelis–Menten constant) of bilirubin glucuronidation ranges from 0.26 to 24 µM in the presence of 0.05–2.3 mg/mL microsomes or UGT1A1 and 5–35 min incubation times.11,12,15) Taken together, these studies suggest that the incubation conditions should be optimized carefully.
Several closely related isoforms of bilirubin glucuronosyltransferases are expressed in humans.16,17) For example, Crigler–Najjar syndrome type I (CN-I) is an autosomal recessive condition characterized by severe unconjugated hyperbilirubinemia. Because of genetic differences among ethnicities, significant differences are observed in bilirubin–UDP-glucuronosyltransferase activity among individuals in Western Europe, the Middle East, and North Africa. However, bilirubin glucuronosyltransferase activity is catalyzed by a single transferase isoform in rats.18,19) Differences in bilirubin metabolism among species are currently unknown. Therefore, different systems such as human liver microsomes (HLM) and rat liver microsomes (RLM) should be investigated together to ensure objective and accurate data.
The aim of the current study was to characterize the precise kinetics of bilirubin glucuronidation. First, ultra-performance liquid chromatography (UPLC)-MS/MS was used to assess bilirubin and bilirubin glucuronidation. Then, a sensitive and robust assay was developed to optimize the protein concentration and incubation time to ensure a linear reaction. Based on the above experiments, three different incubation systems were established using RLM, HLM, and rUGT1A1 to understand the kinetics of bilirubin glucuronidation, and the diversity in bilirubin metabolism among species were revealed. These in vitro studies provide useful information regarding drug interactions and the prediction of toxicity for future studies.
MATERIALS AND METHODS
Chemicals and MaterialsBilirubin (99.3%) was purchased from the National Institute for Food and Drug Control (Beijing, China). Trizma base and alamethicin were obtained from J&K Scientific (Beijing, China). Uridine diphosphoglucuronic acid (UDPGA), D-saccharic acid 1,4-lactone, and MgCl2 were purchased from Sigma-Aldrich (Beijing, China). rUGT1A1, pooled male Sprague-Dawley RLM, and pooled HLM (from 50 donors) were obtained from BD Gentest (Shanghai, China). All other chemicals used in the glucuronidation incubations and UPLC solvents were of HPLC grade and were obtained from Sigma-Aldrich (Beijing, China).
Incubation ConditionsSamples were incubated at 37°C in a shaking water bath. The incubation mixtures (final volume was 0.2 mL) contained 0.5 mg/mL rUGT1A1 (RLM or HLM), 0.1 M Tris–HCl (pH 7.4), 5 mM MgCl2, 5 mM D-saccharic acid 1,4-lactone, 3.5 mM UDPGA, and 50 mg/g protein alamethicin. Bilirubin was dissolved in 100% dimethyl sulfoxide (DMSO) immediately before it was added to the incubation mixtures; the final DMSO concentration was 1%. The reaction was initiated by the addition of UDPGA after a 5-min preincubation at 37°C, and was terminated by the addition of 0.6 mL of ice-cold methanol–acetonitrile (1 : 2) containing 200 mM ascorbic acid. Proteins were precipitated by centrifugation at 13000×g for 30 min at 4°C, and 10 µL of supernatant were injected into the UPLC system for quantification.
Chromatography ConditionsChromatographic analyses were performed on a Waters Acquity Ultra Performance LC system (Waters, U.S.A.) equipped with a binary pump, an automatic sampler, a Photo-Diode Array detector, a system controller, and a temperature-controlled oven. Bilirubin and its glucuronides were separated on an Acquity UPLC HSS C18 column (2.1 mm×100 mm; 1.8 µm) with a guard column (Acquity UPLC HSS C18 VanGuard pre-column, 2.1 mm×5 mm, 1.8 µm).
The mobile phase consisted of 0.1% formic acid in water (A), and 100% acetonitrile (B) was delivered at a flow rate of 0.4 mL/min. The linear gradient elution program was as follows: 0–2.1 min, 40–75% B; 2.1–4.2 min, 75–95% B; 4.2–8.0 min, 95% B; 8.0–8.5 min, 95–40% B. The column temperature was 35°C. The detection wavelength was 450 nm, and the sample injection volume was 10 µL.
Mass Spectrometer ConditionsSamples were analyzed on a Xevo™ QTof (Waters MS Technologies, Manchester, U.K.). The scan range was from 50 to 1200 m/z. For positive electrospray modes, the capillary and cone voltage were set at 2.0 kV and 40 V, respectively. The desolvation gas was set to 600 L/h at a temperature of 350°C, and the cone gas was set to 50 L/h, and the source temperature was set to 90°C. The micro-channel plate (MCP) detector voltage was set at 2200 V. Data were collected in continuum mode, in which the data acquisition rate was set to 0.1 s, with a 0.1 s interscan delay. All analyses were acquired using the lock spray feature to ensure accuracy and reproducibility. Leucine–enkephalin at a concentration of 2 µg/mL and a flow rate of 3 µL/min was used for the lock mass. The lock spray frequency was set at 10 s, and the data were averaged over 10 scans. An alternation low-energy (collision cell energy of 4 V) and elevated energy (collision cell energy ramped from 20 to 30 V) acquisition was used to obtain the precursor ion (MS) and their fragmentation data (MSE).
Incubation TimeTo characterize the linear conditions for the incubation time, 4.6 µM bilirubin was incubated with 0.5 mg/mL RLM for 0, 5, 10, 15, 20, 30, or 60 min (the concentration of bilirubin was 2.3 µM in HLM, and 1.1 µM in rUGT1A1). Then, 0.6 mL of ice-cold methanol–acetonitrile (1 : 2) containing 200 mM ascorbic acid was added to terminate the reaction. The incubation system was precipitated by centrifugation at 13000×g for 30 min at 4°C, and 10 µL of the supernatant was injected into the UPLC system for quantification.
Protein ConcentrationsTo optimize the initial reaction conditions, 7.8 µM bilirubin in RLM (2.4 µM bilirubin in HLM, 1.6 µM bilirubin in rUGT1A1) was incubated with different concentrations of protein (1.0, 0.75, 0.5, 0.25, and 0.125 mg/mL) for 15 min (10 min in RLM and rUGT1A1). The reaction was then terminated and analyzed as described above.
Kinetics of UGT1A1 in Different SystemsPreliminary experiments were performed to ensure that the bilirubin glucuronidation experiments were performed under optimal conditions. All incubations were performed as described above. The final concentration of bilirubin ranged from 0.24–2.73 µM in the HLM system, 0.12–1.97 µM in the RLM system, and 0.47–1.78 µM in the rUGT1A1 system. After a 5-min preincubation at 37°C, UDPGA was added to initiate the reaction. After 10 or 15 min, the reactions were terminated and analyzed as described above. All experiments were performed in triplicate.
Data AnalysisKinetic constants were analyzed by fitting the Michaelis–Menten equation (below) to the kinetic data. V defines the rate of the reaction, and [S] is the substrate concentration. The parameters Vmax and Km were defined as the maximum velocity and the substrate concentration at which the velocity equaled half of the maximum velocity, respectively.13,14,18–20) The intrinsic clearance (CLint) was calculated as Vmax/Km when the reaction exhibited Michaelis–Menten kinetics.
RESULTS
Qualitation and Quantification of Billirubin Monoglucuronides and DiglucuronideBilirubin glucuronides (BDG and BMGs) and bilirubin (multiple isomers) were detected at a wavelength of 450 nm. The UPLC method exhibited good selectivity and high resolution. Figure 2 shows representative chromatograms obtained in the presence and absence of UDPGA using the three incubation systems (RLM, HLM, and rUGT1A1). Peaks were assigned based on the lipophilicity of the glucuronides and retention times reported previously.12–14,16,20) Bilirubin and all metabolites were also identified using MS in the present study (Figs. 3, 4). It should be noted that bilirubin and bilirubin glucuronides are unstable at high temperature. Considering the unstability, the source temperature was set to 90°C.
As shown in Fig. 1, UCB was metabolized into BMGs (BMG2 and BMG1) and BDG. All analytes and their isomers were separated efficiently on the UPLC column. The peak at 1.07 min was assigned as bilirubin diglucuronide, which was observed at m/z 937.33 [M+H]+, 274.27 [M−2glu−C18H10N2O3+H]+, and 122.08 [M−2glu−C25H17N3O6+H]+. The peaks at 1.84 and 1.99 min were assigned as the monoglucuronides. The fragment signals were as follows: BMG1, m/z 761.30 [M+H]+, 274.30 [M−glu−C19H17N2O3+H]+, and 304.30 [M−C18H15N2O2+H]+, BMG2, m/z 761.30 [M+H]+, 274.27 [M−glu−C19H17N2O3+H]+, and 318.30 [M−glu−C17H13N2O2+H]+. Finally, the peak at 6.26 min was assigned as bilirubin with the signals m/z 585.27 [M+H]+, 274.30 [M−C18H18N2O2+H]+, and 304.30 [M−C17H16N2O+H]+ (Figs. 3, 4). Although the monoglucuronides were separated efficiently, it was difficult to assign the position of the propionic acid side-chain (C8 or C12) for the BMGs peaks with certainty.
The method for quantifying bilirubin and bilirubin glucuronides in the different incubation systems was validated according to the U.S. Food and Drug Administration guidelines for the analysis of drugs in biological fluids.21) The UPLC method showed good linearity in the range of 0.1–8.5 µM bilirubin, with correlation coefficients R2 (residual sum of squares)≥0.9992 for all three calibration curves. The limit of quantification for bilirubin was set at the lowest concentration in the linear standard curve: 2.1 nM (RLM), 1.8 nM (HLM), and 3.2 nM (rUGT1A1). For accurate and precision determinations, standard curves were constructed on eight separate days. The results did not exceed 4.2% of the relative standard deviation (RSD) at three concentrations.
Characterizing Initial Rate (Linear) ConditionsThe above experiments were used to characterize the linear reaction conditions. The incubation conditions used to analyze the kinetics of UGT1A1-mediated bilirubin glucuronidation were 10 min in the HLM (RLM or rUGT1A1) system (Fig. 5) because <20% of the initial substrate concentration had been converted to product and the formation of Total bilirubin glucuronides (TBG, TBG=BMG1+BMG2+BDG) was linear at these times.22) In addition, substrate was eliminated in a linear manner with protein concentrations of 0.125–1.0 mg/mL. Considering the low protein concentration will lead to detection error and high protein concentration may induce the protein binding especially the lipophilic drug, the most suitable protein concentration was setted as 0.5 mg/mL22) (Fig. 6).
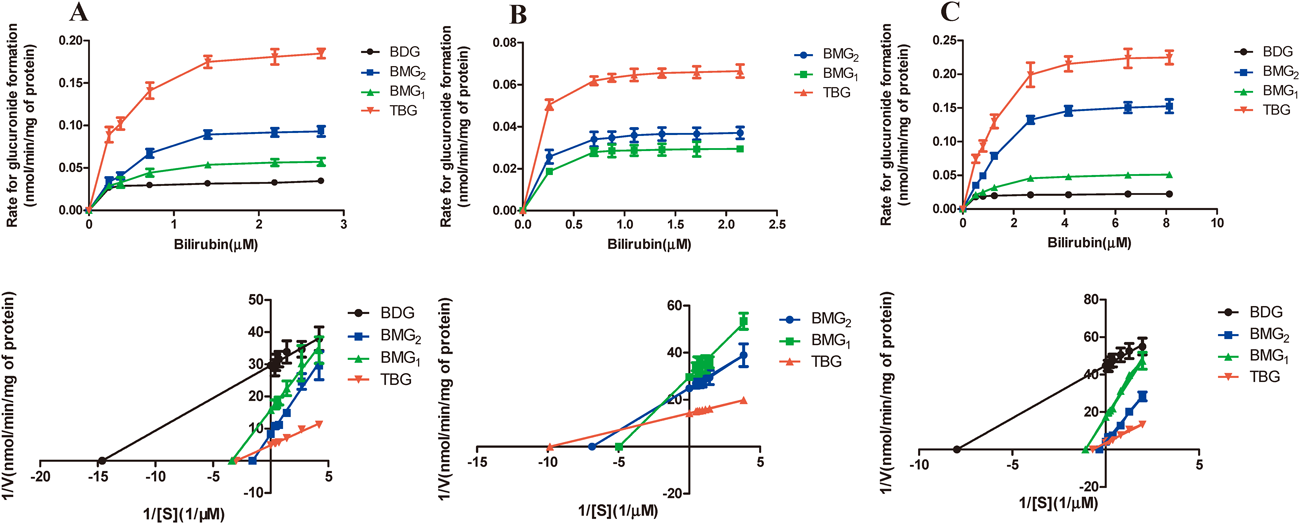
Enzyme Kinetics in Different SystemsFigure 7 shows the kinetic profiles for bilirubin and bilirubin glucuronides using the three systems according to the classic hyperbolic (Michaelis–Menten) profiles and the Michaelis equation. Lineweaver–Burk plot was used to calculate the kinetic parameters and the R2≥0.99. This confirms that the kinetic parameters of bilirubin and bilirubin glucuronidation were reliable.
As shown in Fig. 7 and Table 1, the apparent kinetic parameters of the TBG (total bilirubin glucuronides) were as follows: VRLM≈VHLM>VrUGT1A1 (* p<0.05); KRLM>KHLM>KrUGT1A1 (* p<0.05); CLHLM≈CLrUGT1A1>CLRLM (* p<0.05), respectively. It is interesting to note that the apparent kinetic parameters of bilirubin glucuronidations exhibited significant differences (* p<0.05). For example: VBMG2>VBMG1 (* p<0.05) in all the three systems; KBMG2>KBMG1 (* p<0.05) in HLM and RLM except in rUGT1A1; All the CLint values of BMG2 and BMG1 showed no significant difference (* p>0.05).
Table 1. Enzyme Kinetic Parameters in Different Systems (
n=3,
X̄±S.D.)
| Incubation systems | Km | Vmax | CLint | Equation |
|---|
| HLM | BDG | 0.07±0.004 | 0.03±0.001 | 0.49±0.006 | y=2.026x+29.63, R2=0.995 |
| BMG2 | 0.64±0.012 | 0.12±0.002 | 0.19±0.008 | y=5.302x+8.325, R2=0.988 |
| BMG1 | 0.30±0.015 | 0.06±0.002 | 0.21±0.006 | y=4.691x+15.83, R2=0.993 |
| TBG | 0.33±0.011 | 0.21±0.005 | 0.62±0.008 | y=1.608x+4.824, R2=0.992 |
| rUGT1A1 | BMG2 | 0.15±0.009 | 0.04±0.002 | 0.28±0.002 | y=3.613x+24.84, R2=0.999 |
| BMG1 | 0.20±0.014 | 0.03±0.001 | 0.17±0.001 | y=5.959x+29.65, R2=0.992 |
| TBG | 0.10±0.008 | 0.07±0.002 | 0.69±0.009 | y=1.444x+14.23, R2=0.999 |
| RLM | BDG | 0.13±0.010 | 0.02±0.001 | 0.18±0.001 | y=5.622x+44.83, R2=0.997 |
| BMG2 | 3.00±0.012 | 0.24±0.002 | 0.08±0.002 | y=12.23x+4.089, R2=0.992 |
| BMG1 | 0.92±0.021 | 0.06±0.003 | 0.06±0.001 | y=16.01x+17.35, R2=0.993 |
| TBG | 1.44±0.008 | 0.28±0.003 | 0.19±0.001 | y=5.147x+3.569, R2=0.993 |
DISCUSSION
At present, the bilirubin glucuronides were not available commercially. Because glucuronic acid does not absorb at a wavelength of 450 nm, the molar extinction coefficients of bilirubin glucuronidation are the same as bilirubin. So all the studies reported previously was used to evaluate the bilirubin glucuronides with the UV absorbance and without MS/MS identification. In this study we firstly ascertained the bilirubin and bilirubin glucuronidations with UPLC-MS/MS to guarantee the validity, and then the UV absorbance response for bilirubin was used to evaluate the bilirubin glucuronide concentration.12,14–16)
Different kinetic profiles for bilirubin glucuronidation using rUGT1A1 have been reported previously.12–14,20,23) Therefore, in our study the effects of protein concentration and incubation time on bilirubin glucuronidation were assessed carefully to establish accurate linear conditions for the reaction.21) Enzyme-catalyzed reactions display linear kinetics. At low substrate concentrations, the velocity displays first-order behavior that tracks linearly with substrate concentration. Conversely, at very high substrate concentrations the velocity switches to zero-order behavior, and has no dependence on substrate concentration. Therefore, reaction velocity should be measured during the early phase of the reaction, which will guarantee that v=v0 and the velocity is the initial velocity. The time course of product appearance and substrate depletion is linear up to the time when 20% of the initial substrate concentration has been converted to product. Furthermore, the protein concentration and reaction velocity must be suitable to ensure that the substrates are eliminated linearly.22) It was reported that the Km for bilirubin glucuronidation with rUGT1A1 ranges from 0.26–24 µM.14–16,24) No change in the rate of bilirubin glucuronidation was observed within this concentration range. Lower bilirubin concentrations (0.05–2 µM) were evaluated to estimate Km and Vmax. Data revealed that the reaction was already at Vmax with 1.25 µM bilirubin.11,14–16,24) Therefore, the current experiments were performed using bilirubin concentrations of 0.2–3 µM (HLM), 0.5–8 µM (RLM), and 0.5–2 µM (rUGT1A1). The protein concentration and incubation time were selected as described above to optimize the reaction conditions.
All the results suggested that rUGT1A1 had the strongest affinity for binding to bilirubin, but that it could not convert bilirubin into bilirubin glucuronides rapidly. In addition, RLM demonstrated a significant difference from HLM and rUGT1A1. It has the lowest CLint and the highest Km. The difference in bilirubin metabolism may owe to the diversity species. Importantly, although a different kinetic model was used in the current study, the Km for total bilirubin glucuronide formation by rUGT1A1 obtained was very similar to that reported previously.11,13–16,20,23) Interestingly, BDG could not be detected until 20 min in the rUGT1A1 system. Bilirubin glucuronidation by UGT1A1 is a sequential reaction, and the dynamic process is shown in Fig. 8.14,25,26) In this model, BMG can be converted directly to BDG either with or without release from the enzyme. This suggests that although rUGT1A1 had the strongest binding affinity for bilirubin, the reaction velocity was slower than that was with HLM and RLM. Therefore, the concentration of BDG was too low to be detected within 10 min.
The present study established different incubation systems to analyze bilirubin glucuronidation using HLM, RLM, and rUGT1A1, and simultaneously identify bilirubin and bilirubin glucuronides using UPLC-MS/MS. In addition, the appropriate protein concentrations and incubation times were optimized to ensure linear reaction conditions. The diversity in bilirubin metabolism among species was revealed. In all three incubation systems, the kinetics of bilirubin elimination and bilirubin glucuronide formation fit the Michaelis–Menten equation and displayed different kinetic parameters. rUGT1A1 had the strongest binding affinity for bilirubin, but the lowest metabolism velocity. Compared with the other systems, RLM exhibited a significant difference. It has the lowest CLint and the highest Km. The difference parameter between three systems may attribute to the species differences. Summarily these in vitro studies provide useful information regarding drug interactions and the prediction of toxicity for future studies.
Conflict of Interest
The authors declare no conflict of interest.
REFERENCES
- 1) Brierley CH, Burchell B. Human UDP-glucuronosyl transferases: chemical defence, jaundice and gene therapy. BioEssays, 15, 749–754 (1993).
- 2) Gollan JL, Schmid R. Liver and biliary disease: Pathophysiology, diagnosis, management. (Wright R, Millward-Sadler GH, Alberti KGMM eds.) WB Saunders Co., London, pp. 301–357 (1985).
- 3) Crawford JM, Ransil BJ, Potter CS, Westmoreland SV, Gollan JL. Hepatic disposition and biliary excretion of bilirubin and bilirubin glucuronides in intact rats. Differential processing of pigments derived from intra- and extrahepatic sources. J. Clin. Invest., 79, 1172–1180 (1987).
- 4) Jansen PL, Mulder GJ, Burchell B, Bock KW. New developments in glucuronidation research: Report of a workshop on “glucuronidation, its role in health and disease”. Hepatology, 15, 532–544 (1992).
- 5) Kadakol A, Ghosh SS, Sappal BS, Sharma G, Chowdhury JR, Chowdhury NR. Genetic lesions of bilirubin uridine-diphosphoglucuronate glucuronosyltransferase (UGT1A1) causing Crigler–Najjar and Gilbert Syndromes: correlation of genotype to phenotype. Hum. Mutat., 16, 297–306 (2000).
- 6) Vitek L, Ostrow JD. Bilirubin chemistry and metabolism; harmful and protective aspects. Curr. Pharm. Des., 15, 2869–2883 (2009).
- 7) Rotger M, Taffé P, Bleiber G, Günthard HF, Furrer H, Vernazza P, Drechsker H, Bernasconi E, Rickenbach M, Telenti A, Swiss HIV Cohort Study. Gilbert syndrome and the development of antiretroviral therapy-associated hyperbilirubinemia. Infect. Dis., 192, 1381–1386 (2005).
- 8) Song BZ, Shi HS. The relationship between Herbs with hepatotoxicity and property and active components—Analysis of literature on hepatotoxicity of 55 kinds herbs. Shangxi J. Tradit. Chin. Med., 2, 18–19 (2001).
- 9) Wang XJ, Xu LP, Wang M. Hepatotoxicity caused by commonly-used Chinese medicinal herbs and compound preparation. J. Capit. Univ. Med. Sci., 28, 220–224 (2007).
- 10) Li FY, Li Y. Research status of herbal drug-induced liver injury. CJTCMP, 24, 265–269 (2009).
- 11) Liu S, Cui LR. The application of metabonomics in the toxicity studies. Toxicology, 22, 155–158 (2008).
- 12) Ma G, Lin JY, Cai WM, Tan B, Xiang XQ, Zhang Y, Zhang P. Simultaneous determination of bilirubin and its glucuronides in liver microsomes and recombinant UGT1A1 enzyme incubation systems by HPLC method and its application to bilirubin glucuronidation studies. J. Pharm. Biomed. Anal., 92, 149–159 (2014).
- 13) Zhou J, Tracy TS, Remmel RP. Bilirubin glucuronidation revisited: proper assay conditions to estimate enzyme kinetics with recombinant UGT1A1. Drug Metab. Dispos., 38, 1907–1911 (2010).
- 14) Zhang D, Chando TJ, Everett DW, Patten CJ, Dehal SS, Humphreys WG. In vitro inhibition of UDP glucuronosyltransferases by atazanavir and other HIV protease inhibitors and the relationship of this property to in vivo bilirubin glucuronidation. Drug Metab. Dispos., 33, 1729–1739 (2005).
- 15) Senafi SB, Clarke DJ, Burchell B. Investigation of the substrate specificity of a cloned expressed human bilirubin UDP-glucuronosyltransferase: UDP-sugar specificity and involvement in steroid and xenobiotic glucuronidation. Biochem. J., 303, 233–240 (1994).
- 16) Udomuksorn W, Elliot DJ, Lewis BC, Mackenzie PI, Yoovathaworn K, Miners JO. Influence of mutations associated with Gilbert and Crigler–Najjar type II syndromes on the glucuronidation kinetics of bilirubin and other UDP-glucuronosyltransferase 1A substrate. Pharmacogenet. Genomics, 17, 1017–1029 (2007).
- 17) Wooster R, Sutherland L, Ebner T, Clarke D, Da Cruz e Silva O, Burchell B. Cloning and stable expression of a new member of the human liver phenol/bilirubin: UDP-glucuronosyltransferase cDNA family. Biochemistry, 278, 465–469 (1991).
- 18) Chowdhury NR, Arias IM, Lederstein M, Chowdhury JR. Substrates and products of purified rat liver bilirubin UDP-glucuronosyltransferase. Hepatology, 6, 123–128 (1986).
- 19) Ring BJ, Parli CJ, George MC, Wrighton SA. In vitro metabolism of zatosetron. Interspecies comparison and role of CYP3A. Drug Metab. Dispos., 22, 352–357 (1994).
- 20) Adachi S, Uesugi T, Kamisaka K. Study of bilirubin metabolism by high-performance liquid chromatography: stability of bilirubin glucuronides. Arch. Biochem. Biophys., 241, 486–493 (1985).
- 21) Center for Drug Evaluation and Research (CDER), Center for Veterinary Medicine (CVM), United States Food and Drug Administration. “Guidance for Industry: Bioanalytical Method Validation.”: ‹http://www.fda.gov/downloads/Drugs/Guidances/ucm070107.pdf›
- 22) Zeng S, Liu KX, Lu W. The clinical pharmacokinetic. pmph, Zhejiang, China (2007).
- 23) Doumas BT, Perry BW, Sasse EA, Straumfjord JV Jr. Standardization in bilirubin assays: evaluation of selected methods and stability of bilirubin solutions. Clin. Chem., 19, 984–993 (1973).
- 24) Seppen J, Bosma PJ, Goldhoorn BG, Bakker CT, Chowdhury JR, Chowdhury NR, Jansen PL, Oude Elferink RP. Discrimination between Crigler–Najjar types I and II by expression of mutant bilirubin uridine diphosphate-glucuronosyltransferase. J. Clin. Invest., 94, 2385–2391 (1994).
- 25) Peters WH, Jansen PL. Microsomal UDP-glucuronyltransferase-catalyzed bilirubin diglucuronide formation in human liver. J. Hepatol., 2, 182–194 (1986).
- 26) Crawford JM, Ransil BJ, Narciso JP, Gollan JL. Hepatic microsomal bilirubin UDP-glucuronosyltransferase. The kinetics of bilirubin mono- and diglucuronide synthesis. J. Biol. Chem., 267, 16943–16950 (1992).