Abstract
High-resolution deep tissue imaging is possible with two-photon excitation microscopy. With the combined application of two-photon imaging and perfusion with a polar fluorescent tracer, we have established a method to detect exocytic events inside secretory tissues. This method displays the spatiotemporal distribution of exocytic sites, dynamics of fusion pores, and modes of exocytosis. In glucose-stimulated pancreatic islets, exocytic events were observed to be synchronized with an increase in cytosolic Ca2+ concentrations. Full fusion of a single secretory granule is the typical mode of exocytosis and compound exocytosis is inhibited. Because two-photon excitation enables simultaneous multicolor imaging due to the broadened excitation spectra, the distributions and conformational changes in fluorescent-labeled molecules can be simultaneously visualized with exocytic events. Therefore, we can analyze the dynamics of the molecules involved in membrane fusion and their association with exocytosis in living tissues.
1. INTRODUCTION
Insulin is synthesized in beta cells in the pancreatic islets and stored in secretory granules. Following the increase in blood glucose concentration after meals, glucose is taken up into the cells and metabolized to depolarize the membrane potential.1,2) Depolarization induces the activation of voltage-dependent calcium channels, resulting in increase in cytosolic calcium concentrations. Such calcium signals trigger the fusion of plasma and vesicle membrane, formation of the fusion pore, and secretion of insulin outside of the cells through the pore. The secreted insulin affects the target organs, such as the liver, skeletal muscle, and fat cells, to lower the levels of glucose in the blood. We have applied two-photon excitation imaging to the pancreatic islet preparation and studied the mechanism of exocytosis, which is the final stage of secretion. In this review, we summarize our findings and related work.
2. PRINCIPLE OF TWO-PHOTON EXCITATION AND MERIT IN IMAGING
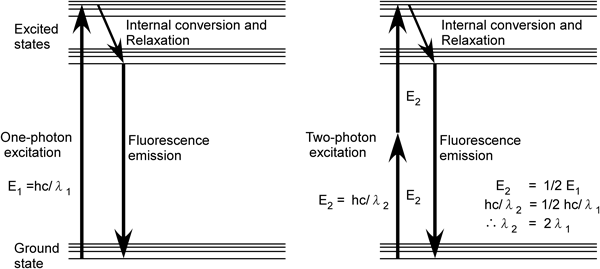
In conventional (one-photon) excitation, a fluorophore existing in the ground state absorbs a single photon and is excited to a higher energy state (Fig. 1). After a short period of time, the excited fluorophore relaxes back to its ground state by emitting a photon of fluorescent light. In two-photon excitation, a fluorophore simultaneously absorbs two photons and is excited.3) Because the energy of a photon is inversely proportional to its wavelength, two-photon excitation can be achieved with approximately twice the wavelength. For example, the calcium fluorescent indicator fura-2 is excited by ultraviolet (UV; wavelength: 300–400 nm) radiation in conventional one-photon excitation; however, in two-photon excitation, infrared light (wavelength: 750–850 nm) can be utilized. Light with greater wavelengths generally scatters less in the biological samples; thus, two-photon excitation is suitable for imaging deep inside the tissues (ca. 1 mm). Furthermore, phototoxicity has been reported at a shorter wavelength illumination (particularly for UV); thus, excitation at greater wavelengths enables longer observations with repetitive excitation.4)
Two-photon excitation is achieved when two photons are simultaneously absorbed within 10−18 s. Hence, much higher photon density is required compared with one-photon excitation. Recently, an ultrashort-pulsed mode-locked laser was developed that can generate pulses with a duration of ca. 100 fs at a repetition rate of ca. 100 MHz (10-ns interval), enabling high peak power with low average power. Therefore, effective two-photon excitation can be achieved during the pulse period, which reduces the photodamage due to the low average intensity. In addition, focusing the excitation light with an objective lens creates a spatial concentration of photon flux, which results in tomographical excitation. Thus, without pinholes, which are necessary in confocal imaging, tomographic images can be consequently obtained, which enables us to utilize all of the emitted light effectively without excluding the out-of-focus emissions.
Two-photon imaging is also suitable for simultaneous multicolor imaging because the excitation spectra are broadened in two-photon excitation compared with the conventional one-photon excitation.4) Consequently, several kinds of fluorescent tracers can be simultaneously excited with a single laser source, and the focal plane is ensured to be the same among several kinds of fluorescent tracers. This aspect brings an advantage in observing the biophenomena that occur with a short period of duration within a small area, such as the exocytosis of single hormone-containing vesicles (ca. 3 s, ca. 0.5 µm2).
3. IMAGING OF INSULIN EXOCYTOSIS
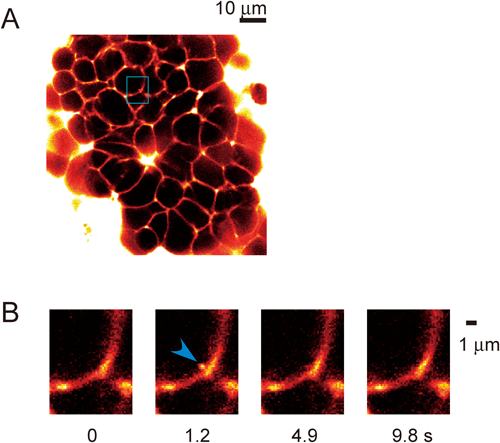
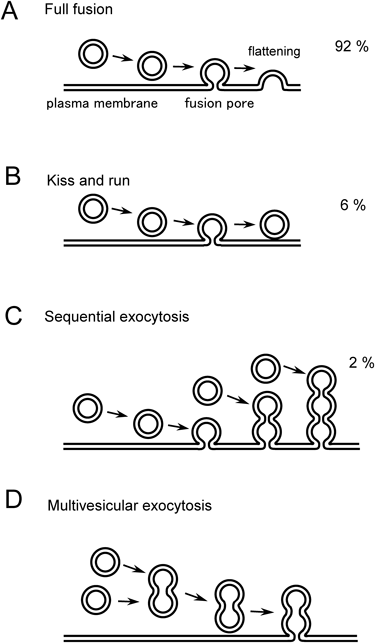
We labeled the extracellular solution with hydrophilic polar fluorescent tracers to detect exocytic events of individual insulin granules. We isolated the mouse pancreatic islets with collagenase digestion, and the islets were placed in a glass-bottomed chamber. When we perifused the islets with a solution containing fluorescent tracers, such as sulforhodamine B (SRB), Lucifer yellow, or Alexa594, we were able to image mesh structures inside the islets.5) A three-dimensional reconstruction of the structure revealed it to be tubular; thus, the fluorescent mesh structure mainly reflected the microvasculature inside the islets (Fig. 2A). When we stimulated the islets with glucose (8–20 mM), fluorescent spots with diameters of 0.2–0.7 µm suddenly appeared close to the intercellular space in the islets6) (Fig. 2B). These fluorescent spots reflected the exocytic events of insulin granules because the extracellular polar fluorescent tracers back-filled into the granules through the fusion pore. Typically, most of them (92%) decayed within several seconds, mainly reflecting the flattening of the vesicle membrane after fusion7,8) (Fig. 3A), thereby releasing the vesicular contents into the extracellular space. These exocytic events were synchronously detected with an increase in the cytosolic calcium concentration, which often occurs in an oscillatory manner.9) The frequency of detected exocytic events per 800-µm2 field corresponded well with the reported number of insulin secretion events from a single cell, which was estimated as 6–12 granules/min/cell.10) Therefore, the imaging system detected most of the insulin exocytosis that occurred in the focal plane. Further treatment with forskolin, an activator of adenylate cyclase that increases the cytosolic concentration of cAMP, induced more exocytic events during both the phases of insulin secretion.11)
4. SPATIAL DISTRIBUTION OF EXOCYTOSIS
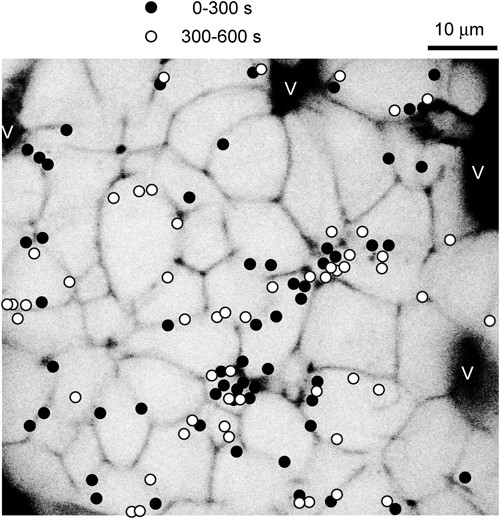
In our studies, insulin exocytosis has been observed all over the plasma membrane of beta cells, which is in agreement with the findings of previous studies.12) However, there appears to be a slight trend toward exocytosis occurring more near blood vessels6,13) (Fig. 4). The presynaptic scaffold proteins RIM214) and piccolo15) were reported to be enriched in the beta cells membrane that borders the vasculature; however, the soluble N-ethylmaleimide-sensitive factor attachment protein receptor (SNARE) proteins that are involved in membrane fusion, syntaxin1A and synaptosomal-associated protein (SNAP) 25, are relatively uniformly distributed around the cell membrane.13) Because no tight junction structures are observed in the islets16) or endocrine cells in general, the intercellular space of the endocrine gland is the major pathway for hormone secretion.
5. DYNAMICS OF PORE FUSION
During the fusion of two membranes, a semi-stable aqueous pore is initially formed, and this structure is called the fusion pore. Time-resolved membrane capacitance measurements have been used to estimate the pore diameter. The diameters were estimated to be approximately 0.3–2 nm when the pore was stable for a period and could be reversibly closed.17–19) However, capacitance measurements cannot be used to estimate the diameters of pores that are larger than 2 nm for small vesicles or 6 nm for large vesicles.17,18)
To overcome this limitation, we used fluorescent polar tracers as nanometer-sized probes in the imaging experiments.6) In these experiments, we used two polar tracers, SRB (0.3–0.7 mM) and dextrans, conjugated with fluoresceins of different molecular weights (0.5–2 mM). Based on the molecular structures and light scattering, we estimated the hydrodynamic diameters of SRB and 10-kDa fluorescein dextran (FD) to be 1.4 nm and 6 nm, respectively4) and found that the large dense-core vesicles of adrenal chromaffin cells and PC12 cells were nearly simultaneously stained with the two compounds with a time lag of <50 ms. This time lag was consistent with the 10–50-ms lifetime of the fusion pore that has been observed in these cells in studies that use capacitance measurements and amperometry.20)
In beta cells, there were significant time lags of 1–2 s between SRB and 10-kDa FD signals, with a mean latency of 1.8 s,6) suggesting that the dilation of the fusion pore is exceptionally slow for insulin vesicles in beta cells. Several observations support that the slow expansion of the fusion pore is due to the crystallization of insulin in the vesicles, which prevents the dilation of the vesicle contents and consequently the fusion pore. The first of these observations is that pore dilation is further slowed by the extracellular addition of zinc (Zn; 3 mM) to the extracellular solution, and this is known to stabilize insulin crystals by binding to insulin.21) Second, pore dilation is significantly faster in guinea pig islets, where crystallization of insulin is known to be less prevalent.21) Finally, experiments with 70-kDa FD showed that the flattening of the vesicles starts after the fusion pores were dilated to more than 12 nm,6) which may be interpreted to mean that the flattening of the vesicles occurs when the fusion pore allows permeation of the 36-kDa insulin hexamer. Thus, our study suggested that the secretion of insulin takes several seconds, which is in line with the Zn-imaging results.22) In contrast, the decay of insulin-green fluorescent protein (GFP) release occurs within 1 s in total internal reflection fluorescence (TIRF) imaging experiments,23–25) and this is likely because of the lack of crystallization of insulin-GFP in these experiments.
Although the closure of the fusion pore can be reversible, transient openings are not larger than 6 nm in beta cells, which is similar to what has been reported in other cells.6,26,27) Some granules at such transient pore sites subsequently move away from the site of exocytosis,6) suggesting that these granules were engaged in kiss-and-run secretion (Fig. 3B). Because insulin supposedly cannot be secreted through such a transient and narrow fusion pore,6,28) such kiss-and-run events are considered to be failures of insulin secretion. In fact, such kiss-and-run exocytosis represents only 6%–7% of all the exocytotic events in beta cells, and this is further reduced at higher cytosolic concentrations of cAMP.10) While experiments employing the confocal imaging of islets7) and Zn imaging of insulin release22) also indicate that most insulin granules undergo full fusion exocytosis in beta cells, kiss-and-run exocytosis was detected more frequently in TIRF imaging experiment.29) This suggests that the process of exocytosis significantly differs in the plasma membranes on glass cover slips compared with cells expressing exogenous proteins.
6. MODE OF EXOCYTOSIS
Two-photon imaging study revealed that most insulin exocytosis was mediated by the fusion of single vesicles with the plasma membrane. However, compound exocytosis has been reported in other secretory tissues, where several granules were involved in the membrane fusion. Two types of compound exocytosis have been suggested by several lines of evidence: sequential and multivesicular exocytosis (Figs. 3C, D). First, sequential exocytosis is observed in several secretory tissues, including pancreatic acinar cells,30) adrenal medulla,27) or pituitary lactotrophs,31) where the vesicles on the internal side of the cells fuse with the membranes of granules that are already fused with the plasma membrane. Thus, the site of exocytosis sequentially moves into the internal area of the cells. Furthermore, secretion can be achieved even without the transport of individual granules toward the cell surface. In cases where the area designated for exocytosis is anatomically restricted, such as the luminal area of exocrine cells that faces the duct, sequential exocytosis is considered to be an effective mode for secretion. In pancreatic islets, sequential exocytosis was inhibited to approximately 2% of the total exocytic events,32) suggesting that insulin granules should be transported just beneath the plasma membrane to be released. Thus, the vesicular transport process should be a target in secretory regulation, and secretion can be fine-tuned. In the second mode of compound exocytosis, multivesicular exocytosis, several granules are fused together in advance for the fusion with the plasma membrane. Such exocytosis is described in eosinophils33,34) and peritoneal mast cells,35) in which explosive secretion can be observed. In pancreatic islet preparations, multivesicular exocytosis is inhibited because of the distribution of the fluorescent spots (diameter, 0.2–0.7 µm). This notion correlates with the inhibition of hypoglycemia because robust and abrupt insulin release brings the risk of damage to living tissue. Although multivesicular exocytosis partly contributes to insulin exocytosis, stimulation with carbachol was reported to increase its frequency by approximately four-fold.36)
The mode of exocytosis was modulated by Sec1/munc18 proteins (SM proteins) that bind to SNARE proteins and facilitate their assembly to mediate membrane fusion. Munc18b is one of the Munc18 isoforms that is expressed in pancreatic islets, and the deletion of Munc18b by shRNA reduced insulin secretion.37) Interestingly, a Munc18b mutant, Munc18b-K314L/R315L (Munc18b-KR), is a mutant that facilitates SNARE complex assembly. The laboratory of Lam and Gaisano showed that Munc18b-KR facilitated the complex formation between Syntaxin1/2-VAMP2-SNAP25 and Syntaxin3-VAMP8-SNAP25 in islets that were stimulated by glucose, GLP-1, and IBMX.37) Syntaxin 2, Syntaxin 3 and Munc18b were abundant at the insulin granules, and the overexpression of Munc18b-KR facilitated the fusion between secretory granules, and enhanced the frequency of sequential exocytic events up to 12%.37) Therefore, different types of SNARE molecules are involved in fusion between secretory granules compared with granule fusion with the plasma membrane.38)
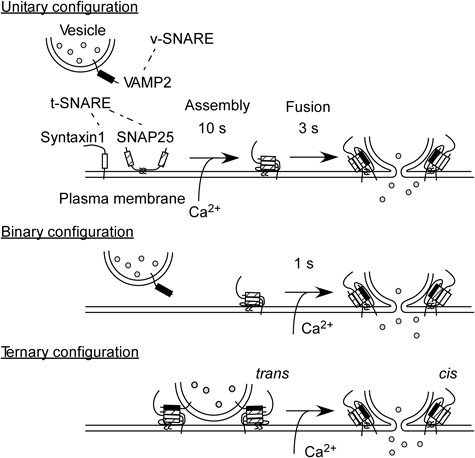
7. SNARE ASSEMBLY AND EXOCYTOSIS
Several kinds of SNARE proteins are expressed in pancreatic islets,39–41) and each molecule has one or two α helices. VAMP2 is expressed on the vesicular membrane, and SNAP25 or syntaxin1 is mainly expressed at the target plasma membrane (Fig. 5). After the α-helices assemble with each other, the zippering of four coiled-coil domains among the three SNAREs prompts the fusion of the vesicular and plasma membranes. Although the participants and in vitro kinetics of SNARE assembly are known, the timing of SNARE assembly relative to Ca2+ entry and exocytosis has not been demonstrated in secretory cells or neurons. To monitor the conformational changes of SNAP25 in living secretory cells, we constructed an intramolecular fluorescence resonance energy transfer (FRET) probe of SNAP25 by fusing two GFP variants, enhanced cyan fluorescent protein (ECFP), and Venus, to SNAP2542) and named it SNAP25 Reporter Linker Mutant (SLIM).43) Immunoprecipitation experiments showed that SLIM formed a binary complex with α helix of syntaxin and a ternary complex by the addition of α helix of VAMP2. When SLIM assembled with Syntaxin1 in the cuvette, the fluorescence ratio of Venus/ECFP increased as the two fluorophores drew together and induced FRET. The further addition of VAMP2 did not affect the fluorescent ratio, indicating that SLIM selectively reflected the assembly of SNARE molecules that were expressed at the plasma membrane (t-SNAREs).
The initial FRET values were correlated with fusion readiness in pancreatic islets. cDNA of SLIM was introduced into islet cells using an adenoviral vector, and the samples were immersed in a solution containing the polar fluorescent tracer, Alexa594. FRET values varied over the surface of the beta cells, and its distribution was fitted with the sum of two Gaussian functions. The two components, high- and low-FRET region, corresponded to the areas with assembled and unassembled t-SNARE complexes, respectively. We next triggered Ca2+-dependent exocytosis with glucose stimulation or by uncaging a caged-Ca2+ compound and simultaneously monitored FRET value (Venus/ECFP) and exocytic events (Alexa594). In the high-FRET regions, exocytosis could be detected 1.5 times more frequently than in the low-FRET regions. Statistical comparisons of the glucose-induced exocytic events before and after 200 s indicated significantly lower FRET values in the later events.43)
In addition, we analyzed the conformational changes in SLIM that were associated with quantal insulin exocytic events. We averaged more than 100 FRET traces at the site of exocytosis, and these were synchronized with the onset of exocytosis. In high-FRET regions, the average FRET signals were unchanged during exocytosis, an observation consistent with the interpretation that SNAREs are already assembled in such regions. In contrast, the average FRET signals in low-FRET regions increased during exocytosis. This increase preceded exocytosis by approximately 3 s, which suggests that SNARE assembly is a prerequisite for membrane fusion. The amount of SNAP25 participating in exocytosis was estimated to be approximately 12% of the total SNAP25 levels within the measurement region, which has a membrane area of ca. 0.5 µm2.43) In chromaffin cells, the conformational changes in SNAP25 during exocytosis were examined with the combined use of a FRET probe of SNAP25 (SNARE complex reporter),42,44) TIRF microscopy, and amperometry. The average FRET signal from 900 fusion events was reported to precede the opening of the fusion pore by 90 ms, and ca. 7% of the FRET probe molecules were estimated to be involved in the transient FRET increase within the area of the exocytic site (0.1 µm2).44)
Because two-photon microscopy utilizes an ultra-short pulse laser, it is also suited for fluorescence lifetime imaging,45) which enables the quantification of intermolecular as well as intramolecular FRET. Combined with simultaneous multicolor imaging, the molecular mechanisms of exocytosis are expected to be elucidated in living tissues.
Conflict of Interest
The author declares no conflict of interest.
REFERENCES
- 1) Ashcroft FM, Rorsman P. KATP channels and islet hormone secretion: new insights and controversies. Nat. Rev. Endocrinol., 9, 660–669 (2013).
- 2) MacDonald PE, Joseph JW, Rorsman P. Glucose-sensing mechanisms in pancreatic beta-cells. Philos. Trans. R. Soc. Lond. B, Biol. Sci., 360, 2211–2225 (2005).
- 3) Benninger RK, Piston DW. Two-photon excitation microscopy for the study of living cells and tissues. Curr. Protoc. Cell. Biol. Chapter 4, Unit 4, 11, 1–24 (2013).
- 4) Kasai H, Kishimoto T, Nemoto T, Hatakeyama H, Liu TT, Takahashi N. Two-photon excitation imaging of exocytosis and endocytosis and determination of their spatial organization. Adv. Drug Deliv. Rev., 58, 850–877 (2006).
- 5) Takahashi N, Nemoto T, Kimura R, Tachikawa A, Miwa A, Okado H, Miyashita Y, Iino M, Kadowaki T, Kasai H. Two-photon excitation imaging of pancreatic islets with various fluorescent probes. Diabetes, 51 (Suppl. 1), S25–S28 (2002).
- 6) Takahashi N, Kishimoto T, Nemoto T, Kadowaki T, Kasai H. Fusion pore dynamics and insulin granule exocytosis in the pancreatic islet. Science, 297, 1349–1352 (2002).
- 7) Ma L, Bindokas VP, Kuznetsov A, Rhodes C, Hays L, Edwardson JM, Ueda K, Steiner DF, Philipson LH. Direct imaging shows that insulin granule exocytosis occurs by complete vesicle fusion. Proc. Natl. Acad. Sci. U.S.A., 101, 9266–9271 (2004).
- 8) Speidel D, Salehi A, Obermueller S, Lundquist I, Brose N, Renström E, Rorsman P. CAPS1 and CAPS2 regulate stability and recruitment of insulin granules in mouse pancreatic beta cells. Cell Metab., 7, 57–67 (2008).
- 9) Kaneko K, Ueki K, Takahashi N, Hashimoto S, Okamoto M, Awazawa M, Okazaki Y, Ohsugi M, Inabe K, Umehara T, Yoshida M, Kakei M, Kitamura T, Luo J, Kulkarni RN, Kahn CR, Kasai H, Cantley LC, Kadowaki T. Class IA phosphatidylinositol 3-kinase in pancreatic beta cells controls insulin secretion by multiple mechanisms. Cell Metab., 12, 619–632 (2010).
- 10) Hatakeyama H, Kishimoto T, Nemoto T, Kasai H, Takahashi N. Rapid glucose sensing by protein kinase A for insulin exocytosis in mouse pancreatic islets. J. Physiol., 570, 271–282 (2006).
- 11) Seino S, Shibasaki T. PKA-dependent and PKA-independent pathways for cAMP-regulated exocytosis. Physiol. Rev., 85, 1303–1342 (2005).
- 12) Bonner-Weir S. Morphological evidence for pancreatic polarity of beta-cell within islets of Langerhans. Diabetes, 37, 616–621 (1988).
- 13) Low JT, Zavortink M, Mitchell JM, Gan WJ, Do OH, Schwiening CJ, Gaisano HY, Thorn P. Insulin secretion from beta cells in intact mouse islets is targeted towards the vasculature. Diabetologia, 57, 1655–1663 (2014).
- 14) Yasuda T, Shibasaki T, Minami K, Takahashi H, Mizoguchi A, Uriu Y, Numata T, Mori Y, Miyazaki J, Miki T, Seino S. Rim2alpha determines docking and priming states in insulin granule exocytosis. Cell Metab., 12, 117–129 (2010).
- 15) Fujimoto K, Shibasaki T, Yokoi N, Kashima Y, Matsumoto M, Sasaki T, Tajima N, Iwanaga T, Seino S. Piccolo, a Ca2+ sensor in pancreatic beta-cells. Involvement of cAMP-GEFII.Rim2. Piccolo complex in cAMP-dependent exocytosis. J. Biol. Chem., 277, 50497–50502 (2002).
- 16) in’t Veld PA, Pipeleers DG, Gepts W. Evidence against the presence of tight junctions in normal endocrine pancreas. Diabetes, 33, 101–104 (1984).
- 17) Klyachko VA, Jackson MB. Capacitance steps and fusion pores of small and large-dense-core vesicles in nerve terminals. Nature, 418, 89–92 (2002).
- 18) Alvarez de Toledo G, Fernández-Chacón R, Fernández JM. Release of secretory products during transient vesicle fusion. Nature, 363, 554–558 (1993).
- 19) Breckenridge LJ, Almers W. Currents through the fusion pore that forms during exocytosis of a secretory vesicle. Nature, 328, 814–817 (1987).
- 20) Zhou Z, Misler S, Chow RH. Rapid fluctuations in transmitter release from single vesicles in bovine adrenal chromaffin cells. Biophys. J., 70, 1543–1552 (1996).
- 21) Dodson G, Steiner D. The role of assembly in insulin’s biosynthesis. Curr. Opin. Struct. Biol., 8, 189–194 (1998).
- 22) Michael DJ, Ritzel RA, Haataja L, Chow RH. Pancreatic beta-cells secrete insulin in fast- and slow-release forms. Diabetes, 55, 600–607 (2006).
- 23) Ohara-Imaizumi M, Fujiwara T, Nakamichi Y, Okamura T, Akimoto Y, Kawai J, Matsushima S, Kawakami H, Watanabe T, Akagawa K, Nagamatsu S. Imaging analysis reveals mechanistic differences between first- and second-phase insulin exocytosis. J. Cell Biol., 177, 695–705 (2007).
- 24) Kasai K, Fujita T, Gomi H, Izumi T. Docking is not a prerequisite but a temporal constraint for fusion of secretory granules. Traffic, 9, 1191–1203 (2008).
- 25) Shibasaki T, Takahashi H, Miki T, Sunaga Y, Matsumura K, Yamanaka M, Zhang C, Tamamoto A, Satoh T, Miyazaki J, Seino S. Essential role of Epac2/Rap1 signaling in regulation of insulin granule dynamics by cAMP. Proc. Natl. Acad. Sci. U.S.A., 104, 19333–19338 (2007).
- 26) Liu TT, Kishimoto T, Hatakeyama H, Nemoto T, Takahashi N, Kasai H. Exocytosis and endocytosis of small vesicles in PC12 cells studied with TEPIQ (two-photon extracellular polar-tracer imaging-based quantification) analysis. J. Physiol., 568, 917–929 (2005).
- 27) Kishimoto T, Kimura R, Liu TT, Nemoto T, Takahashi N, Kasai H. Vacuolar sequential exocytosis of large dense-core vesicles in adrenal medulla. EMBO J., 25, 673–682 (2006).
- 28) Barg S, Olofsson CS, Schriever-Abeln J, Wendt A, Gebre-Medhin S, Renström E, Rorsman P. Delay between fusion pore opening and peptide release from large dense-core vesicles in neuroendocrine cells. Neuron, 33, 287–299 (2002).
- 29) Tsuboi T, McMahon HT, Rutter GA. Mechanisms of dense core vesicle recapture following “kiss and run” (“cavicapture”) exocytosis in insulin-secreting cells. J. Biol. Chem., 279, 47115–47124 (2004).
- 30) Nemoto T, Kimura R, Ito K, Tachikawa A, Miyashita Y, Iino M, Kasai H. Sequential-replenishment mechanism of exocytosis in pancreatic acini. Nat. Cell Biol., 3, 253–258 (2001).
- 31) Cochilla AJ, Angleson JK, Betz WJ. Differential regulation of granule-to-granule and granule-to-plasma membrane fusion during secretion from rat pituitary lactotrophs. J. Cell Biol., 150, 839–848 (2000).
- 32) Takahashi N, Hatakeyama H, Okado H, Miwa A, Kishimoto T, Kojima T, Abe T, Kasai H. Sequential exocytosis of insulin granules is associated with redistribution of SNAP25. J. Cell Biol., 165, 255–262 (2004).
- 33) Scepek S, Lindau M. Focal exocytosis by eosinophils—compound exocytosis and cumulative fusion. EMBO J., 12, 1811–1817 (1993).
- 34) Hafez I, Stolpe A, Lindau M. Compound exocytosis and cumulative fusion in eosinophils. J. Biol. Chem., 278, 44921–44928 (2003).
- 35) Alvarez de Toledo G, Fernandez JM. Compound versus multigranular exocytosis in peritoneal mast cells. J. Gen. Physiol., 95, 397–409 (1990).
- 36) Hoppa MB, Jones E, Karanauskaite J, Ramracheya R, Braun M, Collins SC, Zhang Q, Clark A, Eliasson L, Genoud C, Macdonald PE, Monteith AG, Barg S, Galvanovskis J, Rorsman P. Multivesicular exocytosis in rat pancreatic beta cells. Diabetologia, 55, 1001–1012 (2012).
- 37) Lam PP, Ohno M, Dolai S, He Y, Qin T, Liang T, Zhu D, Kang Y, Liu Y, Kauppi M, Xie L, Wan WC, Bin NR, Sugita S, Olkkonen VM, Takahashi N, Kasai H, Gaisano HY. Munc18b is a major mediator of insulin exocytosis in rat pancreatic beta-cells. Diabetes, 62, 2416–2428 (2013).
- 38) Zhu D, Zhang Y, Lam PP, Dolai S, Liu Y, Cai EP, Choi D, Schroer SA, Kang Y, Allister EM, Qin T, Wheeler MB, Wang CC, Hong WJ, Woo M, Gaisano HY. Dual role of VAMP8 in regulating insulin exocytosis and islet beta cell growth. Cell Metab., 16, 238–249 (2012).
- 39) Lang J. Molecular mechanisms and regulation of insulin exocytosis as a paradigm of endocrine secretion. Eur. J. Biochem., 259, 3–17 (1999).
- 40) Gerber SH, Südhof TC. Molecular determinants of regulated exocytosis. Diabetes, 51 (Suppl. 1), S3–S11 (2002).
- 41) Spurlin BA, Thurmond DC. Syntaxin 4 facilitates biphasic glucose-stimulated insulin secretion from pancreatic beta-cells. Mol. Endocrinol., 20, 183–193 (2006).
- 42) An SJ, Almers W. Tracking SNARE complex formation in live endocrine cells. Science, 306, 1042–1046 (2004).
- 43) Takahashi N, Hatakeyama H, Okado H, Noguchi J, Ohno M, Kasai H. SNARE conformational changes that prepare vesicles for exocytosis. Cell Metab., 12, 19–29 (2010).
- 44) Zhao Y, Fang Q, Herbst AD, Berberian KN, Almers W, Lindau M. Rapid structural change in synaptosomal-associated protein 25 (SNAP25) precedes the fusion of single vesicles with the plasma membrane in live chromaffin cells. Proc. Natl. Acad. Sci. U.S.A., 110, 14249–14254 (2013).
- 45) Oliveira AF, Yasuda R. An improved Ras sensor for highly sensitive and quantitative FRET-FLIM imaging. PLoS ONE, 8, e52874 (2013).