Abstract
Lipin1, a bifunctional protein, regulates fatty acid utilization in the triglyceride biosynthesis pathway. In the current study, using a liver-specific in vivo short interfering RNA (siRNA) delivery system, we examined the pathological and physiological roles of hepatic Lipin1 in the development of insulin resistance and the maintenance of systemic energy homeostasis. Liver-specific silencing of Lipin1 expression was achieved by the systemic administration of siRNA against Lpin1 mRNA (siLpin1)-loaded lipid nanoparticles (LNPs) to wild type mice at 3–4 d intervals for 25 d. The siLpin1-treated mice showed normal blood glucose levels and insulin sensitivity, however, triglyceride (TG) levels were reduced in liver and peripheral blood of them. The knockdown of hepatic Lipin1 in mice led to marked decrease in adipose tissue mass and adipocyte diameters in epididymal and inguinal fat depots without the undesired silencing of Lipin1 in adipose tissue. In summary, we report for the first time that the down-regulation of hepatic Lipin1 expression leads to less adiposity as well as a decrease in TG level in the liver and blood circulation, without any alterations in the glucose tolerance and blood glucose levels. Our findings may provide new insights into the physiological roles of hepatic Lipin1 in systemic energy homeostasis.
Lipin1 protein, encoded by the Lpin1 gene, has critical roles in the regulation of lipid metabolism and energy homeostasis in adipose tissue, skeletal muscle, and the liver. Lipin1 was originally identified as the gene product lacking in the fatty liver dystrophy (fld) mouse.1) A defective mutation in the Lpin1 gene in fld mice causes lipodystrophy, characterized by a severe loss of adipose tissue,2) resulting in insulin resistance2) and circulating hyperlipidemia.3) On the other hand, the development of obesity is promoted in the adipose- and skeletal muscle-specific Lpin1 transgenic mice.4) However, interestingly, the obesity-associated phenotypes in these two transgenic strains are different. The overexpression of the Lpin1 gene in skeletal muscle leads to reduced energy metabolism and insulin resistance, although adipose-specific Lpin1 transgenic mice exhibit an elevated triglyceride content in adipocytes but their insulin sensitivity is improved.4) It follows from this that the physiological and pathological functions of Lipin1 might be different in the cell type.
The role of Lipin1 in the liver appears to be more complicated. Lipin1 functions in the nucleus as a transcriptional coactivator of the peroxisome proliferator-activated receptor α (PPARα) and PPARγ coactivator 1α (PGC-1α) to activate the expression of their target genes that are involved in mitochondrial fatty acid oxidation.5) In contrast, in cytoplasm, Lipin1 was also reported to function as a phosphatidic acid phosphatase for generating diacylglycerol (DAG) and to regulate triglyceride (TG) synthesis6) and very low-density lipoprotein (VLDL) secretion.7) In fasting conditions, the liver generates ketone bodies by accelerating fatty acid oxidation to provide energy for other organs, including the brain. On the other hand, in fed conditions, the liver synthesizes TG by esterifying fatty acids with glycerol and provides TG to peripheral tissues, including muscle and adipose tissue, in the form of VLDL. Therefore, the multifunctional activities of Lipin1 might contribute to the maintenance of systemic energy homeostasis through switching the direction of hepatic fatty acid utilization.
Insulin resistance is known to be highly associated with the development of type2 diabetes. DAG generated in response to an increase in fatty acid levels is known to inhibit insulin signaling by activating protein kinase C (PKC) ε.8–11) Therefore, hepatic Lipin1 might be highly linked to insulin resistance and diabetes through the regulation of fatty acid utilization in the liver. In fact, it is known that hepatic Lpin1 expression in obese diabetic db/db mice is elevated compared to that for wild type mice.5,12) It was also shown that the knockdown of hepatic Lpin1 expression in db/db mice via an adenovirus system significantly improved glucose tolerance and insulin signaling in the liver.12) However, several contradicting bodies of evidence also demonstrated that the decrease in Lpin1 expression might contribute to hepatic insulin resistance in diet-induced obese rats,13) and that hepatic Lpin1 expression was diminished in a mouse model of obese insulin resistance (uncoupling protein 1 diphtheria toxin A (UCP-DTA) mice14)).6) Therefore, the pathophysiological implications of hepatic Lipin1 in development of insulin resistance and diabetes remains a highly controversial issue.
In our previous study, we reported that the expression of a monoacylglycerol O-acyltransferase 1 (Mogat1) gene encoding an enzyme involved in the synthesis and storage of TG, was significantly elevated in the livers of obese diabetic KKAy mice, and demonstrated that the knockdown of hepatic Mogat1 expression via a liver-specific in vivo short interfering RNA (siRNA) delivery system that was recently developed in our laboratory15,16) dramatically improved blood glucose levels and fatty livers in KKAy mice.17) We also found that, after intravenous (i.v.)-injection of siRNA-loaded lipid nanoparticles (LNPs), about 90% of the total injected dose had accumulated to liver.17) Thus, in the present study, using the liver-specific siRNA delivery system, we evaluated the physiological role of the hepatic Lpin1 gene in the development of insulin resistance through the regulation of fatty acid utilization.
MATERIALS AND METHODS
AnimalsKKAy and C57BL/6J mice were obtained from CLEA (Tokyo, Japan) and SLC (Shizuoka, Japan), respectively. All mice used in this study were males and were maintained on a 12-h light–dark cycle and fed standard rodent chow. Animal experiments involved standard procedures approved by the institutional animal care and research advisory committee of Hokkaido University, Sapporo, Japan.
siRNAsThe sequences of the sense and antisense strands of the siRNAs against Lpin1 (siLpin1) and Luciferase (siLuc) genes are as follows: siLpin1 sense, 5′-CUA AAG ACA CUG GUU GUU UdT dT-3′; antisense, 5′-AAA CAA CCA GUG UCU UUA GdT dT-3′; siLuc sense, 5′-GCG CUG CUG GUG CCA ACC CdT dT-3′; antisense, 5′-GGG UUG GCA CCA GCA GCG CdT dT-3′. The siLpin1 and siLuc were obtained from Hokkaido System Science (Sapporo, Japan).
ReagentsCholesterol (Chol) and 1,2-dimyristoyl-sn-glycerol, methoxypolyethylene glycol2000 (DMG-PEG2000) were purchased from Avanti Polar Lipids (Alabaster, AL, U.S.A.) and NOF (Tokyo, Japan), respectively.
RNA Extraction and Quantitative Reverse Transcription (RT)-PCRTotal RNA preparation and quantitative RT-PCR analyses were performed as described previously.17) The primer sequences utilized in this study are listed in Table S1.
Preparation of siRNA-Loaded Lipid Nanoparticles (LNPs)siLpin1 and siLuc-loaded LNPs were prepared as described previously.16,17) Briefly, 2100 nmol of YSK13, 900 nmol of Chol and 90 nmol of DMG-PEG2000 were dissolved in 400 µL of 90% (v/v) aqueous tertiary butanol (t-BuOH). One-hundred and sixty micrograms of siLpin1 and siLuc were dissolved in 200 µL of 20 mM citrate buffer (pH 4.0). Each siRNA solution (200 µL) was dropwisely added to the lipid solution (400 µL) under conditions of rapid vortex mixing in about 5 s, and then further vortex-mixed during 3 s. The siRNA–lipid mixtures (600 µL) were then added to 2 mL of 20 mM citrate buffer (pH 4.0) under vigorous mixing with a vortex device in about 10 s to spontaneously form homogenous siRNA-loaded LNPs. Immediately after that, the resulting mixture was diluted with 12 mL of PBS at pH 7.4, and then subjected to ultrafiltration using Vivaspin 20 ultrafiltration unit (Sartorius (Goettingen, Germany), MWCO: 100 kD) for removal of t-BuOH and neutralization of formulation buffer. The sizes and ζ-potentials of the LNPs were measured by dynamic light scattering on a Zetasizer Nano ZS ZEN3600 instrument (Malvern, Worchestershire, U.K.). The encapsulation efficiency and recovery ratio were determined using RiboGreen (Life Technologies, Carlsbad, CA, U.S.A.) as described previously.17) The physicochemical characteristics of the LNPs utilized in this study are summarized in Table S2.
Administration of siRNA-Loaded LNPs and Sample PreparationTo confirm the gene silencing effect of siRNA on hepatic Lpin1 expression, 5 week old male C57BL/6J mice were fasted for 6 h and then injected with siLpin1-LNPs via the tail vein at a dose of 0.3, 1 or 3 mg siRNA/kg body weight. For a negative control, 3 mg/kg of siLuc-LNPs was also intravenously injected. After administration, mice were allowed free access to a normal chow diet and water. At 18 h after injection, mice were fasted for 6 h again, and then killed under anesthesia. Liver and epididymal adipose tissue were removed from the mice and washed with Hank’s balanced salt solution (HBSS) (Wako Pure Chemical Industries, Ltd., Osaka, Japan). RNA extraction from tissue samples was performed as mentioned above.
In the case of pharmacological studies, 4 week old male C57BL/6J mice were treated with siLpin1- or siLuc-LNPs (2 mg/kg) at 3–4 d intervals for 25 d. Mouse body weight was measured immediately before siRNA administration. For the monitoring of blood parameters including glucose, total cholesterol, triglyceride and non-esterified fatty acid (NEFA), blood samples were collected from the 6 h fasted mice at days 0, 6, 13, 20 and 25. To minimize the variation of the blood parameters associated with the circadian rhythm, the blood samples were collected from each mouse at the same time of the day for all five time points for this study. At day 25 (2 d after last injection), the mice were killed under anesthesia, and the liver and adipose tissue were then collected for histological and biological analyses.
Determination of Blood Glucose LevelsBlood glucose levels were measured using an Accu-Check Compact Plus (Roche, Indianapolis, IN, U.S.A.).
Glucose Tolerance TestAt day 21, the mice were fasted for 6 h and then subcutaneously injected with a glucose solution (1.5 g/kg). The blood glucose levels were measured as described above at 0, 15, 30, 60 and 120 min after injection.
Measurement of Blood ParametersBlood samples taken from mice were placed in tubes containing heparin (final heparin concentration: 10 U/mL) and centrifuged at 1000×g, 4°C for 10 min. The plasma was collected for the determination of blood parameters. Plasma Chol, TG, NEFA, alanine aminotransferase (ALT) and asparatete aminotransferase (AST) values were measured using detection kits (Wako Pure Chemical Industries, Ltd.).
Quantification of Lipid Contents in the LiverLipid contents in the liver were measured as described previously.17) Briefly, liver tissue pieces were homogenized at 4°C in chroloform–methanol (2 : 1). Dilute sulfuric acid (0.05%) was added, and the resulting suspension was then vigorously vortexed and centrifuged at 600×g, 4°C for 10 min. The chloroform layer containing total lipid was evaporated to dryness and the pellet was dissolved in ethanol. The TG, Chol, and NEFA concentrations were determined as described above.
Confocal Observation of Adipose TissuesEpididymal and inguinal adipose tissues were collected from mice, washed with HBSS and then cut into small pieces. The tissue pieces were transferred to light protected tubes containing 2.5 µg/mL BODIPY 558/568 C12 (Life Technologies) for the fluorescent staining of fat droplets and incubated at room temperature for 30 min. After washing with HBSS, the pieces were observed by confocal laser-scanning microscopy (model A1, Nikon, Tokyo, Japan). Adipocyte size was determined as described previously.18)
Statistical AnalysisAll statistical analyses were performed by using the JMP12 software (SAS Institute, Cary, NC, U.S.A.). The paired t-test and one-way ANOVA followed by Dunnett’s test and Tukey–Kramer’s honestly significant difference (HSD) test were used to evaluate statistical significance. A p value of <0.05 was considered to be significant.
RESULTS
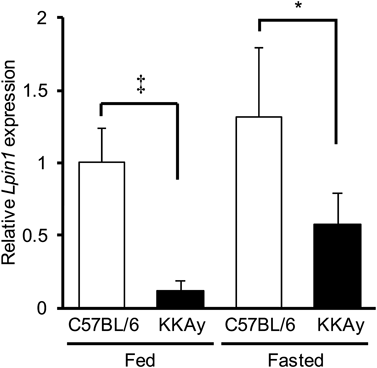
Hepatic Lpin1 Expression in Obese Diabetic KKAy Mice Is Significantly Lower Than That in Wild Type C57BL/6 MiceWe initially compared the expression levels of hepatic Lpin1 in obese diabetic KKAy and wild type C57BL/6J mice under both fed and fasted conditions by quantitative RT-PCR. Consistent with a previous report,5) hepatic Lpin1 expression levels in both strains were elevated as the result of fasting. Moreover, we found that, in obese diabetic KKAy mice, the hepatic Lpin1 expression levels were significantly lower than those in wild type mice in both fed and fasted conditions (Fig. 1). These results suggest that it is likely that the reduced expression of hepatic Lpin1 is associated with the development of obesity, insulin resistance and diabetes.
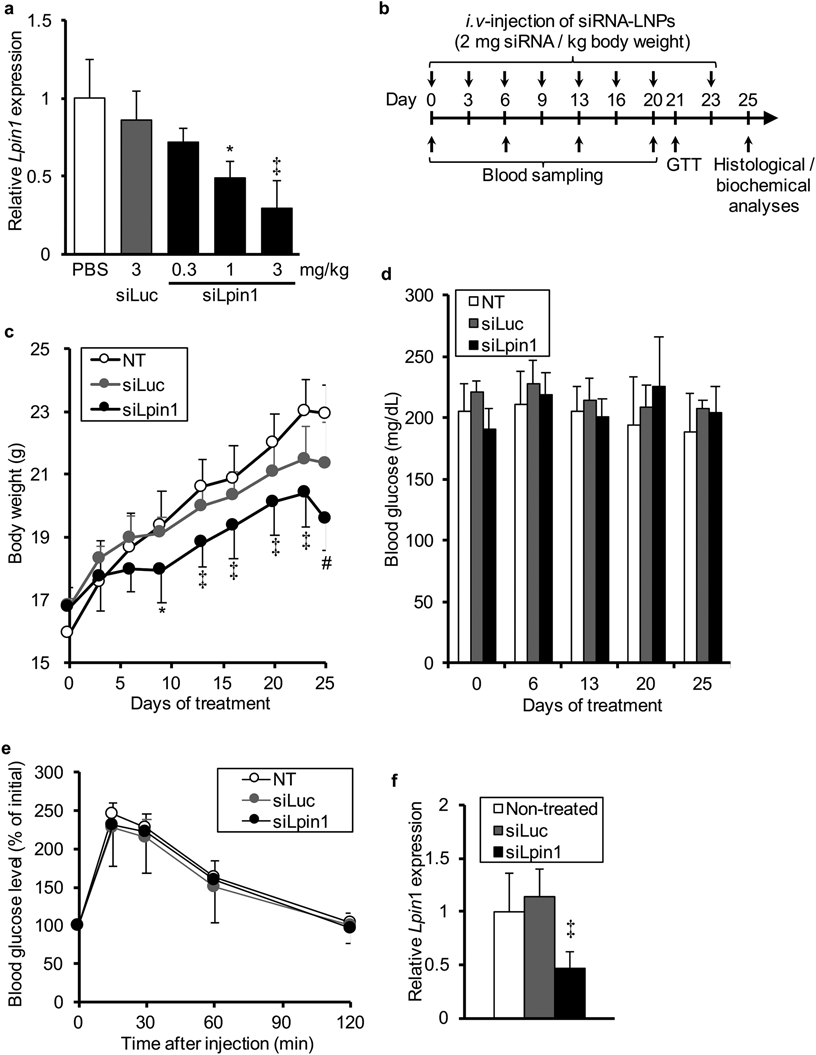
In Vivo Silencing of Hepatic Lpin1 Expression Decreases Body Weight Gain but Blood Glucose Levels and Insulin Sensitivity Are Not Altered in Wild Type MiceTo verify the above-mentioned possibility, we attempted to specifically silence Lpin1 expression in liver of C57BL/6 mice using an in vivo siRNA delivery system.15,17) The findings confirmed that hepatic Lpin1 expression was significantly suppressed by the systemic administration of siLpin1-loaded LNPs in a dose-dependent manner (0.3–3 mg/kg) (Fig. 2a).
To examine the contribution of the reduced expression of Lpin1 in the liver to the development of obesity and insulin resistance, we treated normal C57BL/6 mice with intravenous injections of siLpin1- or siLuc-loaded LNPs (2 mg/kg) at 3 or 4 d intervals for a total 25 d with the time schedule illustrated in Fig. 2b. During the siRNA treatment, we measured the body weight of each mouse immediately before every injection and found that body weight gain in siLpin1-treated mice was significantly lower than that in the other groups (Fig. 2c). In addition, we collected peripheral blood from each mouse at day 0, 6, 13, 20 and 25, and measured the fasting blood glucose levels. Blood glucose levels were not significantly altered by the siLpin1 treatment (Fig. 2d). Moreover, to evaluate the progression of insulin resistance by silencing hepatic Lpin1 expression, we also performed a glucose tolerance test at day 21. However, the changes in blood glucose levels after a subcutaneous injection of glucose solution (1.5 g/kg) were essentially the same among three groups (Fig. 2e). At day 25 (2 d after the last injection), we confirmed that hepatic Lpin1 expression in the siLpin1-treated mice was significantly lower than that in the non-treated controls, whereas it was not in the siLuc-treated group (Fig. 2f). These results indicate that the reduced hepatic Lpin1 expression may have a preventive role in obesity development rather than being responsible for the deterioration of insulin sensitivity.
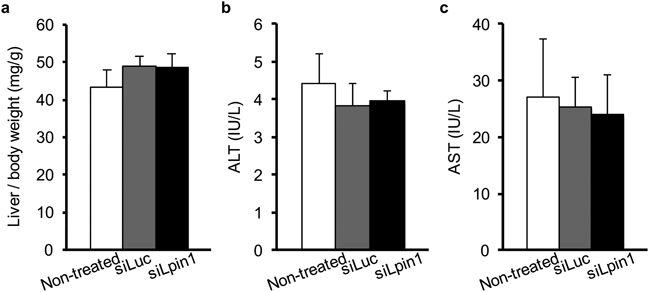
In Vivo Silencing of Hepatic Lpin1 Expression Reduced TG Biosynthesis in Normal MiceAfter 25 d of treatment, the values for the liver to body weight ratio were not significantly different among the three groups (Fig. 3a). Furthermore, the plasma ALT and AST levels were also not affected by the siRNA treatment (Figs. 3b, c). These results suggest that the decrease in body weight gain resulting from the siLpin1 treatment shown in Fig. 2c might not be due to the toxicity of siRNA-loaded LNPs in the liver.
Next, we quantified the plasma levels of total cholesterol, NEFA and TG during the treatment period. As a result, although no significant changes in plasma cholesterol and NEFA levels were observed (Figs. 4a, b), the plasma TG level in the siLpin1-treated mice was significantly lower than that in non-treated controls at days 13, 20 and 25 (Fig. 4c). In addition, the NEFA and TG levels in liver were also reduced by the siLpin1 treatment, while the total cholesterol in the liver was unchanged (Figs. 4d–f).
In addition, we also examined the expression levels of some genes that are involved in fatty acid and glucose metabolism. As a result, a significant reduction in Mogat1 expression was observed in liver of the siLpin1-treated mice (Fig. 5). Moreover, the differences in the Srebf1 expression were not statistically significant, but there was a tendency for the Srebf1 expression to be decreased in the siLpin1-treated group compared to non-treated controls (p=0.066). However, no significant changes were detected in the other genes involved in lipid metabolism (Ppara, Dgat2, Fasn, Acaca, Acadl, Cpt1a), microsomal TG transfer (Mttp) and glucose metabolism (Foxo1, Gck) (Fig. 5).
Collectively, these results indicate that the Lpin1 gene plays an important role in TG biosynthesis in the liver, resulting in the reduced plasma TG levels.
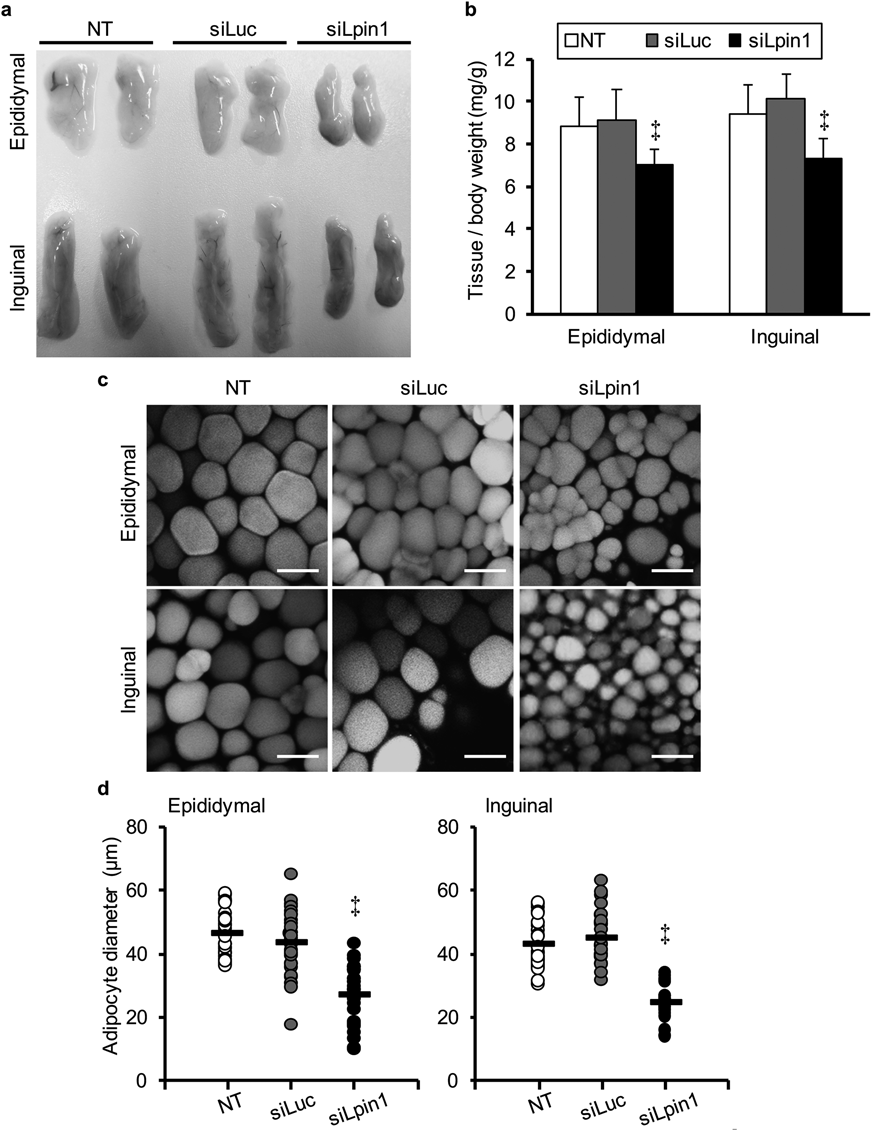
In Vivo Silencing of Hepatic Lpin1 Expression Results in a Decrease in Adipose Tissue Weight and Adipocyte DiameterAfter 25 d treatment, we collected epididymal and inguinal adipose tissues from each mouse and measured the tissue weight. A significant decrease in adipose tissue mass was found in the case of the siLpin1-treated mice, whereas this was not found in the siLuc-treated mice (Figs. 6a, b). In addition, confocal microscopy observations and image analyses revealed that the adipocyte diameters in the siLpin1-treated mice were also significantly reduced compared to the non-treated controls (Figs. 6c, d).
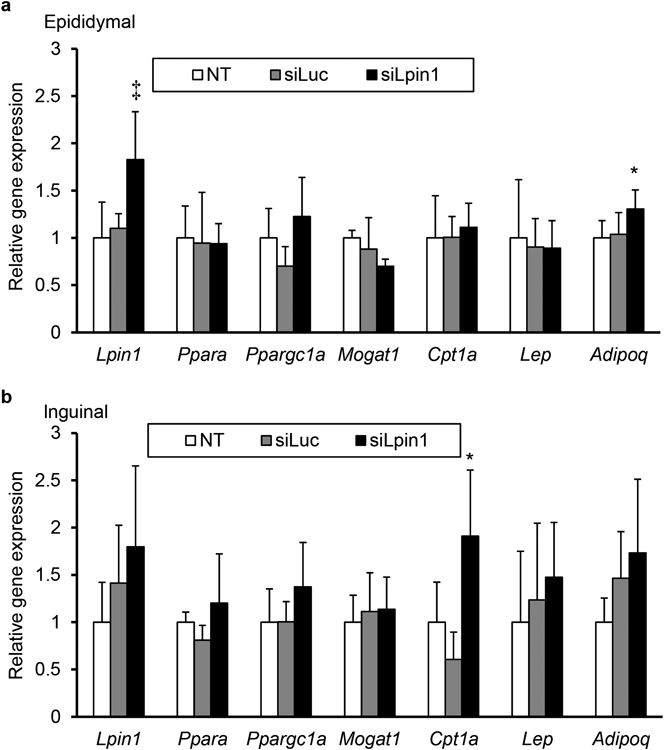
Moreover, as shown in Fig. 7, we found a significant elevation in Lpin1 expression in the epidymal adipose tissue of siLpin1-treated mice. In the inguinal adipose tissue, the differences in the Lpin1 expression were not statistically significant, but there was a tendency for the Lpin1 expression to be increased in the siLpin1-treated group compared to non-treated controls (p=0.092). These results strongly suggest that the systemically administered siLpin1-loaded LNPs did not act to adipose tissue.
DISCUSSION
Intracellular lipid accumulation in the liver is highly associated with hepatic insulin resistance and the onset of type2 diabetes.19–21) Lipin1 may have important roles in both fatty acid anabolism and catabolism through its bifunctional activities in the cytosol and nucleus, respectively.5–7) However, the pathophysiological role of hepatic Lipin1 in the development of insulin resistance is not fully understood. It was reported that hepatic Lpin1 expression in obese diabetic db/db mice is markedly elevated compared to control mice,5,12) and that the knockdown of hepatic Lipin1 in db/db mice significantly improved glucose tolerance and insulin signaling in the liver.12) On the contrary, it was recently reported that hepatic Lpin1 expression in obese insulin-resistant UCP-DTA mice was significantly diminished, and that the hepatic overexpression of Lipin1 in UCP-DTA mice suppressed the secretion of TG from the liver and improved hepatic insulin sensitivity.6) In addition, it was also demonstrated that hepatic Lipin1β expression was down-regulated in obese human subjects.22) In the current study, we found a significant deterioration in hepatic Lpin1 expression in obese diabetic KKAy mice compared to normal C57BL/6 ones (Fig. 1). However, we also found that the fasting blood glucose levels and systemic insulin sensitivity under conditions of a normal chow diet were not altered by hepatic Lpin1 silencing via liver-specific siRNA delivery in normal C57BL/6 mice (Figs. 2d, e). Therefore, a decrease in hepatic Lpin1 expression per se might not be directly associated with the development of systemic insulin resistance and diabetes. To date, there has been no report demonstrating that the liver-specific ablation of Lpin1 gene caused insulin resistance, although liver-specific Lpin1-deficient mice have been already generated23) and it was shown that a hepatic Lipin1 deficiency led to a marked degree of alcoholic fatty liver and hepatitis by feeding an ethanol-containing low-fat diet.24) Therefore, it is possible that the lower expression of hepatic Lpin1 in KKAy mice than that in normal ones might be attributed to a secondary and compensatory mechanism. However, the possibility that the decrease in hepatic Lpin1 expression may aggravate insulin resistance induced by obesity-associated conditions such as hyperphagia and a high-fat diet cannot be excluded, based on the findings reported herein. Further investigations still remain to address this issue.
We found that hepatic Lipin1 silencing led to a decrease in body weight gain in mice (Fig. 2c), consistent with observations in liver-specific Lipin1 knockout mice.24) However, our results demonstrate that the knockdown in hepatic Lipin1 diminished the levels of both TG and NEFA in the liver (Figs. 4e, f) whereas the genetic ablation of hepatic Lipin1 results in a significant increase in hepatic TG and fatty acid content.24) Similarly, our results demonstrated that the liver weight to body weight ratio and plasma ALT and AST levels were not significantly altered by the knockdown of hepatic Lipin1 (Fig. 3), whereas these values were elevated as the result of the knockout of hepatic Lipin1.24) In this study, we found that the expression of hepatic Lpin1 mRNA was reduced to 50–60% of the controls by the systemic administration of siLpin1 (Figs. 2a, f). Therefore, the Lipin1-associated metabolic and transcriptional activities might be, at least partially, functional in the livers of siLpin1-treated mice, whereas it appears to be completely impaired in the liver of hepatic Lipin1 knockout mice. While this might be attributed to the phenotypic differences alluded to above, further investigations such as examination of the dose-dependent study in siLpin1-treated mice will be needed to confirm this.
Moreover, a significant decrease in hepatic Mogat1 expression was observed in the siLpin1-treated mice (Fig. 5). The MOGAT1 enzyme is involved in an alternative pathway for TG biosynthesis, whereas Lipin1 functions as a key enzyme for generating TG through the principal pathway.25) Therefore, the reduced expression of hepatic Mogat1 in addition to Lpin1 in siLpin1-treated mice is likely to contribute to the significant decrease in TG content in the liver. There is no report demonstrating that Lipin1 directly regulates the expression of the Mogat1 gene, however, it has been previously reported that Lipin1 functions as a key regulator of PPARγ as well as PPARα.26) Furthermore, it is also known that Mogat1 is a direct target for PPARγ.27) Therefore, it is possible that the siRNA-mediated silencing of hepatic Lpin1 led to the deterioration of Mogat1 expression through the deactivation of PPARγ. Furthermore, a tendency to decrease in the expression of Srebf1 gene, a key regulator of lipogenesis, was also found in liver of siLpin1-treated mice (Fig. 5). It is also possible that the reduction in hepatic Srebf1 expression leads to a decline in lipid biosynthesis. However, further investigations still remain to elucidate the mechanisms for the regulation of Srebf1 expression by Lipin1 in liver.
A more intriguing finding in this study was that the liver-specific knockdown of Lpin1 expression drastically reduced the size of adipose tissue, the adipose tissue weight to bodyweight ratio and adipocyte diameter in both epididymal and inguinal fat depots (Fig. 6). Recent studies have demonstrated that the adipose tissue mass to body weight ratio is markedly diminished in adipocyte-specific Lipin1-deficient mice.23,28) However, since the expression levels of Lpin1 mRNA in adipose tissue were increased in the siLpin1-treated mice (Fig. 7), the reduction of adipose tissue mass would not be due to undesired action of siLpin1 to adipose tissue. It is supported by our previous report that, after i.v.-injection of siRNA-loaded LNPs, almost 90% of the total injected dose had accumulated to liver.17) In order to clarify the mechanisms for less adiposity caused by the hepatic Lpin1 silencing, more detailed evaluation with regard to food intake and energy consumption would be an issue to be addressed in the future.
In conclusion, using a liver-specific in vivo siRNA delivery system, we demonstrated, for the first time, that the down-regulation of hepatic Lipin1 expression leads to a reduced fat accumulation in adipose tissue as well as a decrease in TG level in the liver and blood circulation, without any alterations in the glucose tolerance and blood glucose levels. Our findings provide new insights into the physiological roles of hepatic Lipin1 in systemic energy homeostasis, and suggest that the moderate inactivation of hepatic Lipin1 represents a promising approach for preventing the development of obesity.
Acknowledgments
This work was partially supported by Grants from the Special Education and Research Expenses of the Ministry of Education, Culture, Sports, Science and Technology (MEXT) of Japan, by Grants from the Initiative for Accelerating Regulatory Science in Innovative Drug, Medical Device and Regenerative Medicine of the Ministry of Health, Labour and Welfare (MHLW) of Japan, and by a Grant-in-Aid for Scientific Research (B) (Grant Number 26282132) from the Japan Society for the Promotion of Science (JSPS). Finally, the authors thank Dr. M. S. Feather for his helpful advice in writing the English manuscript.
Conflict of Interest
The authors declare no conflict of interest.
Supplementary Materials
The online version of this article contains supplementary materials.
REFERENCES
- 1) Péterfy M, Phan J, Xu P, Reue K. Lipodystrophy in the fld mouse results from mutation of a new gene encoding a nuclear protein, lipin. Nat. Genet., 27, 121–124 (2001).
- 2) Reue K, Xu P, Wang XP, Slavin BG. Adipose tissue deficiency, glucose intolerance, and increased atherosclerosis result from mutation in the mouse fatty liver dystrophy (fld) gene. J. Lipid Res., 41, 1067–1076 (2000).
- 3) Langner CA, Birkenmeier EH, Benzeev O, Schotz MC, Sweet HO, Davisson MT, Gordon JI. The fatty liver dystrophy (Fld) mutation—a new mutant mouse with a developmental abnormality in triglyceride-metabolism and associated tissue-specific defects in lipoprotein–lipase and hepatic lipase activities. J. Biol. Chem., 264, 7994–8003 (1989).
- 4) Phan J, Reue K. Lipin, a lipodystrophy and obesity gene. Cell Metab., 1, 73–83 (2005).
- 5) Finck BN, Gropler MC, Chen Z, Leone TC, Croce MA, Harris TE, Lawrence JC Jr, Kelly DP. Lipin 1 is an inducible amplifier of the hepatic PGC-1alpha/PPARalpha regulatory pathway. Cell Metab., 4, 199–210 (2006).
- 6) Chen Z, Gropler MC, Norris J, Lawrence JC Jr, Harris TE, Finck BN. Alterations in hepatic metabolism in fld mice reveal a role for lipin 1 in regulating VLDL-triacylglyceride secretion. Arterioscler. Thromb. Vasc. Biol., 28, 1738–1744 (2008).
- 7) Khalil MB, Sundaram M, Zhang HY, Links PH, Raven JF, Manmontri B, Sariahmetoglu M, Tran K, Reue K, Brindley DN, Yao Z. The level and compartmentalization of phosphatidate phosphatase-1 (lipin-1) control the assembly and secretion of hepatic VLDL. J. Lipid Res., 50, 47–58 (2009).
- 8) Samuel VT, Liu ZX, Qu X, Elder BD, Bilz S, Befroy D, Romanelli AJ, Shulman GI. Mechanism of hepatic insulin resistance in non-alcoholic fatty liver disease. J. Biol. Chem., 279, 32345–32353 (2004).
- 9) Samuel VT, Liu ZX, Wang A, Beddow SA, Geisler JG, Kahn M, Zhang XM, Monia BP, Bhanot S, Shulman GI. Inhibition of protein kinase Cepsilon prevents hepatic insulin resistance in nonalcoholic fatty liver disease. J. Clin. Invest., 117, 739–745 (2007).
- 10) Erion DM, Shulman GI. Diacylglycerol-mediated insulin resistance. Nat. Med., 16, 400–402 (2010).
- 11) Savage DB, Petersen KF, Shulman GI. Disordered lipid metabolism and the pathogenesis of insulin resistance. Physiol. Rev., 87, 507–520 (2007).
- 12) Ryu D, Oh KJ, Jo HY, Hedrick S, Kim YN, Hwang YJ, Park TS, Han JS, Choi CS, Montminy M, Koo SH. TORC2 regulates hepatic insulin signaling via a mammalian phosphatidic acid phosphatase, LIPIN1. Cell Metab., 9, 240–251 (2009).
- 13) Chen SH, Zhuang XH, Liu YT, Sun AL, Chen CR. Expression and significance of lipin1 and AMPKalpha in hepatic insulin resistance in diet-induced insulin resistance rats. Exp. Clin. Endocrinol. Diabetes, 120, 84–88 (2012).
- 14) Lowell BB, S-Susulic V, Hamann A, Lawitts JA, Himms-Hagen J, Boyer BB, Kozak LP, Flier JS. Development of obesity in transgenic mice after genetic ablation of brown adipose tissue. Nature, 366, 740–742 (1993).
- 15) Sato Y, Hatakeyama H, Sakurai Y, Hyodo M, Akita H, Harashima H. A pH-sensitive cationic lipid facilitates the delivery of liposomal siRNA and gene silencing activity in vitro and in vivo. J. Control. Release, 163, 267–276 (2012).
- 16) Yamamoto N, Sato Y, Munakata T, Kakuni M, Tateno C, Sanada T, Hirata Y, Murakami S, Tanaka Y, Chayama K, Hatakeyama H, Hyodo M, Harashima H, Kohara M. Novel pH-sensitive multifunctional envelope-type nanodevice for siRNA-based treatments for chronic HBV infection. J. Hepatol., 64, 547–555 (2016).
- 17) Hayashi Y, Suemitsu E, Kajimoto K, Sato Y, Akhter A, Sakurai Y, Hatakeyama H, Hyodo M, Kaji N, Baba Y, Harashima H. Hepatic monoacylglycerol O-acyltransferase 1 as a promising therapeutic target for steatosis, obesity, and type 2 diabetes. Mol. Ther. Nucleic Acids, 3, e154 (2014).
- 18) Hossen N, Kajimoto K, Akita H, Hyodo M, Harashima H. A comparative study between nanoparticle-targeted therapeutics and bioconjugates as obesity medication. J. Control. Release, 171, 104–112 (2013).
- 19) Birkenfeld AL, Shulman GI. Nonalcoholic fatty liver disease, hepatic insulin resistance, and type 2 diabetes. Hepatology, 59, 713–723 (2014).
- 20) Cusi K. Role of obesity and lipotoxicity in the development of nonalcoholic steatohepatitis: pathophysiology and clinical implications. Gastroenterology, 142, 711–725.e6 (2012).
- 21) Jornayvaz FR, Shulman GI. Diacylglycerol activation of protein kinase Cepsilon and hepatic insulin resistance. Cell Metab., 15, 574–584 (2012).
- 22) Croce MA, Eagon JC, LaRiviere LL, Korenblat KM, Klein S, Finck BN. Hepatic lipin 1beta expression is diminished in insulin-resistant obese subjects and is reactivated by marked weight loss. Diabetes, 56, 2395–2399 (2007).
- 23) Mitra MS, Chen Z, Ren H, Harris TE, Chambers KT, Hall AM, Nadra K, Klein S, Chrast R, Su X, Morris AJ, Finck BN. Mice with an adipocyte-specific lipin 1 separation-of-function allele reveal unexpected roles for phosphatidic acid in metabolic regulation. Proc. Natl. Acad. Sci. U.S.A., 110, 642–647 (2013).
- 24) Hu M, Yin H, Mitra MS, Liang X, Ajmo JM, Nadra K, Chrast R, Finck BN, You M. Hepatic-specific lipin-1 deficiency exacerbates experimental alcohol-induced steatohepatitis in mice. Hepatology, 58, 1953–1963 (2013).
- 25) Hall AM, Kou K, Chen Z, Pietka TA, Kumar M, Korenblat KM, Lee K, Ahn K, Fabbrini E, Klein S, Goodwin B, Finck BN. Evidence for regulated monoacylglycerol acyltransferase expression and activity in human liver. J. Lipid Res., 53, 990–999 (2012).
- 26) Kim HE, Bae E, Jeong DY, Kim MJ, Jin WJ, Park SW, Han GS, Carman GM, Koh E, Kim KS. Lipin1 regulates PPARgamma transcriptional activity. Biochem. J., 453, 49–60 (2013).
- 27) Lee YJ, Ko EH, Kim JE, Kim E, Lee H, Choi H, Yu JH, Kim HJ, Seong JK, Kim KS, Kim JW. Nuclear receptor PPARgamma-regulated monoacylglycerol O-acyltransferase 1 (MGAT1) expression is responsible for the lipid accumulation in diet-induced hepatic steatosis. Proc. Natl. Acad. Sci. U.S.A., 109, 13656–13661 (2012).
- 28) Nadra K, Medard JJ, Mul JD, Han GS, Gres S, Pende M, Metzger D, Chambon P, Cuppen E, Saulnier-Blache JS, Carman GM, Desvergne B, Chrast R. Cell autonomous lipin 1 function is essential for development and maintenance of white and brown adipose tissue. Mol. Cell. Biol., 32, 4794–4810 (2012).