Abstract
A dual readout assay based on fluorescence polarization (FP) and time-resolved fluorescence resonance energy transfer (TR-FRET) exhibits many advantages over single assay technology in terms of screening quality and efficiency. In this study, we developed a dual readout assay combining FP and TR-FRET to identify ribosomal S6 kinase 1 (RSK1) inhibitors. This dual readout assay can monitor both FP and TR-FRET signals from a single RSK1 kinase reaction by using the immobilized metal affinity for phosphochemical (IMAP)-based assay. The Z′ value and signal to background (S/B) ratio were 0.85 and 4.0 using FP, and 0.79 and 10.6 using TR-FRET, which led to performance of a pilot library screening against the drug repositioning set consisting of 2320 compounds with a reasonable reproducibility. From this screening, we identified 16 compounds showing greater than 50% inhibition against RSK1 for both FP and TR-FRET; 6 compounds with greater than 50% inhibition only for FP; and 4 compounds with greater than 50% inhibition only for TR-FRET. In a cell-based functional assay to validate the hit compounds, 10 compounds identified only in a single assay had little effect on the RSK-mediated phosphorylation of liver kinase B1, whereas 5 compounds showing greater than 80% inhibition for both FP and TR-FRET reduced the phosphorylation of liver kinase B1. These results demonstrate that the dual readout assay can be used to identify hit compounds by subsequently monitoring both FP and TR-FRET signals from one RSK1 reaction.
The 90-kDa ribosomal S6 kinase (RSK), a member of a subfamily of mitogen-activated protein kinase-activated protein kinase (MAPKAPK), plays an important role in cellular proliferation, survival, and differentiation through several extracellular signals or mitogen stimulation.1) The RSK family consists of three principal subtypes (RSK1–3), which share 75–80% amino acid identity.2) All subtypes are downstream substrates of extracellular signal-regulated kinases (ERKs) and sodium-hydrogen exchanger (NHE) kinases.3) Recently, RSK4, which is functionally distinct from other RSKs, was identified as another subtype.4) RSK is considered to be an attractive pharmaceutical target for cardiovascular diseases, as the activation of RSK as NHE kinases is involved in cardiac pathology.5,6)
Over longer periods, NHE is considered to be a therapeutic target for treating cardiovascular disease because NHE activation induces Ca2+ overload, leading to cardiac hypertrophy.7) However, in recent clinical studies, the development of most NHE inhibitors was suspended because NHE intrinsic activity was not maintained at intracellular pH levels.8) Thus, phosphorylation of NHE by RSK rather than direct NHE inhibition has been considered as a potential therapeutic target for cardiovascular diseases.9)
Various kinase detection formats have been developed for high throughput screening (HTS) to identify RSK inhibitors.10,11) Fluorescence-based biochemical assays such as fluorescence polarization (FP) and time-resolved fluorescence resonance energy transfer (TR-FRET) are widely used to screen compound libraries for drug discovery because these methods are homogenous, sensitive, and convenient.12,13) Despite their popularity in HTS, all single assays using tagged-fluorescein are vulnerable to interference from the intrinsic fluorescence of compounds or from scattering light. Thus, a dual readout assay was recently introduced as an improved method that can minimize the detection of false–positive errors and increase the hit quality in HTS by enabling subsequent monitoring of two different signals from one reaction.14) To evaluate the usefulness of the dual readout assay, we established an RSK1-dual readout assay combining FP and TR-FRET using the immobilized metal affinity for phosphochemicals (IMAP)-based assay system. Typically, this format employs lanthanide-labeled nanoparticles that interact non-specifically with a phosphor-substrate.15) The interaction between the phosphor-substrate and nanoparticle can be easily detected as FP signals as well as TR-FRET signals. Thus, the aims of this study were; 1) to establish a dual readout assay to monitor both FP and TR-FRET signals from one RSK1 kinase reaction, 2) to perform pilot library screening using the drug repositioning set, and 3) to validate format-specific artifacts and real hits of RSK1 inhibitors.
MATERIALS AND METHODS
MaterialsHuman RSK1 was obtained from Life Technologies (Invitrogen, Carlsbad, CA, U.S.A.). Two fluorescent-tagged substrates including FAM-S6 ribosomal protein-derived substrate (5FAM-AKRRRLSSLRA-COOH) and FAM-S6 ribosomal protein-derived phosphor-substrate (5FAM-AKRRRL-pS-pS-LRA-COOH) as well as the IMAP assay Kit were purchased from MDS Analytical Technologies (Sunnyvale, CA, U.S.A.). BI-D 1870, a reference compound for RSK1 inhibition, was obtained from Calbiochem (Billerica, MA, U.S.A.). The rabbit polyclonal antibodies against phosphorylated liver kinase B1 (LCK1) and β-actin were purchased from Cell Signaling Technology (Danvers, MA, U.S.A.). All other reagents including ATP, dithiothreitol (DTT), dimethyl sulfoxide (DMSO), MgCl2, NaN3, and phorbol myristate acetate (PMA) were purchased from Sigma-Aldrich (St. Louis, MO, U.S.A.). The drug repositioning set consisting of 2320 compounds was obtained from MicroSource Discovery Systems, Inc. (Gaylordsville, CT, U.S.A.).
Dual Readout AssayA dual readout assay monitoring both FP and TR-FRET signals was performed in black 384-well plates (Cat#3573, Corning, NY, U.S.A.). RSK1, fluorescein-tagged S6 ribosomal protein-derived substrate (5FAM-AKRRRLSSLRA-COOH), and ATP were diluted in kinase reaction buffer (10 mM Tris–HCl, pH 7.2, 10 mM MgCl2, 0.05% NaN3, 0.01% Tween-20, and 1 mM DTT). The RSK1 kinase assay was performed with 3.0 nM RSK1, 0.2 µM substrate, and 10 µM ATP in a total assay volume of 20 µL. Compounds (10 µM) were preincubated with RSK1 for 10 min before the kinase reactions for 30 min. After incubating the 60 µL detection mixture containing IMAP binding reagent (1 : 600 dilution) and Terbium donor (1 : 400 dilution) for 3 h, the FP and TR-FRET signals were measured from same plate using an Envision (PerkinElmer, Inc., Waltham, MA, U.S.A.), a multilabel plate reader with FP and TR-FRET readout options. The percent inhibition and inhibitory concentration of 50% (IC50) values were calculated based on the measured mili-polarization (mP) values and TR-FRET counts.
In FP mode, the interaction between phosphor-substrate and terbium-labeled nanoparticles induced slow rotation of the fluorescein-tagged substrate, generating an FP signal upon excitation by polarized light. The instrument settings were 480 nm for excitation, 535 nm for dual emission (p and s), and 535 nm for the dual-dichroic mirror. The FP signal was expressed as mP units and defined by the equation, mP=([S−G×P]/[S+G×P])×1000, where S and P are the fluorescence intensities parallel and perpendicular with respect to the plane of linearly polarized excitation light, respectively. The G factor was 1.0, which is the recommended value for the Envision Multilabel plate reader.16)
In the TR-FRET mode, the binding of fluorescein-tagged phosphor-substrate and terbium-labeled nanoparticles can evoke an FRET signals from terbium to fluorescein. After FP measurement, TR-FRET signals were measured for the same plate. The TR-FRET modes were set to a 100-µs delay time, 340 nm for excitation, and 520 nm and 495 nm for emission. The TR-FRET counts were expressed as the emission ratio of fluorescein (520 nm) divided by terbium (495 nm).
High-Throughput Screening PerformanceTo evaluate the performance of high-throughput screening based on the dual readout assay, we screened a drug repositioning chemical library at a drug concentration of 10 µM. The drug repositioning set was composed of a small compound (n=2320) with known structures and pharmacologic activity (spectrum-2320, MicroSource). To dispense the reagents, including RSK1, fluorescein-tagged S6 ribosomal peptide, ATP, and IMAP beads, a Deerac GX8 system (Labcyte Inc., Dublin, Ireland) was used. After primary screening in a single-point format, compounds showing greater than 50% inhibition of the maximum signal were selected as hits. The hit compounds were reconfirmed in triplicate experiments using the same cut-off applied in the primary screening.
Cell Culture and ImmunoblottingHEK293 cells, obtained from the American Type Culture Collection (ATCC; Manassas, VA, U.S.A.), were cultured at 37°C in Dulbecco’s modified Eagle’s medium (DMEM) supplemented with 10% fetal bovine serum, 100 IU/mL penicillin G, 100 µg/mL streptomycin, and 2 mM L-glutamine in a humidified incubator with 5% CO2 and 95% air. Stock solutions of compounds were prepared in DMSO, with a final DMSO concentration of 0.1%. HEK293 cells were cultured in 6-well plates for immunoblotting and used at passages P3–15.
After starvation in serum-free media for 3 h, HEK293 cells were incubated with or without 10 µM hit compounds for 2 h and then stimulated with 400 ng/mL PMA for 15 min. After washing with ice-cold phosphate-buffered saline, the cells were lysed for immunoblotting to determine the phosphorylation levels of LCK1. Equal amounts of protein from each sample were separated by 10% sodium dodecyl sulfate (SDS)-polyacrylamide gel electrophoresis (PAGE) and electro-transferred onto nitrocellulose membranes. After probing the blots with primary antibodies against phosphorylated LCK1 and β-actin and secondary antibodies, immunoreactive bands were detected using the LumiGLO kit (New England Biolabs, Ipswich, MA, U.S.A.). The results of Western blots were quantified by means of Scion Image (version 4.02 beta; Scion Corporation, Frederick, MD, U.S.A.).
Statistical AnalysisUnless otherwise indicated, the data in the graphs correspond to the average of the FP and TR-FRET signals and the bars represent the standard deviation (S.D.) of triplicate measurements. IC50 values were calculated from the signal intensities using the sigmoidal dose–response equation for nonlinear regression analysis in PRISM version 5.0 (GraphPad Software Inc., San Diego, CA, U.S.A.). The Michaelis–Menten equation, y=Vmax×X/(Km+X), was used to determine the Vmax and Km parameters. To determine the quality and suitability of the dual readout assay, Z′ factor and signal-to-background (S/B) ratio were calculated for both FP and TR-FRET measurement based on the following equation: Z′ factor=1−([3×SDc+]+[3×SDc−])/(meanc+−meanc−) and S/B ratio=meanc+/meanc−. Percent inhibition was determined using the equation: ([raw data of compound−meanc−]/[meanc+−meanc−])×100. SDc+ and SDc− are the standard deviations of the positive and negative control signals, defined in the absence of inhibitor and enzyme, respectively. Meanc+ and meanc− are denoted for the means of the positive and negative control signals, respectively. All values are expressed as the mean±S.D. Data were analyzed by one-way ANOVA, followed by Dunnett’s test for multiple comparisons (Sigma Stat; Jandel Co., San Rafael, CA, U.S.A.).
RESULTS AND DISCUSSION
Development of Dual Readout AssayThe most important point in the development of a dual readout assay is optimizing the concentration of the various reagents included in the RSK1 kinase reaction for subsequent monitoring of both the FP and TR-FRET signals in the same plates. Thus, we first determined the optimal substrate concentration by titrating of the FAM-S6 ribosomal protein-derived phosphor-substrate as a tracer. In the FP measurement, a tracer concentration that is too low results in higher variation in the mP value because of instrument sensitivity, whereas a concentration that is too high requires high levels of binding molecules. As shown in Fig. 1A, there was no significant variation in the mP values when the FAM-S6 ribosomal protein-derived phosphor-substrate concentration was greater than 0.01 µM. However, when the concentration was greater than 0.3 µM, the mP value was saturated to the maximum detection limit. To determine the optimal concentration of substrate for the TR-FRET measurement, titration of the phosphor-substrate was performed with terbium-labeled nanoparticles. The phosphor-substrate caused an increase of up to 48000 TR-FRET counts with a Kd value of 0.24±0.04 µM (Fig. 1B). Thus, based on the titration curves of the substrate, 0.2 µM FAM-S6 ribosomal protein-derived substrate was chosen for further evaluation.
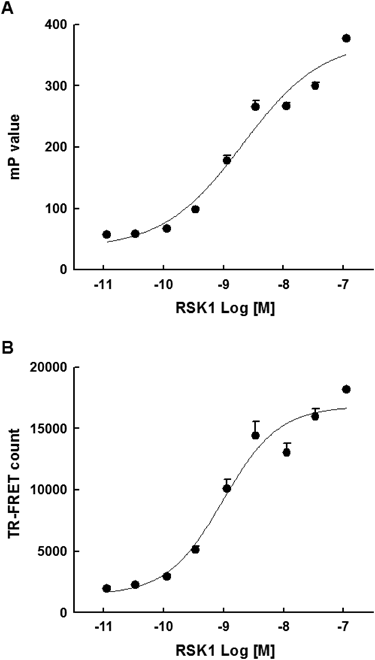
To determine the appropriate concentration of RSK1 for the dual readout assay, RSK1 was titrated into 0.2 µM substrate and 100 µM ATP. Both the FP and TR-FRET signals were measured in one RSK1 kinase reaction. The enzyme reaction showed a sigmoidal concentration response with effective concentration of 50% (EC50) values of 2.04±0.9 and 1.13±0.3 nM for the FP and TR-FRET readouts, respectively (Fig. 2). The further dual readout assay was conducted with 3.0 nM RSK1 to increase the assay window; this concentration generated the highest S/B ratios with 5.3 and 7.3 for FP and TR-FRET measurements, respectively.
To define the balanced kinase condition, we next determined the optimal reaction time and concentration of ATP in the presence of 0.2 µM FAM-S6 ribosomal protein-derived substrate and 3.0 nM RSK1. At all selected concentrations, enzyme activity showed a linear increase for up to 30 min, followed by a slower rate over the next 3 h for both FP and TR-FRET measurements (Figs. 3A, B). The amounts of phosphor-substrate determined based on the FP and TR-FRET counts measured at 0, 15, and 30 min. The initial velocity of the RSK1 reaction was calculated as amount of phosphor-substrate divided by the reaction time (nM/min). In the FP readout, the apparent Km value for ATP was 9.7±1.8 µM (Fig. 3C). In the TR-FRET readout from same plate after FP readout, the apparent Km value for ATP was 2.1±0.6 µM (Fig. 3D). The amounts of phosphor-substrate were converted from mP value or TR-FRET counts based on standard curve using the FAM-S6 ribosomal protein-derived phosphor-substrate (calibrator). As shown in Figs. 3E and F, mP value or TR-FRET counts showed a linear increase for up to 200 nM of phosphor-substrate. The equations of standard curve were mP value=1.16(p-S)+63.1 and TR-FRET counts=64586(p-S)+3648, respectively. The correlation coefficient (R2) are 0.99, 0.97 for this range, respectively.
Since ATP concentration is one of key parameters in applying dual readout assay format to HTS, the distribution of S/B was measured in various ATP concentrations (0.1 to 100 µM). The S/B ratio was used to estimate the quality of the assay by separating the positive and negative control data. In the FP measurement, the average of S/B ratios were 1.5, 2.4, 3.6, 5.0, and 5.2 at 1, 3, 10, 30, and 100 µM of ATP, respectively (Fig. 4A). In the TR-FRET measurement using the same reaction plate after the FP readout, the S/B ratios were 3.7, 6.5, 9.1, 10.3, and 6.2, respectively (Fig. 4B). Therefore, the S/B ratios greater than 3 were obtained using 10 µM ATP in both the FP and TR-FRET measurements and thus this ATP concentration was selected for further analysis. This condition was validated using a known RSK inhibitor, BI-D1870, in the presence of 0.2 µM FAM-S6 ribosomal protein-derived substrate, 3.0 nM RSK1, and 10 µM ATP for a reaction time of 30 min. Interestingly, the dual readout assay including BI-D1870 produced similar IC50 values between the FP and TR-FRET measurements, with values of 46 and 61 nM, respectively (Fig. 5). The IC50 values of BI-D1870 in the present study were very similar to those from the protein kinase assay of Boehringer Ingelheim (31 nM),17) indicating that the results of the dual readout assay were comparable to those of conventional methods. The quality of dual readout assay was assessed by determining the Z′ factor in the presence of 0.2 µM FAM-S6 ribosomal protein-derived substrate, 3.0 nM RSK1, and 10 µM ATP for 30 min. Generally, a Z′ factor >0.5 indicates that the assay is appropriate for use in HTS.18) The Z′ factors for both the FP and TR-FRET measurements were 0.85 and 0.79, respectively (Fig. 6). These results suggest that dual readout assay can be applied in a HTS with high sensitivity and reproducibility.
Screening of Chemical Library for the RSK1 InhibitorsTo test the reliability of the dual readout assay, pilot library screening of a drug repositioning set consisting of 2320 compounds (Spectrum-2320) was conducted at a concentration of 10 µM with 2.5% DMSO. In the FP readout, 22 hit compounds were identified with a hit cut-off of 50% inhibition compared to the maximum signal obtained in the absence of inhibitor addition. In the TR-FRET readout from the same reaction plates after the FP readout, 20 hit compounds were identified under the same cut-off condition. Hit information from the dual readout assay in the pilot library screening is summarized in Table 1 and Fig. 7.
Table 1. The List of 26 Chemical Hits Identified by a Dual Readout Assay
| Chemical name | % Inhibition at 10 µM in FP | % Inhibition at 10 µM in TR-FRET |
|---|
| Hexachlorophene | 101.7 | 97.4 |
| Closantel | 96.8 | 95.1 |
| Evans blue | 97.9 | 80.3 |
| Ellagic acid | 82.2 | 88.7 |
| Protoporphyrin IX | 81.9 | 78.9 |
| Chlorophyllide Cu complex | 77.0 | 80.3 |
| Alexidine hydrochloride | 72.2 | 74.1 |
| Thonzonium bromide | 72.2 | 67.4 |
| Bithionate sodium | 71.6 | 68.2 |
| Cetylpyridinium chloride | 63.9 | 60.9 |
| R(−) Apomorphine hydrochloride hemihydrate | 61.2 | 56.3 |
| Tigecycline | 61.2 | 72.7 |
| Luteolin | 60.8 | 73.8 |
| Apomorphine hydrochloride | 58.3 | 52.7 |
| Entacapone | 54.0 | 54.4 |
| Epirubicin hydrochloride | 54.9 | 53.8 |
| Acriflavinium hydrochloridea) | 126.1 | 0.0 |
| Fluoresceina) | 128.8 | 0.0 |
| Merbromina) | 126.1 | 0.0 |
| Proflavine hemisulfatea) | 127.4 | 34.2 |
| Riboflavina) | 128.8 | 0.0 |
| Riboflavin 5-phosphate sodiuma) | 127.4 | 0.0 |
| Balsalazide disodiumb) | 36.0 | 59.1 |
| Erythrosine sodiumb) | 10.8 | 82.9 |
| Olsalazine sodiumb) | 21.0 | 61.6 |
| Tannic acidb) | 0.0 | 101.7 |
a) The compounds were identified as hit compound only in the FP assay. b) The compounds were identified as hit compound only in the TR-FRET assay.
Sixteen hit compounds including protoporphyrin IX, hexachlorophene, closantel, Evans blue, and ellagic acid showed greater than 50% inhibition in both FP and TR-FRET readouts. Six compounds including acriflavinium hydrochloride, fluorescein, merbromin, proflavine hemisulfate, riboflavin, and riboflavin 5-phosphate sodium were identified as hit compounds only in the FP assay. These compounds exhibited approximately 100% inhibition in the FP measurements, whereas they showed 0–30% inhibition in the TR-FRET measurements. In contrast, four compounds including balsalazide disodium, erythrosine sodium, olsalazine sodium, and tannic acid were identified as hit compound only in the TR-FRET assay. These compounds exhibited greater than 60% inhibition in the TR-FRET measurements, whereas they showed below 30% inhibition in the FP measurements.
Functional Validation of Hit Compounds as the RSK1 InhibitorsTo examine whether the hits interference with the assay by quenching the FP and TR-FRET signals, we performed a cell-based assay rather than a non-fluorescence based assay. In the cell-based assay, we evaluated the effect of hit compounds on RSK-induced phosphorylation of liver kinase B1 (LKB1), a known RSK substrate, in HEK293 cells. Based on a previous report,17) RSK-mediated LKB1 phosphorylation in the cells was evoked by treatment with 400 ng/mL PMA for 15 min. The band intensities of p-LKB1 in the pretreated group with five compounds such as protoporphyrin IX, hexachlorophene, closantel, Evans blue, and ellagic acid which showed greater than 80% inhibition in both the FP and TR-FRET readout, were lower than those in the vehicle-treated group. Particularly, preincubation with protoporphyrin IX, hexachlorophene, closnatel, and Evans blue significantly reduced the RSK-induced phosphorylation of LKB1 (Fig. 8A). However, four compounds identified as hit compounds only in the TR-FRET assay (balsalazide disodium, erythrosine sodium, olsalazine sodium and tannic acid) and six compounds identified as hit compounds only in the FP assay (acriflavinium hydrochloride, fluorescein, merbromin, proflavine hemisulfate, riboflavin and riboflavin 5-phosphate sodium) had little effect on the RSK1-midiated phosphorylation of LKB1 (Figs. 8B, C). These results of the cell-based functional assay strongly indicate that these 10 compounds identified as positive only in the FP or the TR-FRET assay were false–positives.
As shown in Fig. 9, four compounds identified as hit compounds only in the TR-FRET assay (balsalazide disodium, erythrosine sodium, olsalazine sodium and tannic acid) and six compounds identified as hit compounds only in the FP assay (acriflavinium hydrochloride, fluorescein, merbromin, proflavine hemisulfate, riboflavin and riboflavin 5-phosphate sodium) have organic fluorophores which have intrinsic fluorescence or fluorescence-quenching properties at the wavelengths employed in either assay. Particularly, the xanthene structure of mebromin, fluorescein, erythrosine and the acridine structure of acriflavinium, proflavine, and the flavin structure of riboflavin, riboflavin 5-phosphate sodium are used as common structures in versatile fluorescence dyes and these structures possess quenching property in specific wavelength.19–21) Balsalazide and olsalazine also share the same azo-bond which is used as dyes.
CONCLUSION
We examined the usefulness of a dual readout assay combining the FP and TR-FRET assays into one platform to screen for RSK1 inhibitors. This dual readout assay can exclude false–positive errors, which were identified as positive signals only in a single assay. At a reduced time and cost, this dual readout assay can identify hit compounds with high quality by monitoring both the FP and TR-FRET signals in one RSK1 kinase reaction.
Acknowledgments
This study was supported by a Grant of the Technology Innovation Program (10038744), Ministry of Knowledge Economy and by the Bio & Medical Technology Development Program (2014-M3A9A9073788) of the National Research Foundation (NRF). The chemical library used in this study was kindly provided by Korea Chemical Bank of Korea Research Institute of Chemical Technology.
Conflict of Interest
The authors declare no conflict of interest.
REFERENCES
- 1) Carriere A, Ray H, Blenis J, Roux PP. The RSK factors of activating the Ras/MAPK signaling cascade. Front. Biosci., 13, 4258–4275 (2008).
- 2) Frödin M, Gammeltoft S. Role and regulation of 90 kDa ribosomal S6 kinase (RSK) in signal transduction. Mol. Cell. Endocrinol., 151, 65–77 (1999).
- 3) Takahashi E, Abe J, Gallis B, Aebersold R, Spring DJ, Krebs EG, Berk BC. p90 (RSK) is a serum-stimulated Na+/H+ exchanger isoform-1 kinase. Regulatory phosphorylation of serine 703 of Na+/H+ exchanger isoform-1. J. Biol. Chem., 274, 20206–20214 (1999).
- 4) Myers AP, Corson LB, Rossant J, Baker JC. Characterization of mouse Rsk4 as an inhibitor of fibroblast growth factor-RAS-extracellular signal-regulated kinase signaling. Mol. Cell. Biol., 24, 4255–4266 (2004).
- 5) Maekawa N, Abe J, Shishido T, Itoh S, Ding B, Sharma VK, Sheu SS, Blaxall BC, Berk BC. Inhibiting p90 ribosomal S6 kinase prevents (Na+)-H+ exchanger-mediated cardiac ischemia–reperfusion injury. Circulation, 113, 2516–2523 (2006).
- 6) Lucien F, Brochu-Gaudreau K, Arsenault D, Harper K, Dubois CM. Hypoxia-induced invadopodia formation involves activation of NHE-1 by the p90 ribosomal S6 kinase (p90RSK). PLoS ONE, 6, e28851 (2011).
- 7) Nakamura TY, Iwata Y, Arai Y, Komamura K, Wakabayashi S. Activation of Na+/H+ exchanger 1 is sufficient to generate Ca2+ signals that induce cardiac hypertrophy and heart failure. Circ. Res., 103, 891–899 (2008).
- 8) Karmazyn M, Sawyer M, Fliegel L. The Na(+)/H(+) exchanger: a target for cardiac therapeutic intervention. Curr. Drug Targets Cardiovasc. Haematol. Disord., 5, 323–335 (2005).
- 9) Avkiran M, Cook AR, Cuello F. Targeting Na+/H+ exchanger regulation for cardiac protection: a RSKy approach? Curr. Opin. Pharmacol., 8, 133–140 (2008).
- 10) Rodems SM, Hamman BD, Lin C, Zhao J, Shah S, Heidary D, Makings L, Stack JH, Pollok BA. A FRET-based assay platform for ultra-high density drug screening of protein kinases and phosphatases. Assay Drug Dev. Technol., 1, 9–19 (2002).
- 11) Rose R, Rose M, Ottmann C. Identification and structural characterization of two 14-3-3 binding sites in the human peptidylarginine deiminase type VI. J. Struct. Biol., 180, 65–72 (2012).
- 12) Horton RA, Vogel KW. Multiplexing terbium- and europium-based TR-FRET readouts to increase kinase assay capacity. J. Biomol. Screen., 15, 1008–1015 (2010).
- 13) Gaudet EA, Huang KS, Zhang Y, Huang W, Mark D, Sportsman JR. A homogeneous fluorescence polarization assay adaptable for a range of protein serine/threonine and tyrosine kinases. J. Biomol. Screen., 8, 164–175 (2003).
- 14) Du Y, Nikolovska-Coleska Z, Qui M, Li L, Lewis I, Dingledine R, Stuckey JA, Krajewski K, Roller PP, Wang S, Fu H. A dual-readout F2 assay that combines fluorescence resonance energy transfer and fluorescence polarization for monitoring bimolecular interactions. Assay Drug Dev. Technol., 9, 382–393 (2011).
- 15) Sharlow ER, Leimgruber S, Yellow-Duke A, Barrett R, Wang QJ, Lazo JS. Development, validation and implementation of immobilized metal affinity for phosphochemicals (IMAP)-based high-throughput screening assays for low-molecular-weight compound libraries. Nat. Protoc., 3, 1350–1363 (2008).
- 16) Rajkowski KM, Cittanova N. Corrected equations for the calculation of protein–ligand binding results from fluorescence polarization data. J. Theor. Biol., 93, 691–696 (1981).
- 17) Sapkota GP, Cummings L, Newell FS, Armstrong C, Bain J, Frodin M, Grauert M, Hoffmann M, Schnapp G, Steegmaier M, Cohen P, Alessi DRBI-D. 1870 is a specific inhibitor of the p90 RSK (ribosomal S6 kinase) isoforms in vitro and in vivo. Biochem. J., 401, 29–38 (2007).
- 18) Zhang JH, Chung TD, Oldenburg KR. A simple statistical parameter for use in evaluation and validation of high throughput screening assays. J. Biomol. Screen., 4, 67–73 (1999).
- 19) Gerasimova MA, Sizykh AG, Slyusareva EA. The role of energy transfer in bioluminescence quenching by xanthene dyes. J. Photochem. Photobiol. B, 97, 117–122 (2009).
- 20) Liu SP, Sa C, Hu XL, Kong L. Fluorescence quenching method for the determination of sodium carboxymethyl cellulose with acridine yellow or acridine orange. Spectrochim. Acta A Mol. Biomol. Spectrosc., 64, 817–822 (2006).
- 21) Penzkofer A, Bansal AK, Song SH, Dick B. Fluorescence quenching of flavins by reductive agents. Chem. Phys., 336, 14–21 (2007).