Abstract
Cyclosporine (CSA), which is one of the substrates of ATP binding cassette subfamily B member 1 (ABCB1), is widely used as an immunosuppressant in patients undergoing transplantation. The expression level of P-glycoprotein on lymphocytes that is encoded by ABCB1 gene is considered to be one of the major causes of differences in intracellular CSA concentration. The clinical relevance of ABCB1 mRNA expression in peripheral blood was analyzed. We examined (i) the relationship between ABCB1 mRNA and the intracellular concentration of CSA in vitro, (ii) the change in long-term ABCB1 mRNA expression levels, and (iii) its association with acute rejection (AR) or cytomegalovirus (CMV) reactivation in living-donor renal transplantation. A significantly negative correlation between ABCB1 mRNA expression and intracellular CSA concentration in vitro was obtained (p<0.05). ABCB1 mRNA expression was significantly reduced (55%) 1 week after transplantation (p<0.001) and returned to the pre-transplantation level after 1 year. Although the sample size may be too small to obtain a definitive conclusion, no association was observed between ABCB1 mRNA expression levels and AR or CMV reactivation.
P-Glycoprotein (P-gp) is encoded by the ATP binding cassette subfamily B member 1 (ABCB1, also known as multidrug resistance protein 1 (MDR1)) gene. This membrane protein functions as an energy-dependent drug efflux pump and reduces the intracellular concentrations of a wide range of drugs. P-gp was first identified as a surface phosphoglycoprotein expressed in drug resistant tumor cells, and its expression has been correlated with failed chemotherapeutic treatment and poor prognosis.1,2) It is also known that P-gp expression is commonly increased after chemotherapy.3–5) Subsequently, P-gp expression has been described in a variety of other normal cells and its expressing cells such as lymphocytes, the primary target of immunosuppressive agents, may show limited intracellular accumulation of these agents.6,7) Cyclosporine (CSA), which is one of the substrates of P-gp, is widely used as an immunosuppressant in patients undergoing organ and bone-marrow transplantation, and the site of action for CSA is mainly CD4+ T-lymphocytes. In a previous study, intracellular CSA T-lymphocyte concentration was reported to be associated with the incidence of acute rejection in kidney transplant recipients, although there was no difference between patients experiencing rejection and rejection-free patients with respect to CSA C2-levels and dose.8) Although the detailed mechanism has yet to be elucidated, it has been suggested that P-gp expression on lymphocytes might be responsible for the differences in intracellular CSA concentrations.
To our knowledge, few studies have sequentially investigated the effect of CSA treatment on P-gp expression on lymphocytes, and the relationship between P-gp expression and the response to immunosuppressive therapy (e.g. rejection, infection, and toxicity) in renal transplant recipients.9–12)
In the present study, we examined the relationship between ABCB1 mRNA expression and intracellular CSA concentration in vitro, the association between ABCB1 mRNA levels in peripheral blood before and after transplantation, and clinical outcomes such as acute rejection (AR) and cytomegalovirus (CMV) reactivation in living-donor renal transplantation.
MATERIALS AND METHODS
Healthy Volunteers and Kidney Transplant RecipientsPeripheral blood samples from 11 healthy volunteers (27 to 55 years; 6 males/5 females) and 34 kidney transplant recipients were collected and analyzed in this study. Seven healthy volunteers (A to G) participated in the intra-individual variation study (within a day (Fig. 1A; A, B, C, D), between days (Fig. 1B; C, D, E, F, G) and between months (Fig. 1C; D, E, G)). Another four healthy volunteers and two of seven volunteers (A, B) participated in the in vitro study as shown in Fig. 2. Peripheral blood samples from healthy volunteers (between days and months) were collected from 13:00 to 17:00.
All transplantations were performed from February 2007 to December 2009. This study was approved by the Institutional Ethics Committee of Nagoya University School of Medicine and by the Institutional Review Board of Nagoya Daini Red Cross Hospital in accordance with current standards for human research. Written informed consent was obtained from all the recipients before inclusion in this study.
Sample ProcessingPreliminary study indicated that ABCB1 mRNA levels (ratio of β-actin) were maintained at 98.9% (n=4) within 3 h after blood collection (39.0% (n=4), 6 h after blood collection). According to the study, heparinized peripheral whole blood samples collected from healthy volunteers and recipients were processed within 3 h after blood withdrawal according to the protocol of RNA extraction.
RNA Isolation and ABCB1 mRNA Assay in Peripheral Blood CellsTotal RNA was extracted from 1 mL of peripheral whole blood using a QIAamp RNA Blood Mini Kit (Qiagen K.K., Tokyo, Japan) according to the manufacturer’s instructions. RNA samples were reverse transcribed to complementary DNA using a high-capacity complementary DNA Reverse Transcript Kit (Multi-Scribe reverse transcriptase, random primers) (Applied Biosystems, Nagoya, Japan), and stored at −30°C until use. Quantitative real-time RT-PCR was performed using SYBR Green amplification in a Mx3000P quantitative PCR system (Stratagene, La Jolla, CA, U.S.A.). PCR primers were as follows: ABCB1: 5′-CTG CTT GAT GGC AAA GAA ATA AAG-3′ for forward primer, 5′-GGC TGT TGT CTC CAT AGG CAA T-3′ for reverse primer, and β-actin: 5′-TCA AGA TCA TTG CTC CTC CTG AG-3′ for forward primer, and 5′-GAC AGC GAG GCC AGG ATG-3′ for reverse primer. Samples were assayed in a 20 µL reaction mixture containing cDNA and 200 nM each of the primer using SYBR premix Ex taq (TaKaRa Bio, Inc., Shiga, Japan). Real-time PCR assay was performed under the following conditions: 10 s at 95°C for primary denature, 40 cycles for 5 s at 95°C and 20 s at 60°C, and finally for 1 min at 95°C, 30 s at 60°C, and 30 s at 95°C for dissociation curve. All reactions were performed in duplicate. The level of ABCB1 mRNA expression was normalized to the β-actin mRNA, using the comparative CT method for relative quantitation as described in detail elsewhere.13)
Intracellular CSA ConcentrationIn the in vitro study, a total 9 mL of heparinized whole blood samples was collected from six healthy volunteers (27 to 55 years; 4 males/2 females). The blood was incubated for 2 h at 37°C with CSA (final concentration: 2000 ng/mL) in 14 mL polypropylene tubes (Becton-Deckinson, Franklin Lake, NJ, U.S.A.). Final CSA concentration was determined by considering the detection lower limit of the analysis. Peripheral blood mononuclear cells (PBMC) were obtained from whole blood using Ficoll–Conray methods. PBMC were washed with phosphate buffered saline, adjusted to 5.0×10⁷ cells/mL, and stored at −80°C until use.
CSA concentration in PBMC was analyzed using a chemiluminescent immunoassay (CLIA) with an ARCHITECT analyzer (Abbot Laboratories Chicago, IL, U.S.A.), and calculated using the calibration curve for exclusive use. The calibration curve was linear within the concentration range 5–1000 ng/5.0×107cells (r2=0.98, p<0.01).
Immunosuppressive Protocol and Clinical OutcomeThirty-four recipients (25 to 73 years; 18 males/16 females) were examined for peripheral blood ABCB1 mRNA expression at pre- and post-transplantation (1 week, 1 months, 2 months, 3 months, 6 months, and 1 year later). All transplant recipients received 500 mg of methylprednisolone intravenously before reperfusion of the graft, and received 20 mg of basiliximab intravenously on days 0 and 4. Oral immunosuppressive agents consisted of CSA, mycophenolate mofetil (MMF), and prednisolone. The loading dose of CSA (8 mg/kg/d) was started on day-2. The dosage was strictly adjusted every week to the target level of the area under the blood concentration–time curve from 0 to 4 h (AUC0–4) (3500 ng×h/mL for CSA). Blood samples for monitoring drug concentrations were collected just before administration, and 1, 2, 3, and 4 h after administration. AUC0–4 was calculated by the trapezoidal rule. MMF was given at a dosage of 2.5 to 3 g/d from day 0 and reduced to 1.5 to 2 g/d from day 14. Prednisolone was tapered down from 60 mg/d on day 0 to 10 mg/d on day 19, and maintained at 7.5 mg/d from 3 months after transplantation. No recipients received anti-thymocyte globulin. Additional treatment with plasmapheresis and splenectomy or anti-CD20 monoclonal antibody was given to patients with ABO-incompatible transplantation.
We evaluated the association between clinical events and ABCB1mRNA expression, at pre- and post-transplantation. AR and CMV reactivation (Table 1) was evaluated as follows. Protocol biopsy was conducted 3 weeks, 6 months, and 1 year after transplantation. Only biopsy-proven AR was considered. CMV reactivation was defined as over 10 of 150000 for CMV antigenemia test.
Table 1. Patient Demographic Data Regarding Acute Rejection (AR) and CMV Reactivation
| AR (−) | AR (+) | CMV (−) | CMV (+) |
|---|
| n | 29 | 5 | 26 | 8 |
| BW (kg) | 55.4±12.1 | 63.1±10.1 | 54.2±11.4 | 61.8±12.8 |
| CSA dose (mg/kg) | | | | |
| 1 week | 8.42±0.35 | 8.26±0.23 | 8.38±0.32 | 8.42±0.37 |
| AUC0–4 (ng/mL) | | | | |
| 1 week | 4839.9±983.5 | 4662.7±656.7 | 4936.3±867.3 | 4479.1±1015.9 |
| 1 year | 1815.7±447.0 | 2037.8±129.2 | 1825.1±427.0 | 1951.3±379.3 |
| Acute rejection | | | | |
| Biopsy (3W/6M/1Y) | — | 0/5/0 | | |
| CMV infection | | | | |
| Reactivation (median day) | | | — | 63 |
| Range (day) | | | — | 6–281 |
All data are presented as the mean±standard deviation (S.D.) or box plot. Box plots represent the 25th and 75th percentiles; whiskers, the 10th and 90th percentiles; and the solid line within the box, the 50th percentile. Comparison of ABCB1 mRNA expression among groups was assessed by the Kruskal–Wallis test followed by Dunn’s multiple comparison, or paired or unpaired t-test. The correlations were analyzed using Pearson’s correlation coefficient test. p Values less than 0.05 were considered statistically significant.
RESULTS
Variation of ABCB1 mRNA Expression in Healthy VolunteersPrevious studies have reported that the P-gp expression in animal intestine shows a circadian rhythm which follows the chrono-pharmacokinetic profiles of many drugs.14) Based on this, we confirmed the intra-individual variation in the ABCB1 mRNA expression of peripheral blood collected from healthy volunteers within a day, between days, and after 6 months, (Fig. 1A; 6:00, 12:00, 18:00, n=4, Fig. 1B; 0, 3, 6 d, n=5, Fig. 1C; 0, 6 months, n=3). ABCB1 mRNA expression levels did not show any significant difference between samples at intervals of 6 h, 12 h, 3 d, 6 d, and 6 months.
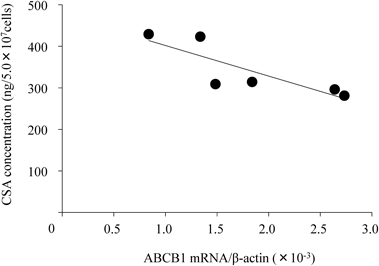
Correlation between ABCB1 mRNA Expression and CSA Concentration in PBMCTo examine whether P-gp expression could influence the accumulation of CSA in PBMC, ABCB1 mRNA expression levels were compared with CSA concentration. After a 2 h incubation of whole blood samples with CSA (final concentration was 2000 ng/mL), CSA concentration in PBMC was examined using 6 healthy volunteers. As shown in Fig. 2, ABCB1 mRNA expression was inversely correlated with the intracellular CSA concentration (r=−0.84, p<0.05).
Comparison of ABCB1 mRNA Expression in Healthy Volunteers and RecipientsABCB1 mRNA expression in peripheral blood obtained from healthy volunteers and recipients before transplantation was compared. There were no differences in ABCB1 mRNA expression between healthy volunteers (1.8±1.2×10⁻³/β-actin, n=11) and recipients (1.5±1.1×10⁻³/β-actin, n=34) (p=0.42), although large coefficients of variance were observed in both recipients (72%) and in healthy volunteers (70%).
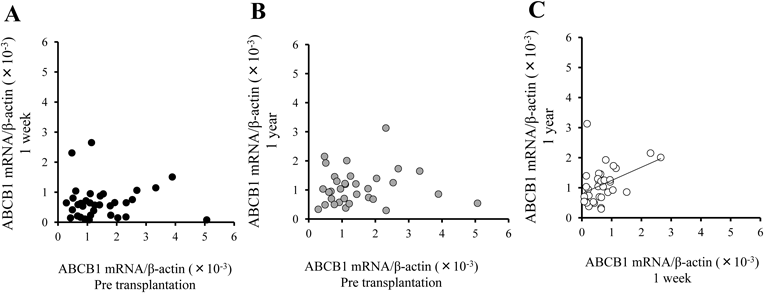
Changes in ABCB1 mRNA Expressions before and after TransplantationFigure 3 shows the changes in ABCB1 mRNA expression in peripheral blood of recipients before and after transplantation (n=34). The expression was significantly reduced (55%) 1 week after transplantation (p<0.001). After the transplantation, ABCB1 mRNA expression gradually increased and returned to the pre-transplantation level at 1 year (p<0.05). As shown in Figs. 4A and B, there were no relationships between ABCB1 mRNA expression at pre-transplantation and 1 week after transplantation (p=0.97) or 1 year after transplantation (p=0.78). On the other hand, a weak but statistically significant correlation was observed between 1 week after transplantation and 1 year post-transplantation (Fig. 4C, r=0.42, p<0.05).
Association between ABCB1 mRNA Expression Level and Clinical OutcomeFive patients developed biopsy-proven AR (Banff IIA) within 6 months, and 8 patients showed CMV reactivation within 3 months after transplantation. The median day of occurrence of CMV reactivation was 63 d (range: 6 to 281) after transplantation (Table 1). No significant differences in ABCB1 mRNA expression levels were observed between patients with AR and without AR (pre-transplantation levels with AR; 1.6±1.4×10⁻³/β-actin, n=5, without AR; 1.5±1.0×10⁻³/β-actin, n=29, p=0.74, 1 week post-transplantation levels with AR; 0.7±0.5×10⁻³/β-actin, n=5, without AR; 0.7±0.6×10⁻³/β-actin, n=29, p=0.95). No significant differences were also observed between patients with CMV reactivation and without CMV reactivation (pre-transplantation levels with CMV; 1.4±1.2×10⁻³/β-actin, n=8, without CMV; 1.5±1.0×10⁻³/β-actin, n=26, p=0.86, 1 week post-transplantation levels with CMV; 0.7±0.5×10⁻³/β-actin, n=8, without CMV; 0.7±0.6×10⁻³/β-actin, n=26, p=0.97)
DISCUSSION
Whole blood, which we used to extract ABCB1 mRNA in this study, includes T-cells, B-cells, natural killer (NK) cells, monocytes and granulocytes, although the site of action for CSA is mainly CD4+ T-cells. Previous studies reported that P-gp was expressed in the order of CD56+ (NK) cells>CD8+ (T-suppressor) cells>CD4+ (T-helper) cells>CD19+ (B-cells)>CD14+ (monocytes) and CD15+ (granulocyte) cells.15) The ABCB1 mRNA expression in this study may not directly reflect the expression on T-helper cells which are the target cells of CSA. However, the absolute CD4+ T-cell counts in whole blood are higher than in any other lymphocyte subsets, and the percentage of NK cells that have the highest expression of P-gp is only about half that of CD4+ cells.16) Taking these previous reports into account, ABCB1 mRNA expression in whole blood could reflect the expression in the CD4+ T-cells.
A considerable inter-individual variation was revealed in ABCB1 mRNA expression, and a significantly negative relation was obtained between ABCB1 mRNA expression and intracellular CSA concentration (Fig. 2). The intracellular CSA concentration at the lowest ABCB1 mRNA expression (429 ng/5.0×107 cells) was 1.5-fold higher than the highest expression (281 ng/5.0×107 cells) in the healthy volunteers. Since such a difference could not be disregarded, CSA monitoring using whole blood might still be inadequate, as was previously reported.8) The measurement of lymphocyte CSA concentration would be very impractical because a large amount of whole blood (about 10 mL) would be required. Analysis of ABCB1 mRNA can be performed quickly and less invasively than through direct measurement of the lymphocyte concentration.
ABCB1 mRNA expression was significantly reduced 1 week after transplantation, and since then the median value of each box plot gradually returned to the pre-transplantation level (Fig. 3). A similar result was obtained by Grudé et al.17) in PBMC after liver transplantation. They speculated that this fall was induced by the high doses of corticosteroids used after transplantation. Concerning the effect of CSA on the P-gp expression, Tsujimura et al.18) reported that CSA inhibits P-gp expression by suppression of interleukin-2 (IL-2), which induces translocation of Y-box-binding protein-1, a specific transcription factor for ABCB1 gene, from the cytoplasm into the nucleus of lymphocytes. This group recently reported the same inhibitory effect on P-gp expression with tacrolimus in a dose-dependent manner in vitro.19) Just after transplantation, high dose immunosuppressive agents were given to prevent AR. CSA, methylprednisolone and prednisolone are known to inhibit IL-2 production in a dose-dependent manner.20,21) Inhibition of IL-2 production by these agents may cause P-gp reduction in the early post-transplantation period. This low expression of P-gp soon after transplantation could prevent AR because of the low CSA transport from the lymphocytes.
In contrast to reports concerning tumor cells and hematological malignancies, previous reports on the role of P-gp expression in resistance to immunosuppressive therapy are not consistent. A few indicated that an increased incidence of AR was found among patients exhibiting higher levels of P-gp in PBMC among kidney and liver transplant recipients.17,22) On the other hand, no differences were found in P-gp expression between patients with and without AR.23,24) In this study, there was no difference in ABCB1 mRNA expression between those with and without AR before and after transplantation, a finding that did not correspond to previous reports. This inconsistency might be ascribed to the different immunosuppressive protocols used after the transplantation. Previous studies include a liver transplantation patient treated with an immunosuppressive regimen without antimetabolite, and a kidney transplantation patient treated with low-dose MMF, unlike our study (1 to 2 g/d vs. 2.5 to 3 g/d). Furthermore, since other immunosuppressive agents such as basiliximab (antibody to the IL-2 receptor), MMF and prednisolone were routinely added to the calcineurin inhibitors, the value of CSA needed to prevent AR might have been diminished.
In theory, low expression of ABCB1 mRNA leads to the accumulation of CSA in lymphocytes, resulting in over-immunosuppression, which may increase the risk of infection. However, ABCB1 mRNA expression levels in recipients with CMV reactivation were found to not differ significantly from recipients without CMV reactivation. A previous report showed that ABCB1 mRNA expression was significantly lower in recipients with severe infection.17) These conflicting results might be attributable to the difference between cause and effect. We have other causes for the clinical outcome, such as rejection and infection aside from the drug concentration in the lymphocytes. Our previous study indicated that CSA and prednisolone had considerable inter-individual variation in their inhibitory effects on T-cell proliferation.25) A more recent study demonstrated that CMV reactivation and acute T-cell mediated rejection were significantly associated with the CSA sensitivity of lymphocytes.26) These studies suggested that not only the drug concentration in lymphocytes, but also the drug sensitivity affecting lymphocyte proliferation could influence the clinical outcome.
CONCLUSION
A significantly negative relation was obtained between ABCB1 mRNA expression and intracellular CSA concentration in vitro. Its expression was significantly reduced 1 week after renal transplantation, and since then the value gradually returned to the pre-transplantation level. Although a considerable inter-individual variation was observed in ABCB1 mRNA expression, no association was observed between ABCB1 mRNA expression levels and AR or CMV reactivation. This study with a small sample size did not validate the clinical benefit of ABCB1 mRNA analysis.
Acknowledgments
This work was partly supported by a CPCF2011 Research Grant, a Grant from the Aichi Kidney Foundation, and a Grant-in-Aid for Scientific Research (No. 2529335) from the Japan Society for the Promotion of Science (KAKENHI).
Conflict of Interest
Kenta Iwasaki belongs to an endowed chair of the Department of Kidney Disease and Transplant Immunology, Aichi Medical University School of Medicine, which is supported by Chugai Pharmaceutical Co., Ltd. However, no support has been provided relevant to the present study.
REFERENCES
- 1) Gottesman MM, Fojo T, Bates SE. Multidrug resistance in cancer: role of ATP-dependent transporters. Nat. Rev. Cancer, 2, 48–58 (2002).
- 2) Tan B, Piwnica-Worms D, Ratner L. Multidrug resistance transporters and modulation. Curr. Opin. Oncol., 12, 450–458 (2000).
- 3) Trock BJ, Leonessa F, Clarke R. Multidrug resistance in breast cancer: a meta-analysis of MDR1/gp170 expression and its possible functional significance. J. Natl. Cancer Inst., 89, 917–931 (1997).
- 4) Tada Y, Wada M, Migita T, Nagayama J, Hinoshita E, Mochida Y, Maehara Y, Tsuneyoshi M, Kuwano M, Naito S. Increased expression of multidrug resistance-associated proteins in bladder cancer during clinical course and drug resistance to doxorubicin. Int. J. Cancer, 98, 630–635 (2002).
- 5) Wang YC, Juric D, Francisco B, Yu RX, Duran GE, Chen GK, Chen X, Sikic BI. Regional activation of chromosomal arm 7q with and without gene amplification in taxane-selected human ovarian cancer cell lines. Genes Chromosomes Cancer, 45, 365–374 (2006).
- 6) Elliott JI, Raguz S, Higgins CF. Multidrug transporter activity in lymphocytes. Br. J. Pharmacol., 143, 899–907 (2004).
- 7) Moon YJ, Zhang S, Morris ME. Real-time quantitative polymerase chain reaction for BCRP, MDR1, and MRP1 mRNA levels in lymphocytes and monocytes. Acta Haematol., 118, 169–175 (2007).
- 8) Falck P, Asberg A, Guldseth H, Bremer S, Akhlaghi F, Reubsaet JL, Pfeffer P, Hartmann A, Midtvedt K. Declining intracellular T-lymphocyte concentration of cyclosporine a precedes acute rejection in kidney transplant recipients. Transplantation, 85, 179–184 (2008).
- 9) Götzl M, Wallner J, Gsur A, Zöchbauer S, Kovarik J, Balcke P, Pirker R. MDR1 gene expression in lymphocytes of patients with renal transplants. Nephron, 69, 277–280 (1995).
- 10) Donnenberg VS, Burckart GJ, Zeevi A, Griffith BP, Iacono A, McCurry KR, Wilson JW, Donnenberg AD. P-glycoprotein activity is decreased in CD4+ but not CD8+ lung allograft-infiltrating T cells during acute cellular rejection. Transplantation, 77, 1699–1706 (2004).
- 11) Meaden ER, Hoggard PG, Khoo SH, Back DJ. Determination of P-gp and MRP1 expression and function in peripheral blood mononuclear cells in vivo. J. Immunol. Methods, 262, 159–165 (2002).
- 12) Parasrampuria DA, Lantz MV, Birnbaum JL, Vincenti FG, Benet LZ. Effect of calcineurin inhibitor therapy on P-gp expression and function in lymphocytes of renal transplant patients: A preliminary evaluation. J. Clin. Pharmacol., 42, 304–311 (2002).
- 13) Livak KJ, Schmittgen TD. Analysis of relative gene expression data using real-time quantitative PCR and 2−ΔΔCT method. Methods, 25, 402–408 (2001).
- 14) Okyar A, Dressler C, Hanafy A, Baktir G, Lemmer B, Spahn-Langguth H. Circadian variations in exsorptive transport: in situ intestinal perfusion data and in vivo relevance. Chronobiol. Int., 29, 443–453 (2012).
- 15) Klimecki WT, Futscher BW, Grogan TM, Dalton WS. P-glycoprotein expression and function in circulating blood cells from normal volunteers. Blood, 83, 2451–2458 (1994).
- 16) Chng WJ, Tan GB, Kuperan P. Establishment of adult peripheral blood lymphocyte subset reference range for an Asian population by single-platform flow cytometry: influence of age, sex, and race and comparison with other published studies. Clin. Diagn. Lab. Immunol., 11, 168–173 (2004).
- 17) Grudé P, Boleslawski E, Conti F, Chouzenoux S, Calmus Y. MDR1 gene expression in peripheral blood mononuclear cells after liver transplantation. Transplantation, 73, 1824–1828 (2002).
- 18) Tsujimura S, Saito K, Nakayamada S, Nakano K, Tsukada J, Kohno K, Tanaka Y. Transcriptional regulation of multidrug resistance-1 gene by interleukin-2 in lymphocytes. Genes Cells, 9, 1265–1273 (2004).
- 19) Suzuki K, Saito K, Tsujimura S, Nakayamada S, Yamaoka K, Sawamukai N, Iwata S, Nawata M, Nakano K, Tanaka Y. Tacrolimus, a calcineurin inhibitor, overcomes treatment unresponsiveness mediated by P-glycoprotein on lymphocytes in refractory rheumatoid arthritis. J. Rheumatol., 37, 512–520 (2010).
- 20) Stein CM, Murray JJ, Wood AJ. Inhibition of stimulated interleukin-2 production in whole blood: a practical measure of cyclosporine effect. Clin. Chem., 45, 1477–1484 (1999).
- 21) Hodge S, Hodge G, Flower R, Han P. Methyl-prednisolone up-regulates monocyte interleukin-10 production in stimulated whole blood. Scand. J. Immunol., 49, 548–553 (1999).
- 22) Koziolek MJ, Riess R, Geiger H, Thévenod F, Hauser IA. Expression of multidrug resistance P-glycoprotein in kidney allografts from cyclosporine A-treated patients. Kidney Int., 60, 156–166 (2001).
- 23) Melk A, Daniel V, Weimer R, Mandelbaum A, Wiesel M, Staehler G, Opelz G. P-glycoprotein expression is not a useful predictor of acute or chronic kidney graft rejection. Transpl. Int., 12, 10–17 (1999).
- 24) Kotrych K, Masiuk M, Domański L, Rózański J, Droździk M. Peripheral blood lymphocytes P-glycoprotein (P-gp, gp-170) expression in allogenic kidney transplant patients. Nephrology, 11, 257–260 (2006), Carlton.
- 25) Kurata Y, Kato M, Kuzuya T, Miwa Y, Iwasaki K, Haneda M, Amioka K, Watarai Y, Uchida K, Nakao A, Kobayashi T. Pretransplant pharmacodynamic analysis of immunosuppressive agents using CFSE-based T-cell proliferation assay. Clin. Pharmacol. Ther., 86, 285–289 (2009).
- 26) Kurata Y, Kuzuya T, Miwa Y, Iwasaki K, Haneda M, Amioka K, Yamada K, Watarai Y, Katayama A, Uchida K, Kobayashi T. Clinical relevance of post-transplant pharmacodynamic analysis of cyclosporine in renal transplantation. Int. Immunopharmacol., 22, 384–391 (2014).