Regular Articles
Protective Effects of Maillard Reaction Products of Whey Protein Concentrate against Oxidative Stress through an Nrf2-Dependent Pathway in HepG2 Cells
2016 年 39 巻 9 号 p. 1437-1447

詳細
2016 年 39 巻 9 号 p. 1437-1447
Whey protein concentrate (WPC), which contains α-lactalbumin and β-lactoglobulin, is utilized widely in the food industry. The Maillard reaction is a complex reaction that produces Maillard reaction products (MRPs), which are associated with the formation of antioxidant compounds. In this study, the hepatoprotection activity of MRPs of WPC against oxidative stress through the nuclear factor-E2-related factor 2 (Nrf2)-dependent antioxidant pathway in HepG2 cells was examined. Glucose–whey protein concentrate conjugate (Glc-WPC) was obtained from Maillard reaction between WPC and glucose. The fluorescence intensity of Glc-WPC increased after 7 d compared to native WPC, and resulted in loss of 48% of the free amino groups of WPC. The sodium dodecyl sulfate-polyacrylamide gel electrophoresis (SDS-PAGE) patterns of Glc-WPC showed the presence of a high-molecular-weight portion. Treatment of HepG2 cells with Glc-WPC increased cell viability in the presence of oxidative stress, inhibited the generation of intracellular reactive oxygen species by tert-butyl hydroperoxide (t-BHP), and increased the glutathione level. Nrf2 translocation and Nrf2, reduced nicotinamide adenine dinucleotide phosphate (NAD(P)H)-quinone oxidoreductase 1 (NOQ1), heme oxygenase-1 (HO-1), glutamate-L-cysteine ligase (GCL)M and GCLC mRNA levels were increased by Glc-WPC. Also, Glc-WPC increased the phosphorylation of extracellular signal-regulated kinase (ERK) 1/2 and c-Jun N-terminal kinase (JNK). The results of this study demonstrate that Glc-WPC activates the Nrf2-dependent pathway through the phosphorylation of ERK1/2 and JNK in HepG2 cells, and induces production of antioxidant enzymes and phase II enzymes.
The Maillard reaction is complex reaction between an amine group of free amino acids or any nitrogenous compound and a carbonyl group of reducing sugars, aldehydes or ketones; this reaction occurs spontaneously in the thermal processing or storage of foods,1) and is considered an important method for protein modification.2) Because this reaction produces a variety of compounds in the early, intermediate and advanced stages, Maillard reaction products (MRPs) are a particularly complex mixture of various compounds with different molecular weights, including volatile compounds, non-volatile intermediates and dark-brown melanoidins.3) Many studies have reported beneficial effects of MRPs, including antioxidant and antimicrobial activities, and antihypertensive, anticarcinogenic and antimutagenic properties,4,5) and have shown that MRPs formed by protein and glucose significantly improved protein functionality and antioxidant activity.6,7)
Whey protein concentrate (WPC) as a protein source was used in this study. Our preliminary experiment showed that treatment of glucose–whey protein concentrate conjugate (Glc-WPC) significantly increased intracellular reduced glutathione (GSH) level in HepG2 cells treated with tert-butyl hydroperoxide (t-BHP) even compared to the untreated control, whereas glucose-sodium caseinate did not show any protective activity against the oxidative stress (Supplementary Fig. 1). WPC comprises mainly globular proteins such as α-lactalbumin and β-lactoglobulin, and is utilized widely as a high-protein food ingredient due to its excellent functional properties and high essential-amino-acid contents.8) Whey is at present also widely used in bodybuilding supplements. While many studies reported that MRPs derived from whey proteins have antioxidant and phagocytic activity,7,9) studies on the effect of MRPs from milk protein–sugar model on living cells are not investigated well.
To offset oxidative stress, cells have developed defensive mechanisms, one of which involves activation of the Kelch-like ECH-associated protein 1 (Keap1)/nuclear factor-E2-related factor 2 (Nrf2)/antioxidant response element (ARE) pathway.10) Under normal conditions, Nrf2 is a basic leucine zipper transcription factor that is localized to the cytoplasm, bound to its inhibitor protein Keap1.11) The Nrf2 complex is disrupted directly by oxidative stress or indirectly by stress-response proteins, such as mitogen-activated protein kinases (MAPKs).12) Free Nrf2 translocates into the nucleus and binds to the ARE.13,14) This leads to the selective recognition of ARE on target genes,15) resulting in regulation of the expression of cryoprotective enzymes, such as heme oxygenase-1 (HO-1) and reduced nicotinamide adenine dinucleotide phosphate (NADPH)-quinone oxidoreductase 1 (NQO1) and glutamate-L-cysteine ligase (GCL).16–18) In our recent study, total expression of Nrf2 protein was significantly induced by glyceraldehyde-bovine serum albumin (BSA) conjugate.19)
This is to our knowledge the first study of the involvement of Nrf2 in induction of antioxidant and phase II defense gene expression by Glc-WPC in HepG2 cells of human origin. Thus, the purpose of this study is to investigate whether the Nrf2 target proteins HO-1, NQO1 and GCL are induced by Glc-WPC treatment via the expression of Nrf2, and the link between MAPK signaling pathways and Nrf2-dependent regulation in HepG2 cells.
WPC was supplied by Davisco Foods International, Inc. (Le Sueur, MN, U.S.A.). D-Glucose was purchased from Amresco (Solon, OH, U.S.A.). 3-(4,5-Dimethyl-2-thiazolyl)-2,5-diphenyl-2H-tetrazolium bromide (MTT), t-BHP, N-ethylmaleimide (NEM), dimethyl sulfoxide (DMSO), GSH and 2′,7′-dichlorodihydrofluorescein diacetate (DCFA-DH) were purchased from Sigma-Aldrich (St. Louis, MO, U.S.A.). The enhanced chemiluminescence (ECL) detection kit was purchased from Abclon (Seoul, Korea). Eagle’s minimum essential medium (MEM), penicillin–streptomycin, fetal bovine serum (FBS), and trypsin-ethylenediaminetetraacetic acid (EDTA) were purchased from Hyclone (Logan, UT, U.S.A.). The bicinchoninic acid (BCA) protein assay kit was purchased from Thermo Scientific (IL, U.S.A.). Antibodies against Nrf2, proliferating cell nuclear antigen (PCNA), extracellular signal-regulated kinase (ERK) 1/2, phospho-ERK 1/2, c-Jun N-terminal kinase (JNK) and phospho-JNK, were purchased from Santa Cruz Biotechnology (Santa Cruz, CA, U.S.A.). Antibodies against p38, phospho-p38 were obtained from Cell Signaling (Denvers, MA, U.S.A.). The glyceraldehyde-3-phosphate dehydrogenase (GAPDH) antibody was provided by Millipore (Termecular, CA, U.S.A.).
Preparation of Glc-WPC ConjugateWPC was conjugated with glucose by means of the Maillard reaction, at a 1 : 5 ratio (protein–sugar) in 0.1 M sodium phosphate buffer (pH 7.4). The Maillard reaction proceeded at 55°C and 60 rpm in shaking water bath for 7 d. The Glc-WPC solution was dialyzed in dialysis tubing (MWCO 3500, Spectrum Laboratories, Inc., CA, U.S.A.) in 0.1 M sodium phosphate buffer (pH 7.4) at 4°C for 24 h, and then lyophilized.
Measurement of FluorescenceThe fluorescence intensity of Glc-WPC was measured at an excitation wavelength of 370 nm and an emission wavelength of 440 nm20) using a VICTOR3™ (PerkinElmer Inc., MA, U.S.A.) spectrofluorometer.
Determination of Free Amino Group ContentThe quantity of free amino groups was measured by the modified fluorogenic o-phtaldialdehyde (OPA) assay.21) The OPA reagent was produced by dissolving 40 mg of OPA (Sigma-Aldrich) in 1 mL methanol and 1.5 mL of sodium dodecyl sulfate (SDS) solution (12% w/v), with stirring overnight at room temperature. A 100 µL volume of Glc-WPC was mixed with 300 µL of OPA reagent, and incubated for 5 min at room temperature. The fluorescence intensity was measured at 360 nm excitation and 460 nm emission wavelengths using a multiplate reader (EL-808, BioTek, U.S.A.). A calibration curve was generated using 10 to 250 µM Nε-acetyl-L-lysine (Sigma-Aldrich) as standards.
SDS-Polyacrylamide Gel Electrophoresis (PAGE)SDS-PAGE was performed using a 5% stacking gel and 10% running gel, according to the method of Laemmli,22) using a vertical gel electrophoresis unit. All samples were mixed with 5× SDS sample buffer (25% (v/v) glycerol, 2% (w/v) SDS, 5% (v/v) mercaptoethanol, 0.025% (w/v) bromophenol blue and 60 mM Tris–HCl, pH 6.8), and boiled for 5 min. Protein (32 µg) was then applied to the gel and electrophoresis was carried out at 40 mA. After electrophoresis, one gel was stained for protein using Coomassie brilliant blue G-250 (Kojima Chemicals Co., Ltd., Kyoto, Japan) and another was stained using the Glycoprotein staining kit (Thermo Scientific, IL, U.S.A.). The Smart Color Protein Marker (Elpisbio, Daejeon, Korea) was used as the molecular weight standard.
HPLC Determination of Furosine, Hydroxymethylfurfural (HMF) and Carboxymethyllysine (CML) ContentsFurosine content was assayed following the method of Resmini and Pellegrino23) with the modifications described by Delgado.24) Sample (100 mg) was hydrolyzed with 3 mL of 8 N HCl at 110°C for 23 h in a Pyrex tube with polytetrafluoroethylene (PTFE)-faced septa. Hydrolysis tubes were sealed under nitrogen. The hydrolysates were cooled at room temperature and applied to a Sep-pak C18 cartridge (Millipore) pre-wetted with 5 mL of methanol and 10 mL of deionized water and then eluted with 3 mL of 3 N HCl. The elution was dried using a dry block bath at 60°C. Dried sample was dissolved in 400 µL of deionized water and filtered through a 0.45 µm pore size filter cartridge. Quantification of HMF contents was based on the Van Boekel and Rehman procedure.25) Sample (20 mg) was dissolved in 750 µL 0.2 N oxalic acid in a tube. The mixture was heated in a water bath at 100°C for 25 min. After heating, the mixture was mixed with 250 µL of 40% (w/v) trichloroacetic acid (TCA) for 5 min and filtered through a 0.45 µm pore size filter cartridge. The extract was injected onto an HPLC system (Agilent 1200, U.S.A.) consisting of a quaternary pump, a diode array detector, an autosampler, and a temperature-controlled column oven. The chromatographic separations were performed on ODS C18 column (4.6×50 nm, 5 µm, YMC). The gradients were formed with 0.05% trifluoroacetic acid (TFA) (solvent A) and methanol (solvent B). The elution profile was 0–2 min, 0% B; 2–9 min, 0–10% B; 9–13 min, 10–100% B; 13–15 min, 100% B; 15–16 min, 100–0% B; 16–20 min, 0% B at a flow rate of 1 mL/min. The injection volume was 10 µL and the detector wavelength was 280 nm. The furosine concentration was calculated using a furosine calibration curve in the range 3.125–50 µg/mL (Neosystem Laboratory, Strasbourg, France). The HMF concentration was quantified by the external standard method to within a range of 0.125–2 µg/mL. The CML analytical samples were prepared in the same way as furosine. OPA reagent was used for sample derivatization. The OPA reagent contained 80 mM OPA dissolved in 1 mL methanol, to which 50 µL 2-mercaptoethanol were added, and the mixture was made up to 10 mL with sodium borate buffer (0.4 M, pH 9.5). Prior to injection, 20 µL analytical sample were mixed with 20 µL OPA reagent and allowed to react for 3 min. The extract was injected onto an HPLC system (Agilent 1200) consisting of a quaternary pump, fluorescence detector, autosampler, and a temperature-controlled column oven. Precisely 3 min after derivatization, the sample was applied to a ZORBAX Eclipse Plus C18 column (4.6×250 nm, 5 µm, Agilent). The gradients were formed with 40 mM phosphate buffer (solvent A) and methanol–acetonitrile–water (45 : 45 : 10, v/v/v) (solvent B). The elution profile was 0–1.9 min, 0% B; 1.9–18.1 min, 0–57% B; 18.1–18.6 min, 57–100% B; 18.6–22.3 min, 100% B; 22.3–23.2 min, 100–0% B; 23.2–26 min, 0% B at a flow rate of 2 mL/min. The injection volume was 20 µL and OPA-derivatives were detected fluorimetrically at a 340 nm excitation and 450 nm emission wavelength. The CML concentration was calculated by means of a calibration curve in the range 3.75–30 µg/mL using a CML standard (Neosystem Laboratory).
Cell CultureHuman liver-derived HepG2 cells were obtained from ATC C (Manassas, VA, U.S.A.), and cultured in MEM medium containing 10% FBS (v/v), 100 units/mL penicillin and streptomycin, and 2.2 g/L sodium bicarbonate. Cells were incubated in a humidified atmosphere containing 5% CO2 at 37°C.
Primary Rat Hepatocytes Isolation and CultureHepatocytes were isolated from wistar male rats weighing 200–300 g, 8-week-old with free access to drinking water and food and on a 12 h light/dark cycle. Rat hepatocytes were prepared by collagenase perfusion, as described previously26,27) with several modification. The medium was replaced with fresh medium 4 h after plating. After 20 h, Cells were incubated in a humidified incubator at 37°C in an airy atmosphere.
Cell Viability AssayThe viability of cells was measured by MTT assay. HepG2 cells (1×10⁵/well) were seeded in 24-well plates for 24 h. After sample pretreatment (25–100 µg protein/mL) for 24 h, cells were treated with t-BHP (1 mM) for 2 h in the presence or absence of samples. Next, MTT solution was added to each well and incubated for a further 3 h at 37°C. Media were discarded, and DMSO was added to each well to dissolve the formazan crystals. Absorbance at 540 nm was measured using a multiplate reader (EL-808, BioTek).
Measurement of Intracellular Reactive Oxygen Species (ROS)For the measurement of ROS, HepG2 cells (2×10⁴/well) were seeded in 96-well plates for 24 h. The cells were pretreated with samples for 24 h, then incubated with 100 µM 2′,7′-dichloro-dihydro-fluorescein diacetate (DCFH-DA) for 30 min. The cells were washed with phosphate-buffered saline (PBS) and treated with 1 mM t-BHP for 2 h at 37°C. Fluorescence was recorded at an excitation wavelength of 485 nm and an emission wavelength of 535 nm using a multi-detection microplate reader (HIDEX, Finland).
Determination of GSH ContentFor measurement of the GSH content, HepG2 cells (1×10⁶/well) were seeded in six-well plates for 24 h. The cells were pretreated with samples for 24 h, then treated with 1 mM t-BHP for 2 h at 37°C. After treatment, the cells were collected and lysed using an ultrasonicator. The lysates were centrifuged at 12000×g for 30 min at 4°C. GSH levels were then determined by 5,5′-dithiobis-(2-nitrobenzoic acid)-oxidized glutathione (DTNB-GSSG) reductase recycling assay as described previously.28)
Isolation of Nuclear and Cytosolic ExtractsAfter treatment, HepG2 cells were washed twice with cold PBS and collected in 1 mL of cold PBS. Collected cells were centrifuged at 13000 rpm for 20 min at 4°C. Cell pellets were resuspended in hypotonic buffer A (10 mM HEPES, 0.1 mM EDTA, 10 mM KCl, 1 mM dithiothreitol (DTT), 0.1 mM phenylmethylsulfonyl fluoride (PMSF), 5 µg/mL leupeptin and aprotinin; pH 7.8) and 0.8% NP-40, and centrifuged at 12000×g for 5 min at 4°C. The supernatant was collected as the cytosolic extract. The pellet was resuspended in buffer B (50 mM HEPES, 300 mM NaCl, 50 mM KCl, 0.1 mM EDTA, 1 mM DTT, 20% glycerol, 0.1 mM PMSF, 5 µg/mL leupeptin and aprotinin; pH 7.8). Samples were vortexed for 10 min at 4°C, and centrifuged at 12000×g for 5 min at 4°C. The supernatant was used as the nuclear extract.
Isolation of Total Cell Lysates and Western BlottingCells were washed twice with cold PBS, lysed at 4°C in radio immunoprecipitation assay buffer (RIPA buffer) and incubated on ice for 30 min. After centrifugation at 13000 rpm for 20 min, the supernatant was used as total cell lysate. An equal amount of protein (30 µg) was separated by 10% gel electrophoresis and transferred onto polyvinylidene difluoride (PVDF) membranes (Millipore, Billerica MA, U.S.A.). Membranes were blocked with blocking solution (5% non-fat dry skim milk in Tris buffered saline with Tween 20 (TBST)) at room temperature, and then incubated with primary antibodies at 4°C overnight. Membranes were incubated with horseradish peroxidase-conjugated secondary antibodies at room temperature. Immunoreactive bands were visualized by ECL detection and quantified using the Image J software (National Institutes of Health, Maryland, U.S.A.).
Small interfering RNA (siRNA) TransfectionHepG2 cells were transfected with specific siRNA at a concentration of 50 nM using Lipofectamine™ 2000 reagent (Invitrogen, Carlsbad, CA, U.S.A.) according to the manufacturer’s protocols. Human Nrf2 siRNA was obtained from Qiagen. After 4 h incubation, the transfection medium was changed with MEM medium supplemented with 10% FBS and the hepatocytes were further cultured for additional 20 h. The cells were treated with 100 µg protein/mL Glc-WPC for 24 h and isolated for real-time PCR.
Real-Time PCRTotal RNA was isolated using TRIzol reagent (Invitrogen). First-strand cDNA was synthesized from 2 µg of total RNA using the Premium Express first-strand cDNA Synthesis System (Legene Biosciences, San Diego, CA, U.S.A.) according to the manufacturer’s instructions. Quantitative real-time PCR (qPCR) reactions were performed with TOPreal™ qPCR 2X PreMIX (Enzynomics) kit using 1 µL cDNA in a total reaction volume of 20 µL on an IQ5 real-time PCR system (Bio-Rad). qPCR was performed using the following primers: human Nrf2, F: 5′-AAC CAG TGG ATC TGC CAA CTA CTC-3′, R: 5′-CTG CGC CAA AAG CTG CAT-3′; human NQO1, F: 5′-CAG TGG TTT GGA GTC CCT GCC-3′, R: 5′-TCC CCG TGG ATC CCT TGC AG-3′; human HO-1, F: 5′-CTT CTT CAC CTT CCC CAA CA-3′, R: 5′-AGC TCC TGC AAC TCC TCA AA-3′; human GCLC, F: 5′-AGT TGA GGC CAA CAT GCG AA-3′, R: 5′-TGA AGC GAG GGT GCT TGT TT-3′; human GCLM, F: 5′-ATC AAA CTC TTC ATC ATC AAC-3′, R: 5′-GAT TAA CTC CAT CTT CAA TAG G-3′; and human β-actin, F: 5′-AGC GAG CAT CCC CCA AAG TT-3′, R: 5′-GGG CAC GAA GGC TCA TCA TT-3′. Rat Nrf2, F: 5′-AGC ACA TCC AGA CAG ACA CCA GT-3′, R: 5′-TTC AGC GTG GCT GGG GAT AT-3′; rat HO-1, F: 5′-GAG CCA GCC TGA ACT AGC-3′, R: 5′-GAT GTG CAC CTC CTT GGT-3′; rat NQO1, F: 5′-GTG AGA AGA GCC CTG ATT GT-3′, R: 5′-CCT GTG ATG TCG TTT CTG GA-3′, rat GCLC, F: 5′-GAG TTC ATT GCA AAC CAT CCT GAC-3′, R: 5′-ACT CTG GAC ATT CAC ACA GCT CAT C-3′. The results were analyzed using the comparative CT method as a means of relative quantification, normalized to the housekeeping gene (β-actin) and expressed as 2−ΔΔCT values. Melting curve analysis was performed to assess product specificity.
Statistical AnalysisAll results are expressed as the mean±standard deviation (S.D.) (n=3). Different letters indicate significant differences at p<0.05 by Duncan’s multiple range tests. All statistical analyses were performed using SAS version 9.4 (SAS Institute, Cary, NC, U.S.A.).
MR-induced compounds exhibit fluorescence at an excitation wavelength of 370 nm and emission wavelength of 440 nm.29) As seen in Fig. 1a, this specific fluorescence intensity of Glc-WPC after 7 d was increased more than 14.6-fold compared to that on day 0.
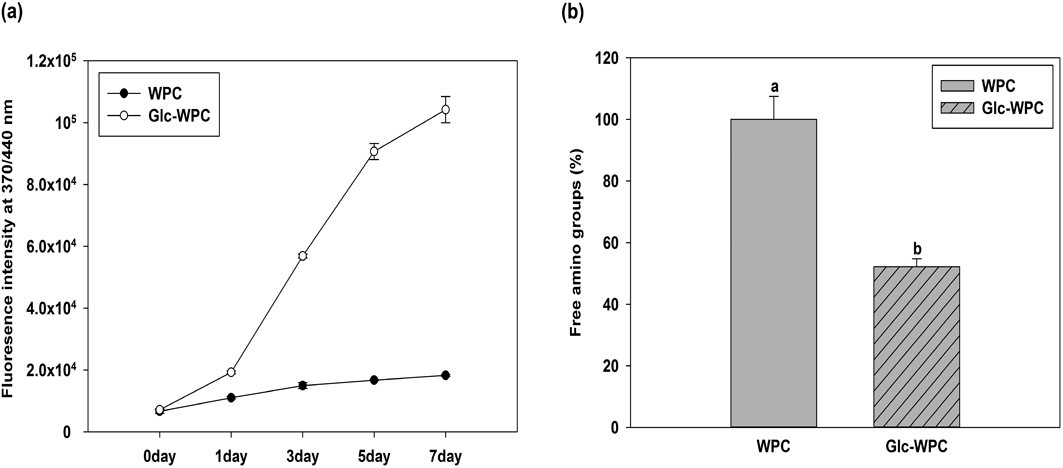
(a) Fluoresence intensity (ex: 370 nm/em: 440 nm) of MRPs. (b) Free amino group content of MRPs. Different letters indicate significant differences at p<0.05 by Duncan’s multiple range test.
Quantification of free amino groups can be used to estimate MR progress, since the reaction occurs between amino groups of proteins and reducing carbonyl groups of carbohydrates.30) Figure 1b shows the changes in amino groups as measured by the OPA method. The reaction of glucose with WPC for 7 d resulted in loss of 48% of the free amino groups of native WPC, like due to the MR under these reaction conditions.
SDS-PAGE Analysis of Glc-WPC ConjugatesChanges of WPC alone and Glc-WPC were compared by SDS-PAGE together with Coomassie and glycoprotein staining. As shown in Fig. 2a, WPC showed characteristic bands. α-Lactalbumin, β-lactoglobulin and BSA bands were evident in WPC. In contrast, these major bands were diminished in Glc-WPC, but the amount of the high-molecular-weight (HMW) portion between the loading and separating gels was increased (Fig. 2a). Also, glycoprotein staining of the HMW portion (Fig. 2b) suggested that Glc-WPC is formed by a conjugation reaction between glucose and WPC.

(a) Coomassie brilliant blue G-250 staining patterns of protein, and (b) glycoprotein staining patterns of carbohydrate. Lane 1, molecular weight markers; lane 2, WPC; lane 3, Glc-WPC; Equal amounts of protein (32 µg) were loaded in each well.
Furosine, HMF and CML were quantified (Table 1). The furosine content in Glc-WPC (14.54±0.90 mg/g dry matter (DM)) was significantly (p<0.05) higher than that in WPC (10.83±0.39 mg/g DM). Moreover, the HMF content of Glc-WPC (58.89±0.88 µg/g DM) was 5.5-fold that of WPC (10.69±0.44 µg/g DM). However, there was no significant difference in the CML contents.
| Furosine | HMF | CML | |
|---|---|---|---|
| WPC | 10.83±0.39a | 10.69±0.44a | 21.21±0.70a |
| Glc-WPC | 14.54±0.90b | 58.89±0.88b | 21.35±0.83a |
Values are the mean±S.D. of three independent experiments performed in triplicate. Different letters indicate significant differences at p<0.05 by Duncan’s multiple range tests. DM: Dry matter; HMF: hydroxymethylfurfural; CML: carboxymethyllysine; WPC: whey protein concentrate; Glc-WPC: glucose–whey protein concentrate conjugate.
The cytotoxicity of Glc-WPC against HepG2 cells was measured by MTT assay. As shown in Fig. 3a, control WPC and Glc-WPC did not show cytotoxicity against HepG2 cells up to 100 µg protein/mL, and Glc-WPC treatment protected HepG2 cells against t-BHP-induced oxidative stress (Fig. 3b). Treatment with 1 mM t-BHP for 2 h decreased HepG2 cell viability by 66% compared to the control group, and treatment with WPC (25, 50, 100 µg protein/mL) did not increase cell viability compared to the t-BHP-treated group. In contrast, treatment with Glc-WPC (25, 50, 100 µg protein/mL) significantly (p<0.05) increased cell viability in a dose-dependent manner to the level of the control group.

(a) Cytotoxicity of MRPs. Cells were pretreated with various concentrations of sample (25, 50, 100 µg protein/mL) for 24 h, followed by determination of cell viability by MTT assay. (b) Hepatoprotection effect of MRPs. Cells were pretreated with various concentrations of sample (25, 50, 100 µg protein/mL) for 24 h and exposure to 1 mM t-BHP for 2 h, followed by determination of cell viability by MTT assay. Different letters indicate significant differences at p<0.05 by Duncan’s multiple range test.
Since ROS are produced mainly as byproducts of mitochondrial respiration, mitochondria are considered to be the primary target of oxidative insult, and play an important role in the pathogenesis of various liver diseases.31) Intracellular ROS levels were determined to confirm the antioxidant activity of Glc-WPC to suppress the generation of free radicals. t-BHP markedly increased ROS generation compared to the control group, while 100 µg protein/mL of WPC and Glc-WPC inhibited t-BHP-induced ROS generation in HepG2 cells (Fig. 4a). Glc-WPC exerted a significantly (p<0.05) greater suppressive effect on ROS formation compared to WPC. The GSH redox system is an important antioxidant defense system that protects cells against oxidative damage.32) As shown in Fig. 4b, treatment with 1 mM t-BHP decreased the GSH content compared with the control. This reduced level of GSH in t-BHP-treated cells was recovered by treatment with Glc-WPC (p<0.05).

Cells were pretreated with sample (100 µg protein/mL) for 24 h and exposure to 1 mM t-BHP for 2 h. (a) Intracellular ROS generation. Cells were stained with 10 µM DCFH-DA for 30 min at 37°C. (b) Intracellular GSH contents. Different letters indicate significant differences at p<0.05 by Duncan’s multiple range test.
Nrf2 plays a central role in maintenance of the cellular redox status,33) and controls expression of cytoprotective proteins.34) We thus investigated whether Glc-WPC induced nuclear translocation of Nrf2 in HepG2 cells. The cells were first treated with Glc-WPC (100 µg protein/mL) for 1, 3, 6, 12 and 24 h. As shown in Fig. 5a, Nrf2 levels in the nuclear fraction of Glc-WPC-treated cells increased gradually over time, and peaked at 24 h. Various concentrations of Glc-WPC (25, 50, 100 µg protein/mL) were then administered to cells for 24 h (Fig. 5b). Treatment with Glc-WPC (50 µg protein/mL) resulted in a significant increase (p<0.05) in the nuclear Nrf2 level compared with WPC.

(a) Cells were first treated with Glc-WPC (100 µg protein/mL) for 1, 3, 6, 12 and 24 h. (b) Cells were pretreated with various concentrations of sample (25, 50, 100 µg protein/mL) for 24 h. Cytosolic and nuclear fractions were prepared and analyzed by Western blotting using corresponding antibodies. Different letters indicate significant differences at p<0.05 by Duncan’s multiple range test.
Antioxidant and phase II enzymes play crucial roles in protecting cells from oxidative stress, and include NQO1, HO-1 and GCL. To assess the expression of antioxidant and phase II enzymes, HepG2 cells and primary rat hepatocytes were treated with Glc-WPC (25, 50, 100 µg protein/mL) for 24 h. As shown in Fig. 6, Glc-WPC treatment increased the Nrf2, NQO1, HO-1, GCLC and GCLM mRNA level in a dose-dependent manner. Also, treatment of Glc-WPC increased the Nrf2, HO-1, GCLC, NQO1 mRNA expression in primary rat hepatocytes (Fig. 7). These results demonstrated that the protective effect of Glc-WPC against oxidative stress is attributable in part to induction of the expression of antioxidant phase II enzymes.

GCLM in HepG2 cells (a) Nrf2 (b) NQO1, (c) HO-1, (d) GCLM, (e) GCLC. Cells were pretreated with different concentrations of sample (25, 50, 100 µg protein/mL) for 24 h. Different letters indicate significant differences at p<0.05 by Duncan’s multiple range test.

(a) Nrf2 (b) HO-1, (c) GCLC, (d) NQO1. Cells were pretreated with different concentrations of sample (25, 50, 100 µg protein/mL) for 24 h. Different letters indicate significant differences at p<0.05 by Duncan’s multiple range test.
To determine whether the expression of Glc-WPC-inducible genes depends on Nrf2, cells transfected with Nrf2-specific siRNA (siNrf2) RNA showed a significant reduction of Nrf2 expression compared with cells transfected with siRNA control (Fig. 8a). Also, results in Fig. 8b show that the expression of HO-1, GCLC and GCLM is remarkably decreased by Nrf2 silencing compared to the siRNA control. These results demonstrate that Glc-WPC induced-Nrf2 plays critical role in antioxidant phase II enzymes.

(a) The mRNA expression for Nrf2 was determined by real-time PCR in hepG2 cells transfected with scrambled siRNA (ssiRNA) or Nrf2-specific siRNA (siNrf2). (b) mRNA expression levels for HO-1, GCLC, GCLM were measured in HepG2 cell treated with 100 µg protein/mL Glc-WPC for 24 h. Different letters indicate significant differences at p<0.05 by Duncan’s multiple range test.
To identify the upstream signaling pathways involved in Glc-WPC-mediated Nrf2 activation and induction of phase II enzymes, we investigated the phosphorylation of ERK, JNK and p38 MAPK, which are signaling proteins involved in the response to oxidative stress. Cells were treated with Glc-WPC (50 µg protein/mL) for 0.25, 0.5, 1, 2, 3 and 6 h. As shown in Fig. 9a, Glc-WPC treatment increased the phosphorylation of ERK1/2 and JNK after 1 h. However, there was no difference in the phosphorylation of p38. To identify the signaling pathways related to activation of Nrf2, cells were pre-incubated for 1 h with specific inhibitors of ERK, JNK and p38, and then treated with Glc-WPC (50 µg protein/mL) for 24 h. ERK (PD98059) and JNK (SP600125) inhibitors abolished the protective effect of Glc-WPC against t-BHP-induced oxidative damage (Fig. 9b). Furthermore, decreased Nrf2 levels were detected in nuclear factions of cells co-treated with the ERK and JNK inhibitors, respectively, but not with the p38 inhibitor, compared to treatment with Glc-WPC only (Fig. 9c). These results suggested that the ERK and JNK signaling pathways are involved in Glc-WPC-mediated Nrf2 activation.

Cells were pretreated with Glc-WPC (50 µg protein/mL) for 24 h. (a) Whole-cell protein was analyzed by Western blotting using corresponding antibodies. (b) Cells were pretreated with inhibitors (10 µM) for 1 h and then treated with sample for 24 h. After exposure to 1 mM t-BHP for 2 h, cell viability was determined by MTT assay. (c) Cells were pretreated with inhibitors (10 µM) for 1 h and then treated with sample for 24 h. Nuclear fractions were prepared and analyzed by Western blotting using corresponding antibodies. Different letters indicate significant differences at p<0.05 by Duncan’s multiple range test.
Previous studies have reported that protein–carbohydrate conjugates formed by the MR are functional complexes that exert antioxidant and antimicrobial effects for food modifications.35,36) Although several studies have examined the antioxidant activity of MRPs formed by reacting milk protein and sugar,7,37) their antioxidant activity was evaluated by chemical measurements, including determination of reducing power and 1,1-diphenyl-2-picrylhydrazyl (DPPH) radical-scavenging activity. The biological antioxidant effects of Maillard-reacted milk protein with sugar have not been investigated extensively. We showed that MRPs prepared by conjugating WPC and glucose exhibited hepatoprotection activity in HepG2 cells that had been subjected to acute oxidative injury by t-BHP, which is metabolized to free-radical intermediates by CYP in hepatocytes or hemoglobin in erythrocytes.38) Thus, decline of ROS formation and upregulation of GSH in HepG2 cells after treatment with Glc-WPC suggested an important role for Glc-WPC in protecting liver cells against oxidative stress.
GSH is a major antioxidant and protects cells against oxidative stress by scavenging ROS.39) Also, in many liver diseases, disruption of the GSH redox system affects various signaling pathways associated with survival and proliferation.40) To synthesize GSH endogenously, GCL, which is composed of a modifier subunit (GCLM) and a catalytic subunit (GCLC), plays an important role and is the rate-limiting enzyme. The expression of GCL is regulated by the Nrf2-ARE pathway.41) The two subunits of GCL contribute differently to synthesis of GSH depending on compounds.42,43) In the present study, Glc-WPC increased the expression of both GCLM and GCLC in a concentration-dependent manner. As another antioxidant enzyme, NQO1 promotes the detoxification of quinones, and protects cells against oxidative stress.44) HO-1, which decomposes toxic heme into free iron, CO and biliverdin45) demonstrated the antioxidant and cytoprotective activities of heme.46) Thus, upregulation of NQO1 and HO-1 by Glc-WPC may represent an antioxidant mechanism. The expression of an array of ARE-mediated cytoprotective genes, including NQO1 and HO-1, upon oxidative stress is mediated by the transcription factor Nrf2.47)
Treatment with Glc-WPC increased the translocation of Nrf2. The activation of intracellular protein kinase cascades, with the MAPKs playing a key role, has been reported to contribute to induction of ARE expression via Nrf2.48) Among various signaling pathways, Nrf2 is a target of the MAPKs. MAPKs—including ERK1/2, p38, and JNK—play crucial roles in regulating various cellular functions, such as stress responses, apoptosis, proliferation, and immune defense.49,50) ERK1/2 and JNK facilitate the nuclear translocation of Nrf2, thereby activating the Nrf2/ARE pathway.51) The ERK1/2 signaling pathway is involved in the cellular response to oxidative stress.52) In the present study, the phosphorylation of ERK1/2 and JNK, but not that of p38 MAP kinase, was higher than in the untreated group, suggesting that ERK1/2 and JNK are involved in Nrf2 activation. Therefore, these results confirm that the ERK1/2 and JNK-dependent pathways play an important role in the cytoprotective effect of Glc-WPC. This is the first report that Glc-WPC upregulates Nrf2-linked antioxidant defense enzymes via ERK1/2 and JNK-dependent signaling pathways in HepG2 liver cells.
In conclusion, treatment with Glc-WPC protects against t-BHP-induced oxidative stress in HepG2 cells, and activates the Nrf2-dependent pathway through the phosphorylation of ERK1/2 and JNK in HepG2 cells, and induces the expression of antioxidant and phase II enzymes. Furthermore, Glc-WPC inhibited the ROS generation and cell death caused by t-BHP. These results suggest Glc-WPC to have the potential for application in functional products.
This research was supported by the Fishery Commercialization Technology Development Program (113007031SB010), the Ministry of Oceans and Fisheries. The authors also thank the Korea University—CJ Food Safety Center (Seoul, South Korea) for providing equipment and facilities.
The authors declare no conflict of interest.
The online version of this article contains supplementary materials.