Abstract
While it is well known that L-carnitine [3-hydroxy-4-(trimethylazaniumyl)-butanoate] is an essential molecule for β-oxidation, it provides anti-oxidative effects as well. Since these effects have been observed in photoreceptor cells, the carnitine’s intracellular concentration is considered to play a protective role against oxidative damage to those cells. However, even though its high hydrophilicity makes it likely that carnitine import is accomplished via a dedicated host transport system, the specific uptake process into those cells is currently unknown. Therefore, in this study, we sought to identify and characterize photoreceptor cell carnitine uptake transporter(s) utilizing 661W cells as a photoreceptor cell model. The results of our uptake assays showed that carnitine was transported into 661W cells in a saturable manner (Km=5.5 mM), and that the activity was susceptible to extracellular pH and Na+. While these data suggest the involvement of a transporter in 661W cell carnitine uptake, the observed transport profile did not correspond to any of the currently known carnitine transporters such as organic cation/carnitine transporter 1 (Octn1), Octn2, Octn3, B0,+ and Ct2. In fact, in our experiments, the mRNA expressions for such carnitine transporters in 661W cells were consistently very low and the carnitine transporter substrates did not inhibit the uptake activities. Taken as a whole, our results indicate that carnitine is transported into 661W cells in a carrier-mediated manner. However, since its transport modes cannot be fully explained by known carnitine transporters, it is highly likely that photoreceptor cells utilize a unique molecularly-based carnitine uptake system.
The retina is a light-sensitive tissue structure on the inner surface of the eye that plays a vital role in vision. It consists of a pigmented epithelial cell layer and three neural cell layers formed by photoreceptor, bipolar, and retinal ganglion cells. Of these, photoreceptor cells are unique neurons that directly receive light, and then convert it into nerve pulse signals for transmission to the brain via the optic nerve.
It has long been known that functional impairments to photoreceptor cells will lead to vision loss, which is often associated with age-related macular degeneration (AMD) or retinitis pigmentosa (RP). Based on an examination of several proposed mechanisms underlying photoreceptor damage that have been reported to date,1–3) it is believed that oxidative stress is likely to play a significant role in the pathogenesis of both AMD and RP.4,5) Therefore, in order to prevent development of retinal diseases such as AMD by minimizing photoreceptor cell damage, it is necessary to identify the molecules that counteract oxidative stress and to determine how their roles are regulated in photoreceptor cells.
L-Carnitine (carnitine, [3-hydroxy-4-(trimethylazaniumyl)butanoate]) is a well-known molecule that is essential to mitochondrial β-oxidation and can be found throughout the body.6) It has been reported that carnitine can reduce oxidative stress via its free radical scavenger property7) and it is highly safe for intake as dietary supplement.8) Furthermore, since the anti-oxidant effects of carnitine have been actually observed in retinal neuronal cells9–11) and the carnitine concentration level is about twice higher in retina (108 µM) than in the blood (48.9 µM) in rabbits,12) it is plausible to hypothesize that carnitine not only plays important roles in energy homeostasis, but it also helps to protect photoreceptor cells against oxidative damage. Human retinal carnitine concentration is speculated to be about 100 µM because the serum carnitine concentration after oral administration of carnitine at 60 mg/kg is 43.9 µM.13)
To fulfill the protective action of carnitine, photoreceptor cells must first uptake extracellular carnitine from the circulatory system. The primary sources of carnitine are the diet and biosynthesis in the liver and kidney.14) Since carnitine is highly hydrophilic because of its polar zwitterionic property, a specific transport system is necessary to convey it across plasma membranes.
To date, five types of L-carnitine transporters have been identified. The first identified carnitine transporter is an organic cation/carnitine transporter 1 (OCTN1, SLC22A4),15) which shows a low-affinity and Na+-dependent transport profile.16) Subsequent studies have identified that ergothioneine is a preferable substrate.17) OCTN2/CT1 (SLC22A5) and Octn3 (Slc22a21, identified only in mice) are well characterized high-affinity carnitine transporters that convey the compound in a Na+-dependent and independent manner, respectively.16,18,19) In addition, the amino acid transporter B0,+ (SLC6A14) is also capable of transporting carnitine in a low-affinity and Na+-dependent manner,20) and finally, carnitine transporter 2 (CT2, SLC22A16) is a testis-specific carnitine transporter with high-affinity and Na+-independent properties.21)
Furthermore, carnitine uptake that cannot be explained by any of these identified transporters has been observed in rat brain and liver specimens.6,22) Therefore, it is possible that molecular-based, as yet unidentified carnitine transporter(s) exist in certain tissues.
In the retina, OCTN2 is reported to be expressed at the inner blood–retinal barrier, where it transports carnitine from the blood to the retinal tissue.23) However, since the carnitine transport process from the retinal tissue interstitial fluids into the photoreceptor cells has yet to be characterized, the responsible transporter remains unknown. Molecular identification of the carnitine transporter in the retina is important because gene mutations or expression downregulation of such transporter(s) might result in carnitine insufficiency, thereby hampering its effectiveness against oxidative stress in photoreceptor cells, which could eventually contribute to the onset or progression of AMD or RP. It should also be noted that compounds that upregulate or activate the photoreceptor cell carnitine transporter have potential as therapeutic agents in AMD and RP treatment regimes.
With this background in mind, this study sought to identify and characterize photoreceptor cell carnitine uptake transporter(s) using 661W cells, which is a murine cone photoreceptor-derived cell line.
MATERIALS AND METHODS
Materials[3H]Carnitine (1 mCi/mmol) was purchased from American Radiolabeled Chemicals (St. Louis, MO, U.S.A.), while betaine monohydrate, 4-aminobutyric acid (GABA), L-lysine, choline, L-phenylalanine and L-arginine were purchased from Nacalai Tesque (Kyoto, Japan), and γ-butyrobetaine, and 1-methyl-4-phenylpyridinium (MPP+) were obtained from Sigma-Aldrich (St. Louis, MO, U.S.A.). L-Glycine was purchased from Wako Pure Chemical Industries, Ltd. (Osaka, Japan), and (±)-acetylcarnitine chloride (acetylcarnitine) was from Abcam (Cambridge, MA, U.S.A.). L-Ergothioneine (ergothioneine) was from Enzo (Farmingdale, NY, U.S.A.).
Cell CultureThe murine photoreceptor-derived 661W cells were graciously provided by Dr. Al-Ubaidi (University of Houston, Houston, TX, U.S.A.) and were maintained in Dulbecco’s modified Eagle’s medium (DMEM) supplemented with 10% fetal bovine serum (FBS), 100 units/mL penicillin, and 100 mg/mL streptomycin at 37°C and 5% CO2. The cells were used at 14-17 passages.
[3H]Carnitine Uptake AssayThe 661W cells were seeded onto poly-D-lysine coated 24-well culture plates at a density of 1×10⁵ cells/well and then incubated for 24 h, after which the medium was replaced with serum-free Hanks’ balanced salt solution (HBSS). After 10 min incubation, carnitine uptake assays (30 nM or 10 µM) were performed based on the previously-described method.24)
In our examination of Na+ or Cl− dependency of carnitine uptake process, Na+ or Cl−-free HBSSs were prepared by replacing Na+ or Cl− with equimolar lithium or gluconate, respectively. Similarly, in our examination of the pH dependency of carnitine uptake, the HBSS pH levels were adjusted to 5.4, 6.4, 7.4, and 8.4 with 1 M NaOH, and then used in the uptake assays.
The cellular radioactivity levels derived from transported carnitine were determined using the β-scintillation counter (LS6500, Beckman Coulter, Fullerton, CA, U.S.A.) and the values were expressed as those per unit cellular protein content (mg). The carrier-mediated carnitine uptake levels were calculated by subtracting the values obtained on ice from those obtained at 37°C.
In the kinetic analysis, carnitine uptake activities were determined at various concentrations (from 0.1 to 30 mM) and fitted with Michaelis–Menten equation,
where [
S] is the substrate concentration in the medium (mM),
v is the uptake rate of the substrate (nmol/min/mg of protein),
Km is the Michaelis–Menten constant (mM), and
Vmax is the maximum uptake rate (nmol/min/mg protein). Eadie–Hofstee plot was developed based on the subtracted curve, and then
Km and
Vmax were calculated using the plot.
Carnitine Transport Inhibition AssaysInhibition assays against carnitine transport activity in 661W cells were performed using OCTN substrates (acetylcarnitine, betaine, γ-butyrobetaine, and ergothioneine), B0,+ substrates (glycine, phenylalanine, lysine and arginine), an organic cation transporter (OCT) substrate (MPP+), an OCT and choline transporter substrate (choline), and a GABA transporter substrate (GABA). The transport assay procedure was the same as described above. The B0,+ inhibitor concentrations were set at 2.5 mM, whereas other inhibitors were set at 30 µM, based on the following estimated IC50 values: 5–50 µM and <5 µM of acetylcarnitine or γ-butyrobetaine for OCTN2 and OCTN3,16,18) respectively, 5–50 µM of acetylcarnitine and 5 µM of betaine for CT2, respectively,21) <2.5 mM of glycine, phenylalanine, lysine or arginine for B0,+.20) As for OCTN1, no IC50 data has been reported, but the Km value of main substrate (ergothioneine) is 21 µM.17)
RT-PCR AnalysisTotal RNA was prepared from 661W cells using ISOGEN II (Nippon Gene, Tokyo, Japan). Single-strand cDNA was synthesized from 0.5 µg total RNA by reverse transcription (RT) with random primers and oligo dT primers using ReverTra Ace qPCR RT Master Mix with genomic DNA Remover (Toyobo, Tokyo, Japan). PCR was performed through 30 cycles of 95°C for 1 min, 55°C for 1 min, and 72°C for 1 min using the primers shown in Table 1. Mouse tissue cDNAs were used as positive controls (kidney for Octn1 and Octn2, lung for B0,+, and testis for Octn3 or Ct2).
Table 1. Primers Used in Studies of Carnitine Transporter Gene Expression
| Gene | Primers |
|---|
| Mouse Octn1 | Slc22a4 | Forward | 5′-GAG TGG AAT CTG GTG TGT GAG-3′ |
| Reverse | 5′-GGC TTT CTG GAT GAT CTG TTC-3′ |
| Mouse Octn2 | Slc22a5 | Forward | 5′-TGA CAC TCC TAA CTT GCA TGG-3′ |
| Reverse | 5′-GCA TCT GGT CAA TGG TAT CTG-3′ |
| Mouse Octn3 | Slc22a21 | Forward | 5′-TTT GGA ATC ACC TCT GCC TAC-3′ |
| Reverse | 5′-TGT TGT CGG TCA CTG ACA GTG-3′ |
| Mouse B0,+ | Slc6a14 | Forward | 5′-CTT CAG AGG TCA AGT GGA ATG-3′ |
| Reverse | 5′-AGA GCT TCA GGA TAG GCA ATG-3′ |
| Mouse Ct2 | Slc22a16 | Forward | 5′-ATA AGT CCA GCT CCT GTG ACC-3′ |
| Reverse | 5′-ATA AGT CCA GCT CCT GTG ACC-3′ |
Statistical comparisons were made using a two-tailed Student’s t test or Dunnett’s test. The values (p) below 0.05 were regarded as statistically significant differences.
RESULTS
Time Course of Carnitine Uptake by 661W CellsThe characterization of carnitine uptake by 661W cells began with an examination of its time-dependency (Fig. 1). The results showed that the uptake level increased linearly for at least 30 min.
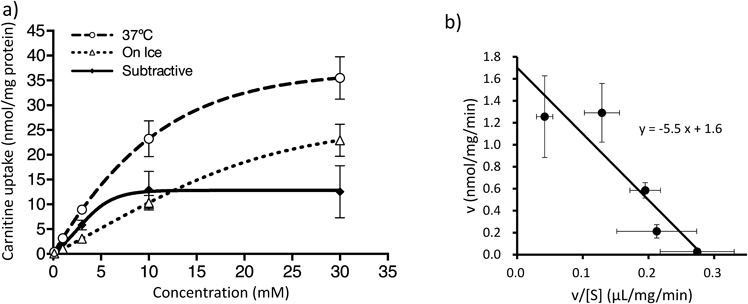
Concentration-Dependency of Carnitine Uptake by 661W CellsNext, the concentration dependencies of carnitine uptake by 661W cells were determined in HBSS buffer (pH 7.4) containing Na+ and Cl− by subtracting the values obtained on-ice condition from those obtained at 37°C. This is because active transport processes generally work at 37°C, but does not on ice-cold condition. The results showed that the subtracted carnitine uptake curve was saturable (Fig. 2a). The Eadie–Hofstee plot, which was calculated from the subtracted curve, provided a straight line and yielded the tentative Km of 5.5±0.9 mM and the tentative Vmax of 1.6±0.7 nmol/mg/min (Fig. 2b).
Inhibitory Effects of Known Carnitine Transporter Substrates on Carnitine Transport Activity of 661W CellsAs previously mentioned, Octn1, Octn2, Octn3, B0,+ and Ct2 have been identified as carnitine transporters in mice. Therefore, inhibitory assays toward carnitine transport activity were examined in 661W cells using acetylcarntine, betaine and γ-butyrobetaine (Octn2, Octn3 and Ct2 substrates), and ergothioneine (an Octn1 substrate) as respective substrates. As shown in Fig. 3a, neither of these substrates had any significant influence on the amount of carnitine uptake. Moreover, glycine, phenylalanine, lysine and arginine (B0,+ substrates) were also not effective in blocking carnitine uptake (Fig. 3b).
Next, in order to investigate the possible involvement of other transporter types, experiments were conducted with MPP+ (an OCT substrate), choline (an OCT and choline transporter substrate), and GABA (a GABA transporter substrate) (Fig. 3c). Of these, only choline showed even a mild potential inhibition property against carnitine uptake by 661W cells (65.4%, Fig. 3c).
mRNA Expression Profiles of Previously-Identified L-Carnitine TransportersTo examine whether or not the previously-identified carnitine transporters were expressed in 661W cells, RT-PCR was performed. As shown in Fig. 4, each band of positive controls was detected around 500 bp, indicating that the primers work properly. On the other hand, no expression of the previously-identified carnitine transporters mRNA was found in 661W cells.
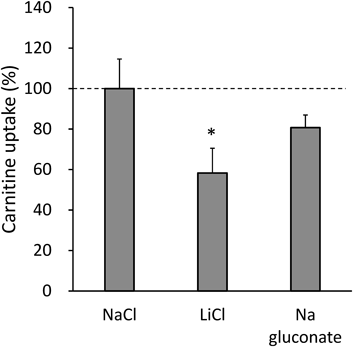
Na+ and Cl−-Dependency of Carnitine Uptake by 661W CellsSince it is well known that Na+ and Cl− often work as a co-transport partner during the substrate transport processes of several SLC transporters, the possibility of their involvement of these ions in the carnitine transport system was tested in 661W cells. The transport assays were carried out using an Na+-free or Cl−-free reaction buffer, in which Na+ or Cl− was replaced by Li+ or gluconate, respectively. As shown in Fig. 5, carnitine uptake in Na+-free buffer was reduced to 58.3±12.2% of that obtained in the Na+-containing buffer. On the other hand, the depletion of Cl− in the reaction buffer did not significantly affect the uptake activity.
Extracellular pH Dependency of the Carnitine Uptake by 661W CellsFinally, we examined the pH dependency of the carnitine transport into 661W cells. The results show that acidification of the transport buffer to pH 5.4 and pH 6.4 led to a decrease in the carnitine uptake levels to 30.0±9.1% and 68.0±6.6%, respectively, as that determined at pH 7.4, whereas alkalization to pH 8.4 resulted in the carnitine uptake to 174.1±30.8% (Fig. 6). Based on the pKa (=3.8) of the carboxylic acid of carnitine, the ratios of its zwitterion state in pH 5.4, 6.4, 7.4 and 8.4 were calculated as 97.6, 99.8, 99.9%, and over 99.9%, respectively. Therefore, it is assumed that the changes in the carnitine uptake result from the variations in the carnitine transporter activity at various pH conditions rather than the changes in the ionic state of carnitine.
DISCUSSION
In this study, we investigated carnitine uptake profile of 661W cells, which is a murine photoreceptor cell line, and found that carnitine is transported in a saturable manner. The 661W cells have the potential to convey carnitine by an unidentified carnitine transporter.
In the kinetic study, there appears to be a small saturable component of the carnitine uptake even under the on ice-cold condition, whereas the uptake curve at 37°C is obviously saturable. As exemplified by human erythrocyte nucleoside transporter ENT1 that has been reported to work even at very low temperatures near 0°C,25) the carnitine uptake system in 661W cells also has a potential to somewhat work even under the ice-cold state. Thus, the calculated Km value obtained from the carnitine uptake study in 661W cells is designated as a tentative value. Nevertheless, considering that the functional uptake level in ice-cold condition seems to be marginal, it is unlikely that the tentative Km value could be drastically different from its intrinsic value.
The tentative Km value (5.5 mM) was found to be significantly higher than those of known transporters (Octn1, Octn2, Octn3, B0,+, Ct2; <1 mM), and carnitine appears to be transported in a partly Na+-dependent manner in 661W cells, which is inconsistent with the action modes of the previously reported carnitine transporters.15,18–21)
Moreover, we found that neither of the compounds that are known as the substrates as carnitine transporters inhibited the carnitine uptake by 661W cells, and that no mRNA expression of such known carnitine transporters in 661W cells was detected. Therefore, our results do not support the hypothesis that a previously identified carnitine transporter would work in 661W cells.
Furthermore, it is also unlikely that cationic amino acid transporters, OCTs, or choline transporters are involved in the uptake of carnitine, since MPP+, arginine, lysine, and GABA did not inhibit the uptake activity. It should also be noted that, even though choline showed a mild inhibitory effect on the carnitine uptake in the present study, the Cl−-independent uptake profile and sensitivity profile to extracellular pH were not consistent with the properties of choline transporters26) and choline transporter-like proteins,27) respectively.
Given that the known transporters cannot explain its uptake by 661W cells, it is reasonable to assume that at least one previously unidentified carnitine transporter is expressed in 661W cells, which raises the question as to what type of transporter it could be. To summarize, the unknown transport system in 661W cells is characterized by high Km, pH-dependency, and partial Na+-dependency. From a Km value viewpoint, it is worth noting that a low-affinity carnitine uptake (Km: 2.9 mM) has been reported in rat cerebral cortical slices.22) Accordingly, since photoreceptor cells belong to the neuronal cell category, it was thought that the 661W cell carnitine transporter might be related to the one reported in the rat brain. However, that possibility was confounded by differences in the inhibition profiles between these uptake systems (ref. 22 and Fig. 3).
On the other hand, the results of pH- and Na+-dependency profiles do provide some mechanistic insights into the carnitine uptake system of 661W cells. First, since extracellular pH increase accelerates carnitine uptake and vice versa, a possibility arises that proton (H+) or hydroxyl anion (OH−) transport may occur simultaneously during the carnitine transport in 661W cells. In addition, it has been reported that, although molecular entity remains unknown, clonidine uptake by mouse brain microvascular endothelial cells show a pH-dependent profile, suggesting a potential involvement of H+ antiport.28) In other cases, it has been shown that SLC4A11 has Na+-dependent OH− cotransport activity.29,30)
Furthermore, considering that L-carnitine is likely to be transported mostly in a zwitterion state, Na+ might be used to electronically neutralize carnitine/OH− symport, or to offset electrogenesis during carnitine/OH− symport or carnitine/H+ antiport. If either is actually the case, it would not be surprising to see that, even though Na+ would be preferable, it could be interchangeable with other cations (which would result in a partial Na+-dependency profile).
Taken together, it is suggested carnitine uptake by 661W cells may be accompanied by OH− symport or H+ antiport by utilizing Na+ (or another cation) as a co-substrate, although more extensive studies are needed to confirm the notion. As far as we know, no transport system/molecule with this characteristic has been reported previously, so detailed characterization will be necessary to identify the molecular entity of this presumably new transporter. Even though the molecular entity remains unknown, our findings are an important step forward to its identification. The identification of the presumed molecular entity would pave the way for new studies aimed at understanding how its activity and expression levels can be altered, and/or whether there are genetic variations that cause loss of functions.
In conclusion, our results first show that 661W cells, which is a photoreceptor cell line, have a unique low-affinity type carnitine transport system with pH and Na+-sensitive uptake profiles. Furthermore, while identification of the responsible molecule must await further investigation, the results can be expected to shed light on a novel pathophysiological and pharmacological role of carnitine in photoreceptor cells.
Acknowledgment
The authors would like to extend their sincere thanks to Dr. Muayyed R Al-Ubaidi (University of Houston, Houston, TX, U.S.A.) for graciously providing the 661W cells used in this study. Y.O. thanks Yasuhiro Watanabe M.D. (Chiba University Graduate School of Medicine, Japan) for help with technical assistance. This study was supported in part by Grants from the Japan Society for the Promotion of Science (JSPS KAKENHI 26461258 (N.A.)), Strategic Research Foundation Grant-aided Project for Private Universities (S1412001), and Gout Research Foundation of Japan.
Conflict of Interest
The authors declare no conflict of interest.
REFERENCES
- 1) Tuo J, Grob S, Zhang K, Chan CC. Genetics of immunological and inflammatory components in age-related macular degeneration. Ocul. Immunol. Inflamm., 20, 27–36 (2012).
- 2) Sancho-Pelluz J, Arango-Gonzalez B, Kustermann S, Romero FJ, van Veen T, Zrenner E, Ekstrom P, Paquet-Durand F. Photoreceptor cell death mechanisms in inherited retinal degeneration. Mol. Neurobiol., 38, 253–269 (2008).
- 3) Sarangarajan R, Apte SP. Melanization and phagocytosis: implications for age related macular degeneration. Mol. Vis., 11, 482–490 (2005).
- 4) Beatty S, Koh H, Phil M, Henson D, Boulton M. The role of oxidative stress in the pathogenesis of age-related macular degeneration. Surv. Ophthalmol., 45, 115–134 (2000).
- 5) Narayan DS, Wood JP, Chidlow G, Casson RJ. A review of the mechanisms of cone degeneration in retinitis pigmentosa. Acta Ophthalmol., 94, 748–754 (2016).
- 6) Bremer J. Carnitine–metabolism and functions. Physiol. Rev., 63, 1420–1480 (1983).
- 7) Gülçin I. Antioxidant and antiradical activities of L-carnitine. Life Sci., 78, 803–811 (2006).
- 8) Rubin MR, Volek JS, Gomez AL, Ratamess NA, French DN, Sharman MJ, Kraemer WJ. Safety measures of L-carnitine L-tartrate supplementation in healthy men. J. Strength Cond. Res., 15, 486–490 (2001).
- 9) Cao Y, Li X, Shi P, Wang LX, Sui ZG. Effects of L-carnitine on high glucose-induced oxidative stress in retinal ganglion cells. Pharmacology, 94, 123–130 (2014).
- 10) Kocer I, Kulacoglu D, Altuntas I, Gundogdu C, Gullulu G. Protection of the retina from ischemia-reperfusion injury by L-carnitine in guinea pigs. Eur. J. Ophthalmol., 13, 80–85 (2003).
- 11) Calandrella N, De Seta C, Scarsella G, Risuleo G. Carnitine reduces the lipoperoxidative damage of the membrane and apoptosis after induction of cell stress in experimental glaucoma. Cell Death Dis., 1, e62 (2010).
- 12) Pessotto P, Valeri P, Arrigoni-Martelli E. The presence of L-carnitine in ocular tissues of the rabbit. J. Ocul. Pharmacol., 10, 643–651 (1994).
- 13) Otsuka Pharmaceutical Co., Ltd. “L-Carnitine FF oral solution 10% [Package Insert].” ‹http://www.info.pmda.go.jp/downfiles/ph/PDF/180078_3999033S1024_1_04.pdf›.
- 14) Rebouche CJ. Kinetics, pharmacokinetics, and regulation of L-carnitine and acetyl-L-carnitine metabolism. Ann. N. Y. Acad. Sci., 1033, 30–41 (2004).
- 15) Tamai I, Yabuuchi H, Nezu J, Sai Y, Oku A, Shimane M, Tsuji A. Cloning and characterization of a novel human pH-dependent organic cation transporter, OCTN1. FEBS Lett., 419, 107–111 (1997).
- 16) Tamai I, Ohashi R, Nezu JI, Sai Y, Kobayashi D, Oku A, Shimane M, Tsuji A. Molecular and functional characterization of organic cation/carnitine transporter family in mice. J. Biol. Chem., 275, 40064–40072 (2000).
- 17) Gründemann D, Harlfinger S, Golz S, Geerts A, Lazar A, Berkels R, Jung N, Rubbert A, Schomig E. Discovery of the ergothioneine transporter. Proc. Natl. Acad. Sci. U.S.A., 102, 5256–5261 (2005).
- 18) Ohashi R, Tamai I, Yabuuchi H, Nezu JI, Oku A, Sai Y, Shimane M, Tsuji A. Na(+)-dependent carnitine transport by organic cation transporter (OCTN2): its pharmacological and toxicological relevance. J. Pharmacol. Exp. Ther., 291, 778–784 (1999).
- 19) Sekine T, Kusuhara H, Utsunomiya-Tate N, Tsuda M, Sugiyama Y, Kanai Y, Endou H. Molecular cloning and characterization of high-affinity carnitine transporter from rat intestine. Biochem. Biophys. Res. Commun., 251, 586–591 (1998).
- 20) Nakanishi T, Hatanaka T, Huang W, Prasad PD, Leibach FH, Ganapathy ME, Ganapathy V. Na+- and Cl−-coupled active transport of carnitine by the amino acid transporter ATB(0,+) from mouse colon expressed in HRPE cells and Xenopus oocytes. J. Physiol., 532, 297–304 (2001).
- 21) Enomoto A, Wempe MF, Tsuchida H, Shin HJ, Cha SH, Anzai N, Goto A, Sakamoto A, Niwa T, Kanai Y, Anders MW, Endou H. Molecular identification of a novel carnitine transporter specific to human testis. Insights into the mechanism of carnitine recognition. J. Biol. Chem., 277, 36262–36271 (2002).
- 22) Huth PJ, Schmidt MJ, Hall PV, Fariello RG, Shug AL. The uptake of carnitine by slices of rat cerebral cortex. J. Neurochem., 36, 715–723 (1981).
- 23) Tachikawa M, Takeda Y, Tomi M, Hosoya K. Involvement of OCTN2 in the transport of acetyl-L-carnitine across the inner blood–retinal barrier. Invest. Ophthalmol. Vis. Sci., 51, 430–436 (2010).
- 24) Anzai N, Miyazaki H, Noshiro R, Khamdang S, Chairoungdua A, Shin HJ, Enomoto A, Sakamoto S, Hirata T, Tomita K, Kanai Y, Endou H. The multivalent PDZ domain-containing protein PDZK1 regulates transport activity of renal urate-anion exchanger URAT1 via its C terminus. J. Biol. Chem., 279, 45942–45950 (2004).
- 25) Takano M, Kimura E, Suzuki S, Nagai J, Yumoto R. Human erythrocyte nucleoside transporter ENT1 functions at ice-cold temperatures. Drug Metab. Pharmacokinet., 25, 351–360 (2010).
- 26) Okuda T, Haga T. Functional characterization of the human high-affinity choline transporter. FEBS Lett., 484, 92–97 (2000).
- 27) Iwao B, Yara M, Hara N, Kawai Y, Yamanaka T, Nishihara H, Inoue T, Inazu M. Functional expression of choline transporter like-protein 1 (CTL1) and CTL2 in human brain microvascular endothelial cells. Neurochem. Int., 93, 40–50 (2016).
- 28) André P, Debray M, Scherrmann JM, Cisternino S. Clonidine transport at the mouse blood–brain barrier by a new H+ antiporter that interacts with addictive drugs. J. Cereb. Blood Flow Metab., 29, 1293–1304 (2009).
- 29) Jalimarada SS, Ogando DG, Vithana EN, Bonanno JA. Ion transport function of SLC4A11 in corneal endothelium. Invest. Ophthalmol. Vis. Sci., 54, 4330–4340 (2013).
- 30) Park M, Li Q, Shcheynikov N, Zeng W, Muallem S. NaBC1 is a ubiquitous electrogenic Na+-coupled borate transporter essential for cellular boron homeostasis and cell growth and proliferation. Mol. Cell, 16, 331–341 (2004).