Abstract
Our study of drug–drug interaction (DDI) started with the clarification of unusually large DDI observed between ramelteon (RAM) and fluvoxamine (FLV). The main cause of this DDI was shown to be the extremely small hepatic availability of RAM (vFh). Traditional DDI prediction assuming the well-stirred hepatic extraction kinetic ignores the relative increase of vFh by DDI, while we could solve this problem by use of the tube model. Ultimately, we completed a simple and useful method for prediction of DDI. Currently, DDI prediction becomes more complex and difficult when examining issues such as dynamic changes in perpetrator level, inhibitory metabolites, etc. The regulatory agents recommend DDI prediction by use of some sophisticated methods. However, they seem problematic in requiring plural in vitro data that reduce the flexibility and accuracy of the simulation. In contrast, our method is based on the static and two-compartment models. The two-compartment model has advantages in that it uses common pharmacokinetics (PK) parameters determined from the actual clinical data, guaranteeing the simulation of the reference standard in DDI. Our studies confirmed that dynamic changes in perpetrator level do not make a difference between static and dynamic methods. DDIs perpetrated by FLV and itraconazole were successfully predicted by use of the present method where two DDI predictors [perpetrator-specific inhibitory activities toward CYP isoforms (pAi, CYPs) and victim-specific fractional CYP-isoform contributions to the clearance (vfm, CYPs)] are determined successively as shown in the graphical abstract. Accordingly, this approach will accelerate DDI prediction over the traditional methods.
1. INTRODUCTION
Co-administration of sorivudine and 5-fluorouracil (5-FU) caused a tragic death–accident in the past.1) Thereafter, under the guidance of the regulatory agencies,2,3) drug manufacturers have been making efforts to anticipate possible drug–drug interactions (DDI) of new chemical entities (NCE) by performing both in vitro and in vivo DDI studies at an early stage. In reality, however, it is not possible to perform clinical studies of all DDIs. Thus, in the common cases, the regulatory agencies recommend their prediction from the in vitro and limited in vivo data.4–6) Nevertheless, in light of the Food and Drug Administration (FDA) guidance and current findings in this field of research,7–11) many issues in regard to DDI prediction remain to be solved (Table 1).
Our recent studies on DDI prediction by use of a newly developed two-compartment (comp)-assisted, tube-based, and static overall inhibitory activity method, gave a clue to the solution of some of these issues.12–15) Thus, the present review focuses on our achievements in DDI prediction by use of this method.
Table 1. Issues Raised in DDI Prediction
| (i) Decrease in first-pass effect by DDI |
| (ii) Dynamic changes in hepatic inhibitor level [Iu(t)] |
| (iii) DDI mediated by multiple CYP-isoform inhibition |
| (iv) Gut-wall extraction |
| (v) Inhibitory activities of metabolites |
| (vi) Time-dependent CYP inhibition [mechanism-based CYP inhibition (MBI)] |
| (vii) A gap between in vitro and in vivo Ki,u |
| (viii) Interplays of enzymes and transporters |
2. BACKGROUND
2.1. Unusualness of Ramelteon (RAM)-Victimized DDIThe corresponding author encountered an unusually large DDI caused by co-administration of RAM [Rozerem (melatonin receptor agonist) marketed by Takeda Chemical, Ind.; CYP1A2 and CYP2C19 are RAM’s major and sub eliminating enzymes, respectively] and fluvoxamine (FLV, strong CYP1A2 and CYP2C19 inhibitor), when he was in charge of clinical study and pharmacokinetic (PK) analysis at that company in the early 2000 s. The fold increase in the area under the plasma RAM levels curve (AUCR) was noted to be almost 13016) (Fig. 1).
This magnitude of DDI had been deemed to be difficult to predict by any methods until we devised the mechanism.13) The AUCR predicted by either a static method [constant unbound inhibitor (Iu)-based method] as shown below, or a dynamic method (time-dependent Iu-based method) employing physiologically-based pharmacokinetic (PBPK) model, wherein the well-stirred model was applied for the hepatic extraction kinetics, was no more than 5.4) Typically, the value of AUCR estimated by a well-stirred model-based static method was:
 | (1) |
where the parameters for victim and perpetrator (=inhibitor) are prefixed with “v” and “p,” respectively, and (+) indicates the presence of a perpetrator (inhibitor) or co-administration with a perpetrator, and
CLoral,
CLh, int,
Ai, overall and
Ki, u, overall represent oral clearance, intrinsic metabolic-clearance in the liver, overall inhibitory activity and overall unbound inhibition constant for the DDI, respectively.
Although the mechanism of the DDI had been unknown at least until we elucidated it, this medicine was approved in 2008 in the U.S. and allowed for the clinical use, under the condition that concomitant use with FLV must be avoided.
2.2. Change in Victim’s First-Pass Effect by DDIAfter moving to the current affiliation (2005), the corresponding author placed first priority on studies to clarify the mechanism of this DDI. Soon after performing comparative studies on DDIs produced by co-administration of various CYP1A2 and CYP2C19 substrates with FLV (Table 2), he noted that AUCR would be underestimated mainly by the assumption of the well-stirred model, and that this issue could be solved by the tube model as expressed by Eq. 2, as the best alternative to the well-stirred model.13)
Table 2. DDIs Observed in Co-administration of Various CYP1A2 and CYP2C19 Substrates with FLV (Details Shown in Ref. 13)
| Victim | FLV | AUCR | vFha) |
|---|
| Lansoprazole (LAN) | 40 mg | 25 mg BID | 3.8 | 0.92 |
| Omeprazole (OME) | 40 mg | 50 mg BID | 5.6 | 0.7 |
| S-mephenytoin (MEP) | 100 mg | 87.5 mg QDb) | 9.9 | 0.31 |
| Theophylline (THE) | 257 mg | 100 mg QD | 3.3 | 0.94 |
| Caffeine (CAF) | 250 mg | 50 mg BID | 13.7 | 0.93 |
| Tasimelteon (TAS) | 5 mg | 50 mg QD | 6.5 | 0.57 |
| Tacrine (TAC) | 40 mg | 100 mg QD | 8.3 | 0.13 |
| Tizanidine (TIZ) | 4 mg | 50 mg BID | 32.6 | 0.14 |
| Melatonin (MEL) | 5 mg | 50 mg singlec) | 22.7 | 0.06 |
| RAM | 16 mg | 100 mg BID | 128 | 0.03 |
QD, BID and TID represent once, twice and three times a day administration, respectively. vAe, oral=0 except for THE (vAe, oral=0.07). a) Estimated from vCLoral assuming vFa=1. b) MEP was administered 16 h after multiple FLV doses. c) MEL was administered 3 h after a single FLV dose.
 | (2) |
where,
 | (3) |
 | (4) |
where, v
Ae, oral,
Fa,
Fg,
Fh, fu
b and
Qh represent urinary excretion ratio of unchanged drug after oral administration, the dose fraction of orally absorbed drug, avoidance of gut-wall extraction, hepatic availability, blood unbound fraction and hepatic blood flow, respectively.
The reason was that Eq. 2 derived from the tube model (Eqs. 3 and 4), which describes well the dependency of AUCR on vFh, is unlike Eq. 1 (the well-stirred model) which models AUCR as equal to Ai, overall, independently from vFh (more details in later sections).
2.3. Difficulty of Determination of Dynamic Changes in Hepatic Inhibitor Level [Iu(t)]Another issue in DDI prediction is how to determine in vivo Iu(t), which is difficult to measure directly but essential for the calculation of Ai, overall or AUCR. The only way would be to estimate it from the blood perpetrator level.17) Some researchers have proposed a compromised method which allows calculation of the upper limit of Iu (Iu, portal(max)) by assuming that Iu is equal to the unbound perpetrator level in the portal blood (inlet of the liver),18) although it assumed the well-stirred model:
However, it is evident that this method is not able to explain the prolonged inhibitory activity of FLV.19) This is because the plasma MEP (CYP2C19 substrate) level in oral administration 16 h after multiple FLV dosing has been reported to be greatly increased [AUCR=approximately 10 (Table 2)], regardless of the fact that at this time period, the unbound perpetrator level in the portal vein would have been decreased to almost equal the systemic plasma unbound level. Accordingly, the DDI produced by FLV could not be explained by the transient increase in the portal vein level.
In order to explain such a prolonged Ai, overall(t) as found in the MEP-victimized DDI,19) we have developed a three-comp PBPK model that allows us to mathematically calculate Iu(t) [=fub×C2(t)=fub×Chb(t) (time-dependent hepatic blood unbound drug level)], where the liver is assumed to be one of drug pools (compartments having a significantly large volume) and the tube model is applied for this comp12) (Fig. 2).
Using this model, we were able to show that a perpetrator such as FLV after oral administration should be first distributed into the liver via the portal vein and therein be pooled for a prolonged period of time before being distributed to the systemic blood, and that this prolonged level is the key to explaining the prolonged Ai, overall(t) (Fig. 3).
2.4. Traditional Methods for Dynamic Prediction of DDIIn actual DDIs, the blood victim level changes with the dynamic change in the blood perpetrator level. Accordingly, it may be a concern that a static method assuming a constant Ai, overall, cannot predict DDI accurately, although this was swept aside by our later analysis using a static model. Thus, many dynamic methods, assuming either full or semi PBPK models, have been proposed previously.4) Their basic concept is to simulate the in vivo levels of a perpetrator and a victim by inputting plural in vitro drug specific parameters as well as predetermined physiological parameters (bottom-up approaches). However, it was a concern that in vitro parameters such as Ki, u would have a large bias, and that the plurality of the input parameters would reduce the flexibility of the simulation, making it difficult to achieve an accurate fit of the time-dependent plasma victim levels. In order to address to this issue, we investigated simpler (dynamic and static) methods than the traditional PBPK models as shown in next section.13)
3. METHODS FOR 2-COMP MODEL-ASSISTED DDI SIMULATION
3.1. Calculation of vCb, oral(−)(t)Based on 2-comp model (Fig. 4), blood–drug level after intravenous (i.v.) administration [Cb, iv(t)] can be expressed by use of a bi-exponential function as,
 | (5) |
where
KA and
KB are first-order elimination rate constants;
VA and
VB are volume-related constants, and they are determined by common model-independent PK parameters [
CLtot,
V0,
Vdss and
Kd] as,
 | (6) |
 | (7) |
 | (8) |
Likewise, blood–drug level after oral administration [
Cb, oral(
t)] can be expressed as,
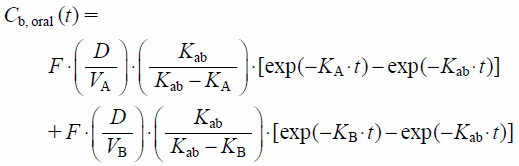 | (9) |
where
F and
Kab represent bioavailability and first-order absorption rate constant, respectively.
Thus, vCb, oral(−)(t) as the reference standard of DDI, can be calculated from knowing vKab and vF, along with common model-independent PK parameters (vCLtot, vV0, vVdss and vKd). Although vF is essential for the calculation of vCb, oral(t) and is commonly determined from the ratio of vCLtot (obtained from i.v. administration) to vCLoral (obtained from oral administration), it can be determined solely from vCLoral and vAe, oral, if vFa×vFg=1 and therefore vF=vFh. Accordingly, vFh can be determined as:
 | (10) |
Solving Eq. 10 with respect to v
Fh
 | (11) |
Finally, v
Cb, oral(−)(
t) can be simulated by the use of six common parameters (v
Aoral, v
CLoral, v
V0, v
Vdss, v
Kd and v
Kab) as inputs.
3.2. Calculation of vCb, oral(+)(t)We have devised three methods for the simulation of vCb, oral(+)(t): two static methods (SM1 and SM2) and one dynamic one (SMd), though the study was started with SMd. Firstly, for SM1 assuming constant Ai, overall, vCb, oral(+)(t) can be calculated by knowing vCLoral(+), vAe, oral(+) and vFh(+), along with vV0, vVdss, vKd and vKab which are basically the same as the ones for vCb, oral(−)(t). Meanwhile, vCLoral(+), vAe, oral(+) and vFh(+) can be determined as vCLoral/AUCR (Eq. 1), vAe, oral×AUCR and exp[ln(vFh)/Ai, overall] (Eq. 4), respectively. Besides, Ai, overall can be determined as a function of AUCR, vFh and vAe, oral as:
 | (12) |
Alternatively,
 | (13) |
Thus, v
Cb, oral(+)(
t) can be simulated by SM1, by the use of
AUCR as an input parameter, along with the input parameters used for v
Cb, oral(−)(
t).
SM2 also assumes constant Ai, overall which is equal to one estimated from the perpetrator-specific CYP isoform inhibition constants (pAi, CYPs: DDI predictor 1) and the fractional CYP isoform contributions to victim clearance (vfm, CYPs: DDI predictor 2) as determined from the plural DDI datasets, as shown in Eq. 14 where a victim is metabolized by CYP1A2, CYP2C19, CYP3A4 and non-CYP, and a perpetrator inhibits these CYPs.14)
 | (14) |
where,
Meanwhile, the outline of SMd is shown in Fig. 5 focusing the “A” related terms such as vKA(t) and vCbA, oral(t), where Ai, overall(t) [=1+pChb, u(t)/Ki, u, overall] and accordingly vCLint(t) [=vCLint/Ai, overall(t)] (panel A), and vKA (panel A) and vKB, are assumed to change stepwise at narrow time intervals, so that vCb, oral(t) [vCbA, oral(t), panel B] changes likewise, keeping the condition of the tube model as vFh(+)(t)=exp[(ln(vFh)/Ai, overall(t)] (details described in ref. 13).
3.3. Utilities of SM1, SM2 and SMdFlow charts of the simulation of vCb, oral(+)(t) versus vCb, oral(−)(t) by the use of SM1, SM2 and SMd are shown, with discrimination of inputs and outputs for each simulation method, in Fig. 6. In particular, SM1 uses AUCR and common PK parameters (vCLoral; vV0; vVdss; vKd; vAe, oral; vKab) as inputs with vFh, Ai, overall and vFh(+) as outputs; SM2 uses pAi, CYPs (DDI predictor 1) and vfm, CYPs (DDI predictor 2) along with the PK parameters as inputs with vFh, Ai, overall, vFh(+) and AUCR as outputs; SMd uses pChb, u(t) and Ki, u, overall along with the PK parameters as inputs with vFh, Ai, overall(t), vFh(+)(t) and AUCR as outputs.
SM1 has a basic utility for simulating time-dependent blood drug level increases with concordance with the actual ones, regardless of pChb, u(t) and Ki, u, overall. When it is applied to the simulation of DDI where a perpetrator is administered concomitantly or within 2 h before a victim which is common in clinical DDI studies, the accuracy of the simulation is expected to be high equivalently to SMd as shown in sections 4.1 and 4.2. It has an application utility for estimating Ai, overall and one of DDI predictors 1 and 2 which can be used for prediction of unknown DDI by collaboration with SM2, as shown in the next subsection (3.4).
SM2 has a basic utility for predicting time-dependent blood drug level increases by use of predictors 1 and 2. The limiting condition is the same as in SM1. It has an application utility for examining the sensitivity of SM1-based simulation performed by tuning predictors 1 and 2, other than the prediction of unknown DDI by collaboration with SM1.
SMd has a basic utility for simulating time-dependent blood drug level increases by taking pChb, u and Ki, u, overall into consideration. It has an application utility for examining the sensitivity of time-dependent parameters such as Ai, overall(t) in simulation, as shown in sections 4.1 and 5.3. Although it can simulate DDI with high accuracy, it is not always easy to obtain pChb, u(t), as described in section 2.3.
3.4. SM1 and SM2-Collaborated Prediction of Unknown DDI from the Existing DDI DatabaseBased on the concept of multiple CYP-isoform mediated metabolism as shown above, it is shown that DDI predictors 1 and 2 can be determined stepwise from the existing DDI database, so that unknown DDI can be predicted using these predictors by use of SM2 (Fig. 7).
If drug A (vFh=0.84) is metabolized exclusively [vfm, CYP1A2(A)=vfm, CYP3A4(A)=0] by CYP2C19 [vfm, CYP2C19(A)], and Ai, overall [Ai, overall(A+PM)=4.5] when drug A is administered to CYP2C19 poor-metabolizer (PM), has been predetermined from AUCR [AUCR(A+PM)=5.0] using Eq. 12, then vfm, CYP2C19(A) as DDI predictor 2, can be determined to be 0.78 from Eq. 14, assuming pAi, CYP2C19=infinite (step 1, SM1). Next, if Ai, overall [Ai, overall(A+X)=3.2] when drug A is co-administered with a CYP-specific inhibitor (inhibitor X), has been predetermined from AUCR [AUCR(A+X)=3.5], then pAi, CYP2C19(X) as DDI predictor 1 can be similarly determined to be 8.8 (step 2, SM1). Additionally, if drug B (vFh=0.95) is metabolized exclusively by CYP2C19 [vfm, CYP2C19(B)], and Ai, overall [Ai, overall(B+X)=1.95] when drug B is co-administered with inhibitor X, has been predetermined from AUCR [AUCR(B+X)=2.0], then vfm, CYP2C19(B) as DDI predictor 2 can be determined to be 0.55 (step 3, SM1). Thus finally, when drug B is co-administered with another CYP2C19 inhibitor (inhibitor Y) whose pAi, CYP2C19 (=3.0, DDI predictor 1) has been predetermined after a similar step to step 2, then Ai, overall(B+Y) and therefore AUCR(B+Y) can be predicted to be 1.57 and 1.59 by SM2, respectively, (goal). This was the concept of SM1 and SM2-collaborated prediction of unknown DDI from the existing DDI database.14)
4. SIMULATION OF DDI PERPETRATED BY FLV
4.1. Simulation of DDI Produced by Co-administration of RAM and FLVDynamic changes in the blood RAM levels [vCb(t) versus vCb(+)(t) changes] after administration of RAM (16 mg) with FLV (100 mg, BID), were simulated by the three methods (SMd, SM1, and SM2; PK parameters shown in ref. 14) (Fig. 8).
A conformed simulation such that both AUCR and fold increase in Cmax agreed with the actual values was achieved by the SMd, when Ki, u, overall was tuned to 3.3 nM, in contrast to the theoretically generated time-dependent hepatic blood unbound FLV level [pChb, u(t) versus static pChb, u (=around 50 nM, 2.5 times the level as shown in Fig. 3 in consideration of the non-linear PK of FLV)]. Additionally, simulations were also achieved by the SM1 using Ai, overall=16.1 determined from the actual AUCR, and by the SM2 using Ai, overall=16.3 determined from pAi, CYPs and vfm, CYPs (details in ref. 14).
These simulations showed that the unusually large magnitude of RAM-FLV DDI (AUCR=129) can be attributed to both the large Ai, overall (around 16), and the extremely low vFh of RAM (0.03). This finding was also confirmed by the simulations of other FLV-perpetrated DDIs (next section).14) The concordance of the dynamic and static simulations showed that the dynamic changes in blood perpetrator level would have little impact on DDI. This result was also confirmed by the simulations of other FLV-perpetrated DDIs.14)
4.2. Simulation of DDIs Produced by Co-administration of Other CYP1A2 and CYP2C19 Substrates and FLVDDIs produced by co-administration of CYP1A2 and CYP2C19 substrates and FLV were simulated, in order to compare them with each other, including the RAM-victimized DDI, on the Ai, overall(t) and vFh (Table 2) basis (SMd and SM1), and also to examine the predictability of the DDIs from pAi, CYPs and vfm, CYPs (SM2).14) Typical examples (8 sets of DDI) are shown in Fig. 9.
SMd-based simulation confirmed that blood victim level increases can be simulated simply by tuning a single parameter (Ki, u, overall). In addition, SM1-based simulations confirmed that blood victim level increases are almost entirely determined on the static basis, regardless of their dynamic changes.
Factorial analysis based on these simulations demonstrated that the Ki, u, overall obtained in the SMd are almost equivalent to the static ones [=pChb, u/(Ai, overall−1)], and that they are not much different among the DDIs, despite the great difference in AUCR (the same is true for Ai, overall) (Fig. 10A), rendering this difference in AUCR large compared to the difference in vFh(+)/vFh [or 1/vFh in case of vFh(+) sufficiently large]14) (Fig. 10B).
These results confirmed that the tube-based method is an appropriate method for the prediction of DDI, unlike the well-stirred model.
4.3. Predictability of Unknown DDIs Perpetrated by FLV by Use of DDI Predictors 1 and 2Upon simulation of the above FLV-perpetrated DDIs by SM2, we determined pAi, CYPs of FLV at different doses.14) Firstly, pAi, CYP1A2 (FLV 100 mg QD) (=18) was determined from the Ai, overall (CAF-FLV), assuming vfm, CYP1A2 (CAF) (=0.94). pAi, CYP2C19 (FLV 100 mg BID) (=1+pChb, u/Ki, u, overall=20 nM) was determined from the Ki, u, overall (2.6 nM) for DDI (MEP-FLV),19) and assuming vfm, CYP1A2 (MEP) (=1.0). pAi, CYP3A4 (FLV 25 mg BID) (=1.3) was determined from the Ai, overall (OME-FLV), assuming vfm, CYP1A2/vfm, CYP3A4 (=0.92/0.08). Then, since FLV is a competitive CYP inhibitor (Table 3), pAi, CYPs at different doses could be determined using the following equation:
Table 3. p
Ai,.CYPs of FLV
| Daily dose n×pD | pAi,CYP1A2 | pAi, CYP2C19 | pAi, CYP2D6 | pAi, CYP3A4 |
|---|
| 2×25 mg | 9.5 | 6 | 1 | 1.3 |
| 1×100 mg | 18 | 10 | 1 | 1.6 |
| 2×100 mg | 35 | 20 | 1 | 2.3 |
 | (15) |
Meanwhile, vfm, CYPs of a single-CYP-isoform substrate were determined straightforwardly from the actual Ai, overall (single dataset), while those of triple-CYP-isoform substrates were determined using plural DDI datasets14) (Table 4). For instance, vfm, CYP1A2/vfm, CYP2C19 /vfm, CYP3A4 (=0.73/0.20/0.07) of RAM were determined with the aid of the data on DDIs perpetrated by ketoconazole (KTCZ: 200 mg BID; weak CYP2C19 but strong CYP3A4 inhibitor; AUCR/Ai, overall=1.82/1.21), fluconazole (FLCZ: 200 mg QD; weak CYP3A4 but strong CYP2C19 inhibitor; AUCR/Ai, overall=2.36/1.33).
Table 4. vf
m, CYPs of CYP1A2 and CYP2C19 Substrates
| No. of CYP isoformsa) | vfm, CYP1A2 | vfm, CYP2C19 | vfm, CYP3A4 | 1-vfm, nonCYP |
|---|
| RAM | 3 | 0.73 | 0.20 | 0.07 | 0.00 |
| MEL | 3 | 0.62 | 0.24 | 0.14 | 0.00 |
| TIZ | 3 | 0.75 | 0.20 | 0.05 | 0.00 |
| TAC | 1 | 0.75 | 0.00 | 0.00 | 0.25 |
| TAS | 3 | 0.70 | 0.05 | 0.25 | 0.00 |
| CAF | 1 | 0.94 | 0.00 | 0.00 | 0.06 |
| THE | 1 | 0.78 | 0.00 | 0.00 | 0.22 |
| OME | 2 | 0.00 | 0.92 | 0.08 | 0.00 |
| OME (PMb)) | 1 | 0.00 | 0.00 | 1.00 | 0.00 |
| MEP | 1 | 0.00 | 1.00 | 0.00 | 0.00 |
a) Based on iv vitro human liver microsome (HLM) experiments. b) Poor metabolizer with CYP2C19.
The SM2 simulations shown in Figs. 8 and 9 suggested that any victim-DDI perpetrated by FLV can be successfully predicted by using these predetermined (permanent) pAi, CYPs for FLV (Table 3), as far as predictor 2 (vfm, CYPs) and vCLoral (or vFh) of the victim (another DDI predictor) are determined.
5. PREDICTION OF CYP3A4-MEDIATED DDI
5.1. Approaches of Gut-Wall Extraction in CYP3A4-Mediated DDIWe also studied whether DDI caused by a CYP3A4 substrate and a CYP3A4 inhibitor can be predicted in a similar way to the above.15) However, the solution of issues (iv), (v) and (vi) shown in Table 1 was a key to success in the simulation.20)
Concerning issue (iv), it is common for an orally-administered CYP3A4 substrate to be subjected to CYP3A4-mediated gut-wall extraction (vFg<1; the gut wall first-pass effect) as well as hepatic extraction (vFh, the hepatic first-pass effect), and accordingly subjected to a decrease in the bioavailability (vF=vFg×vFh<1, in case of vFa=1)21) (Fig. 11).
Thus, the decrease in the gut-wall extraction (increase in vFg) expected by co-administration with a CYP3A4 inhibitor will have an impact on the prediction of CYP3A4-mediated DDI. However, if significant gut-wall extraction occurs with a CYP3A4 substrate, it will not be easy to accurately predict the vFg and its change (increase) in the presence of an inhibitor with discrimination of vFh. Although many reports have addressed the prediction of vFg, the methods seem not necessarily reliable, and we cannot solve this since they will depend largely on vFa (true for substrates of both CYP3A4 and P-glycoprotein).22)
The situation is different for midazolam (MDZ) and triazolam (TRZ); they exhibit complete oral absorption (vFa=1), and have been used as the most preferable CYP3A4 probe to examine CYP3A4-inhibitory potential of NCE in clinical DDI studies.23) Their vFg values have been determined with high confidence from the PK after iv and oral administrations,21) and also from the AUCR in their co-administration with grapefruit juice (GFJ) which shows gut-wall specific CYP3A4 inhibition [vFg(+)=1] at a single administration of an appropriate strength GFJ (ex. single or double strength)24,25) (Fig. 12).
Thus, we focused on the simulation of DDI produced by co-administration of MDZ (or TRZ) with various CYP3A4 inhibitors. This was because we could determine the pAi, CYP3A4 of these inhibitors, which are essential for the SM2-based DDI prediction, with high confidence.
5.2. Simulation of DDIs Produced by Co-administration of MDZ with Typical CYP3A4 InhibitorsNext, we have performed simulations of MDZ and TRZ-victimized DDIs produced by co-administration with perpetrators listed in the FDA guidance,2) by use of SM1 and SM2.15) In particular, we assumed a complete increase in vFg in the presence of a moderate or strong perpetrator [vFg(+)=1], against vFg=0.5 (MDZ) and vFg=0.7 (TRZ), and verified this assumption with simultaneous simulations using the data of iv and oral administration of the victims. Consequently, conformed simulations were achieved by SM1, and pAi, CYP3A4 of each perpetrator was successfully determined. Additionally, conformed simulations were also achieved by SM2 using the pAi, CYP3A4s determined from the SM1 simulations (details shown in ref. 15). The plasma MDZ level increases by co-administration with four inhibitors [KTCZ; itraconazole (ITCZ); clarithromycin (CLM); erythromycin (ERT)], and their pAi, CYPs determined by the SM1 are shown in Fig. 13 and Table 5, respectively.
Table 5. p
Ai, CYP3A4s Determined from SM1-Based Simulations of MDZ-Victimized DDIs
| Perpetrators | Daily dose n×pD | pAi, CYP3A4 | CYP3A4 inhibitiona) (%) | MBI |
|---|
| KTCZ | 1×400 mg | 9.60 | 89.6 | No |
| ITCZ | 1×200 mg | 11.2 | 91.1 | No |
| CLM | 2×500 mg | 2.50 | 60.0 | Yes |
| ERT | 3×500 mg | 2.48 | 59.7 | Yes |
a) Calculated from (1-1/Ai, overall)×100.
Concerning CYP inhibition type, it is known that KTCZ and ITCZ are competitive inhibitors, while CLM and ERT are non-competitive (MBI).10,26) Because of competitive inhibition, we were able to determine the pAi, CYPs at different doses of KTCZ and ITCZ similarly to FLV, which we could use for DDI prediction at different doses of perpetrators (see later section). We were not able to determine pAi, CYPs at different doses of CLM and ERT in the same way. Nevertheless, the doses of these perpetrators are commonly fixed in the clinical studies, to those shown in Table 5, so that there is no problem in the prediction of DDI in the clinical studies.
Concerning gut-wall CYP3A4 inhibition, it was shown that a perpetrator will exhibit pAi, CYP3A4 (gut) equivalent or larger than pAi, CYP3A4 in the liver, and that a perpetrator exhibiting MBI (ex. CLM and ERT) will exhibit almost complete inhibition toward the gut-wall CYP3A4 [vFg(+)=unity],26–28) regardless of incomplete inhibition of the hepatic CYP3A4 [pAi, CYP3A4, around 2.5, Quinney’s simulations26) (next section)]. The value of Ai, overall determined in DDI produced by MDZ plus CLM (3.3) (Fig. 13C) was confirmed to be the same as found by Quinney’s simulations (next section).
5.3. Insignificance of Inhibitory Activities of Metabolites and MBI upon DDI PredictionCYP inhibition by a perpetrator’s metabolites is known to be common occurrence. ITCZ is known to have 3 metabolites active in CYP inhibition, and Templeton et al.27) predicted dynamic changes in total fold decrease in CLh, int [Ai, overall(t)] produced by ITCZ and its metabolites, suggesting that this complex should be taken into consideration in dynamic DDI simulation. However, our study based on the Templeton’s simulation showed that inhibition by multiple inhibitors including metabolites does not make a difference between the SMd and SM1-based simulations (Fig. 14).
Concerning MBI (issue 6), Ai, overall(t) of a perpetrator (enzyme inactivator) is expected to be less sensitive to the changes in the blood perpetrator level than that of competitive inhibitors. In our study based on Quinney’s simulations,15) the remaining CYP3A4 activity after exposure by CLM was shown to be determined by the balance of the rates of the inactivation as a function of the perpetrator concentration at the enzyme site and the reproduction of CYP3A4, and the inactivation was shown to last several days even after complete elimination of CLM from the blood circulation (Fig. 15A). Thus, the lasting effect could be explained by the slower reproduction of CYP3A4. This characteristic would work in favor of the approximation of Ai, overall(t) to be the time-independent one (Ai, overall) (Fig. 15B). It was suggested that this characteristic of MBI has little impact on the present DDI prediction. However, the steady state maximum inactivation at the liver site was shown to be achieved one week after multiple perpetrator doses (Fig. 15A). Therefore, it would be safer when the present method is applied to DDI produced by multiple perpetrator doses, as is common in clinical DDI studies.
5.4. Additional Examples of CYP3A4-Mediated DDI SimulationAdditionally, SM2-based DDI simulations were performed using the reported DDIs between various CYP3A4 substrates [ex. lidocaine (LID), zopiclone (ZOP) and alprazolam (ALP)] versus ITCZ as a strong CYP3A4 inhibitor, and versus ERT as a moderate CYP3A4 inhibitor. They were simultaneous in respect to different perpetrators toward the same victim. Consequently, conformed simulations were achieved by both SM1 and SM2 (Fig. 16). The values of vfm, CYPs as DDI predictor 2 are shown in Table 6.
Table 6. v
Fg, v
Fh and vf
m, CYPs of Victims Metabolized by Multiple CYP Isoforms
| Victims | vFg | vFh | vfm, CYP1A2 | vfm, CYP2C9 | vfm, CYP3A4 | vfm, non CYP |
|---|
| MDZ | 0.5 | 0.60 | 0 | 0 | 0.85 | 0.15a) |
| TRZ | 0.7 | 0.72 | 0 | 0 | 1.0 | 0 |
| LID | 1 | 0.26 | 0.5 | 0.1 | 0.4 | 0 |
| ZOP | 1 | 0.75 | 0 | 0 | 0.5 | 0.5b) |
| ALP | 1 | 0.96 | 0 | 0 | 1 | 0 |
a) N-Glucronide. b) Decarbpxylation.
In these simulations, vFg of all the victims was assumed to be unity, using a simple judgment that compares vFg-determining PK parameters (vfub, vFh, and vfm, CYP3A4) with those for TRZ as a reference standard. More detail was shown in the supplementary material in ref. 15.
6. PERSPECTIVE OF ISSUES (VII) AND (VIII) RAISED IN DDI PREDICTION
6.1. Variability of Ki, u in VitroPBPK methods commonly employ in vitro Ki, u for DDI prediction. However, the value may have a bias. Greenblatt et al. reported the considerable variability of KTCZ Ki, u determined from HLM-CYP3A4, through analysis of the values reported from different research groups in the past29) (Fig. 17).
Thus far, sources of the variability are uncertain. Yao et al. reported the inhibitory effect of microsome degradation products (polyunsaturated fatty acids) on human CYP enzyme.30) This report suggested that the contamination of HLM with the degradation products underestimates in vitro CLh, int and accordingly overestimates Ki, u. Thus, we have examined this possibility in the reported Ki, u of FLV on a theoretical basis. The result suggested overestimation of Ki, u due to the gap of victim clearance between in vitro and in vivo (Fig. 18). Therefore, in vitro Ki, u, as commonly used in the PBPK-based methods, would preferably be avoided in DDI prediction.
6.2. Modification of Hepatic Extraction Model to Meet with Enzyme-Transporter InterplaysVarma et al. have reported a new hepatic extraction model, where the “overall” hepatic intrinsic clearance (CLh, int, overall) of a transporter-and-enzyme substrate is expressed by a hybrid equation, including a term (PSp+CLh, int) in the denominator and a term (PSp+PSa)×CLh, int in the numerator, and is discriminated from “common” hepatic intrinsic clearance (CLh, int) which is defined by the traditional hepatic extraction kinetics model11) (Fig. 19).
Importantly, a term (PSp+PSa)/(PSp+CLh, int) (=Kp, u, u), “hepatic tissue to hepatic plasma partition coefficient,” reflects a relative increase in the cytosolic unbound-drug level to the unbound plasma level in case of PSa/PSp>>1 and consequently the increase in the overall hepatic clearance. Meanwhile, if a drug is not a transporter substrate (PSa=0), then Kp, u, u becomes smaller than unity, depending on the PSp-to-CLh, int ratio (=r). If a victim drug exhibits such a characteristic, DDI perpetrated by a weak or moderate CYP inhibitor will be diminished or weakened.
Nevertheless, this scenario will not be possible in common DDIs, in the light of the present successful DDI predictions (r>>1; PSa=0). Varma et al. also proposed a categorization of NCEs, arranging Kp, u, u into four classes based on the well-known pharmaceutical classification system: the majority are substrates of hepatic uptake transporters such as OATPs. Therefore, the present victim drugs (Kp, u, u=1 resulting from r>>1 and PSa=0) would all be outliers of Kp, u, u<1 and Kp, u, u>1, and this modification would not be necessary.
7. CONCLUSION
The present review summarizes our current achievements in DDI prediction. The main cause of the unusually large DDI between RAM and FLV was attributed to the extremely small vFh of RAM. Traditional DDI prediction assuming the well-stirred hepatic extraction kinetic ignores the relative increase of vFh by DDI, while we could solve this problem by use of the tube model. Finally, we completed a simple and useful method for prediction of DDI.
Currently, DDI prediction becomes more complex, making it difficult to respond to various issues. The regulatory agents recommend DDI prediction by use of PBPK methods. However, these are problematic in that they require plural in vitro data which reduce the flexibility and accuracy of the simulation. In contrast, our method is based on the static and two-comp models. The two-comp model has advantages in that it uses common PK parameters determined from actual clinical data, guaranteeing the simulation of the reference standard in DDI. Our studies confirmed that dynamic changes in perpetrator level do not make a difference between static and dynamic methods. The reported DDIs perpetrated by FLV and ITCZ were successfully predicted by use of the present method where two DDI predictors (pAi, CYPs and vfm, CYPs) are determined successively as shown in the graphical abstract. The results strongly suggested that DDI produced by a given victim and a standard inhibitor, or a given inhibitor and a standard victim, can be predicted in high confidence, with the aid of the existing DDI database.
This approach will accelerate prediction of DDI produced by NCEs, marking an improvement over the traditional methods.
Conflict of Interest
The authors declare no conflict of interest.
REFERENCES
- 1) Okuda H, Nishiyama T, Ogura K, Nagayama S, Ikeda K, Yamaguchi S, Nakamura Y, Kawaguchi K, Watabe T. Lethal drug interactions of sorivudine, a new antiviral drug, with oral 5-fluorouracil prodrugs. Drug Metab. Dispos., 25, 270–273 (1997).
- 2) “Guidance for Industry Drug Interaction Studies—Study Design, Data Analysis, Implications for Dosing, and Labeling Recommendations February. 2012 Clinical Pharmacology.”: <http://www.fda.gov/Drugs/GuidanceComplianceRegulatoryInformation/Guidances/default.htm>.
- 3) Prueksaritanont T, Chu X, Gibson C, Cui D, Yee KL, Ballard J, Cabalu T, Hochman J. Drug–drug interaction studies: regulatory guidance and an industry perspective. AAPS J., 15, 629–645 (2013).
- 4) Sager JE, Yu J, Ragueneau-Majlessi I, Isoherranen N. Physiologically based pharmacokinetic (PBPK) modeling and simulation approaches: a systematic review of published models, applications, and model verification. Drug Metab. Dispos., 43, 1823–1837 (2015).
- 5) Wagner C, Pan Y, Hsu V, Grillo JA, Zhang L, Reynolds KS, Sinha V, Zhao P. Predicting the effect of cytochrome P450 inhibitors on substrate drugs: analysis of physiologically based pharmacokinetic modeling submissions to the US Food and Drug Administration. Clin. Pharmacokinet., 54, 117–127 (2015).
- 6) Peters SA, Schroeder PE, Giri N, Dolgos HE. Evaluation of the use of static and dynamic models to predict drug–drug interaction and its associated variability: impact on drug discovery and early development. Drug Metab. Dispos., 40, 1495–1507 (2012).
- 7) Varma MV, Pang KS, Isoherranen N, Zhao P. Dealing with the complex drug–drug interactions: towards mechanistic models. Biopharm. Drug Dispos., 36, 71–92 (2015).
- 8) Isoherranen N, Lutz JD, Chung SP, Hachad H, Levy RH, Ragueneau-Majlessi I. Importance of multi-p450 inhibition in drug–drug interactions: evaluation of incidence, inhibition magnitude, and prediction from in vitro data. Chem. Res. Toxicol., 25, 2285–2300 (2012).
- 9) Templeton IE, Chen Y, Mao J, Lin J, Yu H, Peters S, Shebley M, Varma MV. Quantitative prediction of drug–drug interactions involving inhibitory metabolites in drug development: how can physiologically based pharmacokinetic modeling help? CPT Pharmacometrics Syst. Pharmacol., 5, 505–515 (2016).
- 10) Zhou S, Yung Chan S, Cher Goh B, Chan E, Duan W, Huang M, McLeod HL. Mechanism-based inhibition of cytochrome P450 3A4 by therapeutic drugs. Clin. Pharmacokinet., 44, 279–304 (2005).
- 11) Varma MV, Kimoto E, Scialis R, Bi Y, Lin J, Eng H, Kalgutkar AS, El-Kattan AF, Rodrigues AD, Tremaine LM. Transporter-mediated hepatic uptake plays an important role in the pharmacokinetics and drug–drug interactions of montelukast. Clin. Pharmacol. Ther., 101, 406–415 (2017).
- 12) Iga K. Use of three-compartment physiologically based pharmacokinetic modeling to predict hepatic blood levels of fluvoxamine relevant for drug–drug interactions. J. Pharm. Sci., 104, 1478–1491 (2015).
- 13) Iga K. Simulation of metabolic drug–drug interactions perpetrated by fluvoxamine using hybridized two-compartment hepatic drug-pool-based tube modeling and estimation of in vivo inhibition constants. J. Pharm. Sci., 104, 3565–3577 (2015).
- 14) Iga K. Dynamic and static simulations of fluvoxamine-perpetrated drug–drug interactions using multiple cytochrome P450 inhibition modeling, and determination of perpetrator-specific CYP isoform inhibition constants and fractional CYP isoform contributions to victim clearance. J. Pharm. Sci., 105, 1307–1317 (2016).
- 15) Iga K, Kiriyama A. Simulations of cytochrome P450 3A4-mediated drug–drug interactions by simple two-compartment model-assisted static method. J. Pharm. Sci., 106, 1426–1438 (2017).
- 16) Sateia MJ, Kirby-Long P, Taylor JL. Efficacy and clinical safety of ramelteon: an evidence-based review. Sleep Med. Rev., 12, 319–332 (2008).
- 17) Yao C, Levy RH. Inhibition-based metabolic drug–drug interactions: predictions from in vitro data. J. Pharm. Sci., 91, 1923–1935 (2002).
- 18) Ito K, Sugiyama Y. Use of clearance concepts and modeling techniques in the prediction of metabolic drug–drug interactions. Trends Pharmacol. Sci., 31, 351–355 (2010).
- 19) Yao C, Kunze KL, Trager WF, Kharasch ED, Levy RH. Comparison of in vitro and in vivo inhibition potencies of fluvoxamine toward CYP2C19. Drug Metab. Dispos., 31, 565–571 (2003).
- 20) Guest EJ, Rowland-Yeo K, Rostami-Hodjegan A, Tucker GT, Houston JB, Galetin A. Assessment of algorithms for predicting drug-drug interactions via inhibition mechanisms: comparison of dynamic and static models. Br. J. Clin. Pharmacol., 71, 72–87 (2011).
- 21) Gertz M, Harrison A, Houston JB, Galetin A. Prediction of human intestinal first-pass metabolism of 25 CYP3A substrates from in vitro clearance and permeability data. Drug Metab. Dispos., 38, 1147–1158 (2010).
- 22) Bruyère A, Declèves X, Bouzom F, Ball K, Marques C, Treton X, Pocard M, Valleur P, Bouhnik Y, Panis Y, Scherrmann JM, Mouly S. Effect of variations in the amounts of P-glycoprotein (ABCB1), BCRP (ABCG2) and CYP3A4 along the human small intestine on PBPK models for predicting intestinal first pass. Mol. Pharm., 7, 1596–1607 (2010).
- 23) Tsunoda SM, Velez RL, von Moltke LL, Greenblatt DJ. Differentiation of intestinal and hepatic cytochrome P450 3A activity with use of midazolam as an in vivo probe: effect of ketoconazole. Clin. Pharmacol. Ther., 66, 461–471 (1999).
- 24) Veronese ML, Gillen LP, Burke JP, Dorval EP, Hauck WW, Pequignot E, Waldman SA, Greenberg HE. Exposure-dependent inhibition of intestinal and hepatic CYP3A4 in vivo by grapefruit juice. J. Clin. Pharmacol., 43, 831–839 (2003).
- 25) Lilja JJ, Kivistö KT, Backman JT, Neuvonen PJ. Effect of grapefruit juice dose on grapefruit juice–triazolam interaction: repeated consumption prolongs triazolam half-life. Eur. J. Clin. Pharmacol., 56, 411–415 (2000).
- 26) Quinney SK, Zhang X, Lucksiri A, Gorski JC, Li L, Hall SD. Physiologically based pharmacokinetic model of mechanism-based inhibition of CYP3A by clarithromycin. Drug Metab. Dispos., 38, 241–248 (2010).
- 27) Templeton IE, Thummel KE, Kharasch ED, Kunze KL, Hoffer C, Nelson WL, Isoherranen N. Contribution of itraconazole metabolites to inhibition of CYP3A4 in vivo. Clin. Pharmacol. Ther., 83, 77–85 (2008).
- 28) Gorski JC, Jones DR, Haehner-Daniels BD, Hamman MA, O’Mara EM Jr, Hall SD. The contribution of intestinal and hepatic CYP3A to the interaction between midazolam and clarithromycin. Clin. Pharmacol. Ther., 64, 133–143 (1998).
- 29) Greenblatt DJ, Venkatakrishnan K, Harmatz JS, Parent SJ, von Moltke LL. Sources of variability in ketoconazole inhibition of human cytochrome P450 3A in vitro. Xenobiotica, 40, 713–720 (2010).
- 30) Yao HT, Chang YW, Lan SJ, Chen CT, Hsu JT, Yeh TK. The inhibitory effect of polyunsaturated fatty acids on human CYP enzymes. Life Sci., 79, 2432–2440 (2006).


