Regular Articles
Simultaneous Recordings of Central and Peripheral Bioelectrical Signals in a Freely Moving Rodent
2017 年 40 巻 5 号 p. 711-715
詳細
2017 年 40 巻 5 号 p. 711-715
Understanding physiological interactions between the central and peripheral nervous systems requires an experimental strategy to simultaneously monitor activity patterns of the brain and peripheral organs. In this study, we developed a novel method to record extracellular field potential signals from a wide range of brain regions together with electrocardiograms, electromyograms, and breathing signals from a freely moving rodent. This method collects all recorded signals into a single device mounted on an animal’s head, allowing the reduction of experimental costs and the simplification of data processing. The methodological concept is applicable to a number of biological research issues of how the brain–body association is altered in response to various environmental changes, emotional challenges, and acute and chronic dysfunction of internal organs.
Peripheral organ functions such as cardiovascular and respiratory activity are controlled by the autonomic nervous system. The autonomic nervous control of the peripheral organs practically depends on how the brain outputs to the autonomic nervous system against external conditions. However, most early studies have mainly focused on physiological events within a single organ and it thus remains largely unknown how the nervous system and peripheral organs physiologically interact with each other.
To address this issue, we hereby developed a recording method that comprehensively monitors electrical biosignals representing cardiac rhythm, breathing rhythm, awake/sleep-related muscle contraction, and collective neuronal activity of multiple brain regions (Fig. 1A). This recording method is based on a multichannel recording device for simultaneous monitoring of local field potential (LFP) signals from the brain tissue. In our previous study, we have reported a recording technique that could simultaneously monitor electrocardiogram (ECG), electromyogram (EMG), and LFP signals of restricted brain regions.1) In this study, we further improved this method by adding recording channels for monitoring breathing (BR) signals from the olfactory bulb, which can identify relative changes in BR frequency. Moreover, we increased the number of recording channels for monitoring brain LFP signals and electrocorticography (ECoG) by extending targetable recording sites from a single brain region to multiple regions. In this paper, we describe detailed procedures of our technique and present some representative data recorded from freely moving rats.
All experiments were performed with the approval of the animal experiment ethics committee at the University of Tokyo (approval number: P24-5) and according to the NIH guidelines for the care and use of animals. Male Wistar/ST rats (SLC, Shizuoka, Japan) with a preoperative weight of approximately 250 g (7 weeks old) were used in this study. The animals were maintained on a 12-h light/12-h dark schedule with lights off at 7 : 00 a.m.
Preparation of Recording DeviceA standard electrode assembly for brain LFP recording, called as a microdrive, was prepared as described previously2–4) (Fig. 1B). A microdrive consisted of a core body and an electrical interface board (EIB), which are commercially available from manufacturers such as Neuralynx and Open Ephys or custom designed. In this study, the core bodies were custom made by a three-dimensional (3-D) printer (MiiCraft, Young Optics, Hsinchu, Taiwan). An EIB possesses a sequence of metal holes, here termed as channels, to connect to wire electrodes. In our general setup, an EIB consisted of 16–64 LFP/ECoG channels, 2–4 ECG channels, 2–4 EMG channels, 2–4 BR channels, and 2 ground channels (Fig. 1C) and all signals from these channels were transferred to Omnetics connectors. An EIB was mounted on the top of a core body (Fig. 1B). A tetrode was used for brain LFP recording, which was constructed by bundling together four 17 µm polyimide-coated platinum–iridium (90/10%) wires (California Fine Wire, CA, U.S.A.) plated with platinum used to adjust electrode impedances to 150–300 kΩ. In our microdrive, up to 16 tetrodes can be accommodated into a core body and tetrodes were attached to metal screws on a core body so that they were independently movable. The open edges of tetrode wires were connected to LFP channels on the EIB with gold pins (Fig. 1C, gray arrows). To aid the reconstruction of the tracks left by tetrodes in the brain tissue, tetrodes were coated with DiI fluorophores that were applied by dipping the tetrode tips into a DiI solution (20 mg/mL, Invitrogen) dissolved in acetone for 60 s before insertion.
For recording peripheral signals, insulated wires with a length of ca. 5 cm were fixed to the 2–4 ECoG channels, 2–4 ECG channels, 2–4 EMG channels, 2–4 BR channels, and the 2 ground channels on the EIB with gold pins (Fig. 1C, colored arrows). The open edges of these wires protruded from the EIB, which were connected to the open edges of surgically implanted ECoG, ECG, EMG, BR, ground electrodes at the following surgery procedure.
SurgeryRats were anesthetized with 1–2% of isoflurane gas in air. Two incisions (ca. 1 cm) were made in both sides of the upper chest, and 2–4 ECG electrodes (stainless-steel wires; AS633, Cooner Wire Company, Chatsworth, CA, U.S.A.) were sutured to the incised tissues (Fig. 1D). Another incision (ca. 1 cm) was made at the dorsal neck area. The open-ended ECG electrodes were subcutaneously slipped along the animal’s back so that the ECG electrode tips protruded from the incised neck area. The first two incisions were then sutured. The animal was then fixed in a stereotaxic instrument with two ear bars and a nose clamp. A midline incision was made from the area between the eyes to the incised neck area and 2–4 EMG electrodes (stainless-steel wires; AS633, Cooner Wire Company) were sutured to the dorsal neck muscles (Fig. 1E). Circular craniotomies with a diameter of 1 mm were made using a high-speed drill. In the example shown in Fig. 1F, the coordinates of the craniotomies were 11.1 mm anterior and 0.3 mm bilateral to bregma for the olfactory bulb, 2.6 mm anterior and 2.6 mm bilateral to bregma for the frontal cortex, 1.5 mm posterior and 2.7 mm unilateral to bregma for the motor cortex, and 10.0 mm posterior and 1.9 mm unilateral to bregma for the cerebellum (Fig. 1F, cyan arrows). In the individual craniotomies, stainless-steel screws were implanted on the skull attached to the brain surface. The screws served as BR electrodes on the olfactory bulb, ECoG electrodes on the motor cortex and cerebellum, and ground electrodes on the frontal cortex. In addition, a larger circular craniotomy with a diameter of 1.5 mm (rat, 4.0 mm posterior and 2.7 mm lateral to bregma) was made (Fig. 1F, white arrow), and the microdrive was placed above the craniotomy with tetrodes inserted ca. 1.25 mm into the brain tissue (Fig. 1G). In this condition, the tetrodes were located at the middle layer of the somatosensory cortex. Finally, the open edges of the ECoG electrodes, ECG electrodes, EMG electrodes, BR electrodes, and ground electrodes were soldered to the open edges of the insulated wires protruded from the corresponding channels on the EIB. Finally, all these wires and the microdrive were secured to the skull using dental cement (Fig. 1H). After completing all these procedures, the anesthesia was terminated and the rats were spontaneously allowed to awake from the anesthesia. Following surgery, each animal was housed in a transparent Plexiglas cage with free access to water and food, with daily observation.
Electrophysiological RecordingWhen recording, the EIB on the animal’s head was connected to a digital headstage Cereplex M (Blackrock Microsystems, Salt Lake City, UT, U.S.A.), and the digitized signals were transferred to a data acquisition system Cereplex Direct (Blackrock Microsystems). Over a period of approximately 1 week after surgery, the tetrodes were lowered 25–100 µm per day to target brain regions determined by referencing individual LFP signals. This procedure was performed by rotating the screws attached on the individual tetrodes without introducing anesthesia. After the tetrodes reached the target area, recording began at a sampling rate of 30 kHz. Recordings were performed on a recording box (44×30 cm2) with a wall height of 35 cm. To monitor the rat’s moment-to-moment position, a blue light-emitting diode (LED) was attached to the headstage and the position of the LED signal was tracked at 30 Hz using a video camera, which was sampled by a laptop computer. Kainic acid was intraperitoneally applied at a concentration of 30 mg/kg.
Histology of the Brain TissueAt the end of the recording, the tetrodes were carefully removed from the brain. The rats were perfused intracardially with cold 4% paraformaldehyde (PFA) in 25 mM phosphate-buffered saline (PBS) and decapitated. The brains were coronally sectioned at a thickness of 200 µm, and coverslipped with Permount. Recordings were included in the data analysis if the DiI-labeled tetrode’s deepest position was in the targeted brain regions.
Data AnalysisLFP and ECoG traces were convolved by a Morlet’s wavelet family defined by a constant ratio of f0/σf=1/7, where f0 represents the frequency of interest, and σf is the bandwidth of the wavelet in the frequency domain. For the detection of hippocampal ripple events, hippocampal LFP traces were band-pass filtered at 150–250 Hz, and the root mean-square (RMS) power was calculated in the band with a bin size of 20 ms. The threshold for ripple detection was set to 3 standard deviations (S.D.s) above the mean. EMG traces were converted to RMS traces with a bin size of 1 s every 0.5 ms, which represents absolute changes in EMG amplitude relative to the baseline values. The threshold of EMG signal for the separation between awake and rest/sleep states was set to 100 in the case of Fig. 3. The threshold needs to be adjusted depending on EMG recording conditions. ECG traces were band-pass filtered at 2–200 Hz and beat-to-beat intervals (R–R interval) were calculated from the timestamp of the R-wave peak. The power spectrum was calculated by fast Fourier transformation and the power at low-frequency band (LF; 0.2–0.8 Hz) and the power of high-frequency band (HF; 0.8–3.5 Hz) were computed as the area under the spectrum within individual frequency ranges. HF and the ratio of LF to HF (LF/HF) were used as a measure of cardiac parasympathetic and sympathetic modulation, respectively.5–7) BR signals were low-pass filtered at 10 Hz and local maximum peaks were automatically detected. Instantaneous breathing rates were estimated based on the detected peaks. Periods with a breathing rate of more than 4 Hz were defined as sniffing. All analyses were performed in Matlab (Mathworks, MA, U.S.A.).
We developed a method to simultaneously capture bioelectrical signals from multiple organs, including the brain, cardiac system, breathing system, and skeletal muscle (Fig. 1A). All these systemic signals were integrated onto an EIB mounted on an animal’s head (Figs. 1B, C). A representative recording of body–brain bioelectrical signals from a freely moving rat is shown in Fig. 2. ECoG signals were obtained from multiple brain surface area, including the motor cortex, and cerebellum using stainless-screw electrodes (Figs. 1F, 2A), and LFP signals were obtained from the somatosensory cortex and hippocampal CA1 area using movable tetrodes (Figs. 1G, 2B). Compared with ECoG signals, LFP signals can provide higher signal-to-noise ratios. These extracellular signals generated from the brain tissue represent collective neuronal spikes and neurotransmission and exhibit various oscillatory activity of neuronal populations, such as gamma (40–150 Hz), theta (6–12 Hz), delta (1–4 Hz), and slow-wave (0.5–2.0 Hz) oscillations, which have been shown to correlate with arousal states and diverse behavior, such as sensory perception, attention, and memory. The power of neuronal oscillatory patterns can be computed by wavelet analysis as shown in the example below to the hippocampal LFP trace (Fig. 2B). In addition, the hippocampal LFP trace contained ripple events that could be detected from its band-pass (150–250 Hz) filtered trace. In peripheral area, ECG signals were recorded by implanting wire electrodes underneath the skin of the upper chest8–10) (Figs. 1D, 2C). Based on the intervals between R-peaks of the ECG signals, sympathetic and parasympathetic activity levels were estimated as LF/HF and HF computed by fast Fourier transformation, respectively.5–7) EMG signals reflecting muscle contraction were recorded by fixing wire electrodes to the dorsal neck muscle11,12) (Figs. 1E, 2D). The EMG trace was converted to their RMS values at individual time points, which have been used to define animal’s movement and arousal state.11,12) BR signals were recorded as ECoG signals from the olfactory bulb (Figs. 1F, 2E). We need to note that the ECoG signal of the olfactory bulb is not a complete reflection of breathing cycles due to an insufficient signal-to-noise ratio, meaning that a perfect estimation of absolute breathing rate from our BR signal cannot be achieved. Nonetheless, the BR signals enable a rough estimation of relative changes in breathing rates, and detection of sniffing, a typical exploratory behavior.
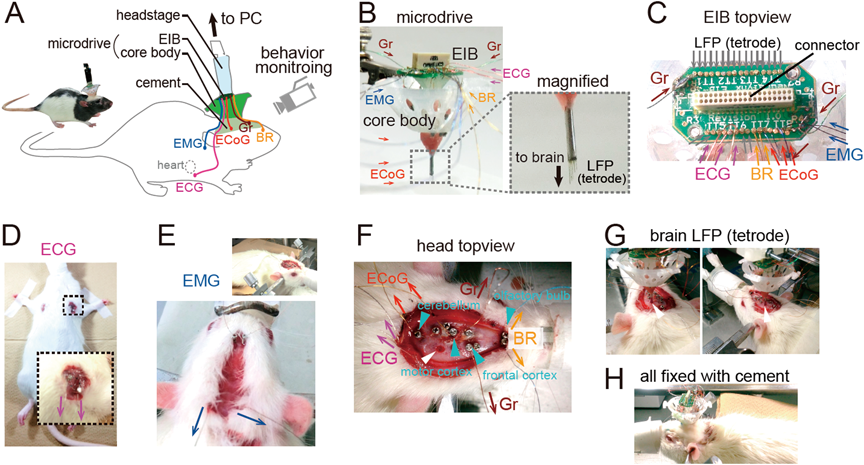
(A) Schematic illustration of the recording configuration from a freely moving rat. (B) (left) A microdrive contains a core body and an EIB. All bioelectrical signals are transferred to the EIB through insulated wires as indicated by colored arrows. The dotted box area is magnified in the right panel, showing some tetrodes with a length of 1.0–3.0 mm protruding from the microdrive. These tetrodes were inserted into the brain tissue for LFP recording. (C) An upper view of the EIB that accommodates 18 LFP channels that were connected to tetrodes, 3 ECoG channels, 3 ECG channels, 2 EMG channels, 2 BR channels, and 2 ground (Gr) channels that were connected to insulated wires. (D–H) Illustration of surgical procedures. (D) ECG electrodes were implanted under the skin around the bilateral upper chest of a Wistar/ST rat. The boxed region was magnified below. The magenta arrows indicate the directions of recorded ECG signals. (E) After the ECG implantation, the animal was stereotaxically fixed as shown in the top right panel and EMG electrodes were implanted in the dorsal neck muscle. The blue arrows indicate the directions of recorded EMG signals. (F) An upper view of the animal’s head. Stainless-steel screws were implanted (cyan arrowheads) on the skull above the olfactory bulb as BR electrodes (orange), the motor cortex and cerebellum as ECoG electrodes (red), and the frontal cortex as ground electrodes (brown). A large craniotomy was made for implanting tetrodes (white arrowhead). Notice that the open-ended ECG electrodes are also visible that were subcutaneously slipped along the animal’s back to the neck area (magenta). (G) The microdrive was placed on the craniotomy with tetrodes inserted into the brain tissue (white arrowhead). (H) The open edges of all electrodes were soldered to the open edges of the insulated wires protruding from the EIB. All of them were secured by white dental cement on the head.
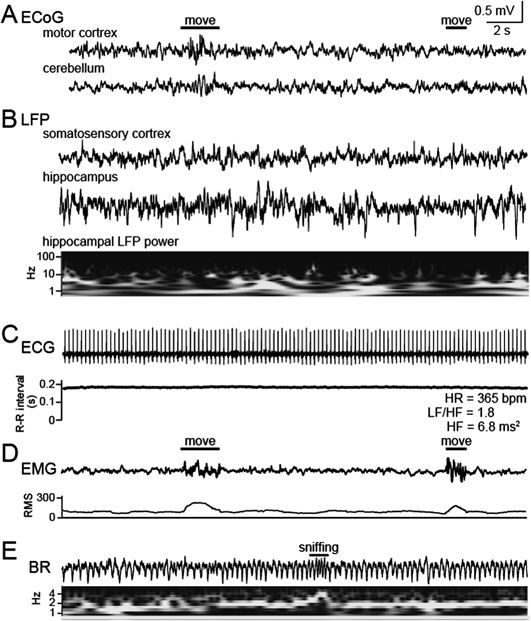
All traces were simultaneously recorded from a freely moving rat. (A) ECoG signals in the motor cortex and cerebellum. The amplitude of the two ECoG signals became transiently larger at the first movement but not the second movement, showing that these ECoG signals represent some but all movement. (B) LFP signals in the somatosensory cortex and hippocampal CA1 region. The hippocampal LFP trace was converted to the color-coded power spectrum shown below (black, lower power; white higher power). (C) An ECG signal with a heart rate (HR) of 365 bpm. Based on beat-to-beat intervals, LF/HF and HF were computed as sympathetic and parasympathetic activity levels, respectively. (D) An EMG signal. The trace was converted to its RMS to define arousal states. A large deflection of the signal is visible during transient movement. (E) A BR signal trace and the corresponding color-coded power spectrum. A transient increase in the breathing frequency was detected as sniffing.
An example dataset obtained from a rat showing behavioral transitions are presented in Fig. 3. In this case, the theta power of hippocampal LFP and the heart rate during awake state were higher than those during rest/sleep states.
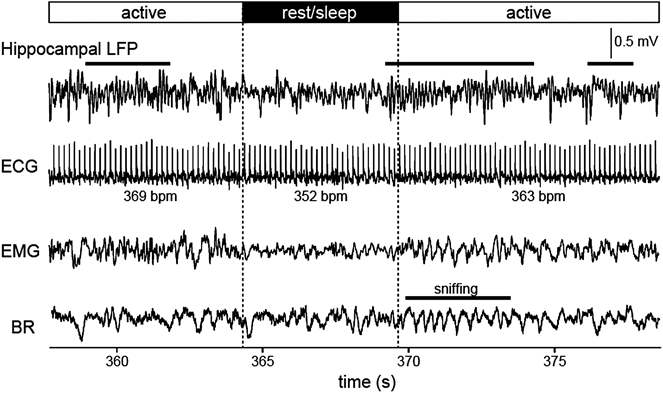
Hippocampal LFP, ECG, EMG, and breathing signals recorded while the animal was actively moving (active) or at a rest/sleep state in a recording box. Animal’s arousal states were defined based on the magnitude of the RMS. Typical theta (4–10 Hz) oscillation is apparent in the hippocampal LFP trace during periods indicated by horizontal black bars above.
As a demonstration of our method for the application to pathological studies, we present an example dataset recorded from a rat intraperitoneally injected with 30 mg/kg of kainic acid, a glutamate agonist at kainic acid receptors (Fig. 4). The administration of kainic acid induced ictal neocortical ECoG and hippocampal LFP signals with a pronounced decrease in the heart rate. The onset of ictal activity of the ECoG and LFP signals was time-locked with those of the EMG signal and the BR signal, but not ECG signal. This result suggests that brain ictal activity determines the muscle contraction and breathing rhythm whereas cardiac rhythm receives little impact from such brain signals. To more discuss exact mechanisms for this relationship, further experiments with pharmacological reagents or lesion of specific organs will be required.
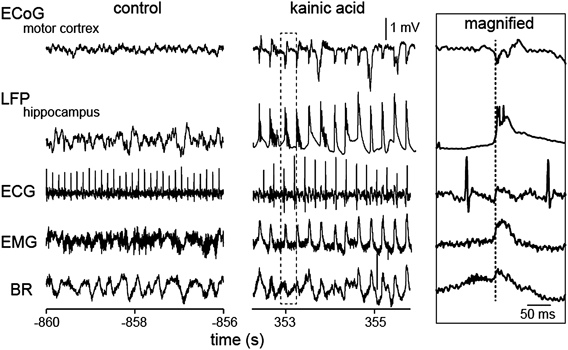
Spontaneous neocortical and hippocampal ictal activity emerges 30 min after the administration of kainic acid together with changes in peripheral organ activity. The dotted rectangular region is magnified in the rightmost inset. The vertical dotted line in the inset indicates the onset of ictal activity of the ECoG and LFP signals.
As demonstrated in this experiment, the recording technique will be useful to elucidate the neurophysiological correlate of mind–body associations in pathological conditions.
The brain and body interact closely with each other. The response of the central nervous system against external stimuli affects the autonomic control of peripheral organs. To understand detailed dynamics of brain–body interactions, a method to simultaneously monitor biological signals from the central and peripheral nervous systems is indispensable. To this end, we have previously developed a recording technique that can integrate an ECG signal on a LFP recording system that is generally used for multichannel recordings of brain LFP signals.1) Compared with the previous method, this study further improved the recording technique as follows: (1) all brain surface areas were targetable by using screw-shaped ECoG electrodes to the microdrive and (2) respiratory signals were simultaneously recorded by implanting electrodes on the olfactory bulb. The advancement enabled us to more accurately estimate systemic physiological responses in a single living animal. The advantage of our technique is that all signals derived from different organs can be collected into a small EIB without synchronizing multiple recording devices, leading to decreased experimental costs and increased efficiency of data collection and analysis. The concept and procedures of our technique are relatively simple and thus principally applicable to any combinations of the central and peripheral organs that generate electrical signals.
To our experience, our recording from a single animal is stable over at least 1 month. A number of unidentified questions related to mind–body communication in acute and chronic time periods can be addressed. For instance, many peripheral organs are affected by exposure to mental stress, which is mainly caused by abnormal signal transfer from the brain to the autonomic nervous system. Our method can directly capture such physiological responses against emotional challenge. As the other instance, activity levels of a peripheral organ may influence neuronal network activity in the brain. Such body-derived mind modulation and the roles of afferent peripheral nervous system are still largely unknown but will be more directly tested using our recording method. In conclusion, we expected our technique will help deepen our understanding of brain–body association to propose novel therapeutic strategies based on proper physiological evidence.
This work was supported by Kaken-hi (15H05569 and 15H01417), the Life Science Foundation of Japan, the Inoue Foundation, and the Public Health Research Foundation.
The authors declare no conflict of interest.