Abstract
Stimulatory G protein α-subunit (Gsα) mediated cAMP signal is required for elevated hepatic glucose production (HGP) in diabetic patients. However, it remains obscure of the exact characteristics of hepatic Gsα-cAMP signal axis (including Gsα, glucagon receptor, β2-adrenergic receptor, cAMP, phosphoenolpyruvate carboxykinase and glucose-6-phosphatase) in insulin resistance (IR) and type 2 diabetes mellitus (T2DM). In current study, we investigated the changing characteristics of hepatic Gsα-cAMP signal axis and blood glucose in high-sugar-high-fat (HSHF)-diet-induced IR Wistar rats and db/db diabetic mice. As expected, the HSHF-diet rats were characterized by hyperinsulinemia, hyperglycemia and impaired glucose tolerance. According to a threshold (1.7) of homeostasis model assessment ratio (HOMA-R), the process of IR in HSHF-diet rats could be divided into slight and high IR stages, with the week-23 as the cut-off point. In early slight IR stage, key molecules expressions of hepatic Gsα-cAMP signal axis in HSHF-diet rats were up-regulated with significantly elevated fasting blood glucose (FBG) from 18 to 23 weeks. Unexpectedly, in high IR stage, hepatic Gsα-cAMP signal axis was recovered comparatively to that of normal chow-diet rats, and no significant differences in FBG levels were found. However, in diabetic db/db mice, up-regulation of hepatic Gsα-cAMP signal axis was responsible for its severely increased fasting hyperglycaemia. Our data revealed a positive correlation between hepatic Gsα-cAMP signal axis and FBG in slight IR stage of HSHF-diet rats and diabetic db/db mice. The current finding thus suggested hepatic Gsα-cAMP signal axis plays a central role in regulating of FBG during the developing and development of T2DM.
Type 2 diabetes mellitus (T2DM), as a widespread metabolic disorder, is characterized by abnormal hyperglycemia resulting from the insulin resistance (IR) and/or impaired insulin secretion. As a pivotal insulin target tissue, liver plays a central role in the maintenance of systemic blood glucose homeostasis. In fasted state, liver generates glucose by increasing hepatic glucose production (HGP) from breakdown of glycogen and gluconeogenesis to maintain the systemic glucose demands. However, HGP will be suppressed in postprandial state, then excess glucose will be synthesized glycogen and stored in liver.1,2) However, hepatic IR that frequently found in prediabetic and type 2 diabetic patients had been proposed to be responsible for enhanced HGP, finally leading to fasting and postprandial hyperglycemia.3)
Stimulatory G protein α-subunit (Gsα) ubiquitously expressed in insulin target tissues including liver, adipose tissue and muscle. It couples several seven-transmembrane receptors (also known as G protein-coupled receptors, GPCRs) of hormones (such as glucagon, catecholamines and neurotransmitters, etc.) to adenylyl cyclase and mediates receptor-stimulated intracellular cAMP generation.4,5) Subsequently, cAMP mediates its effects primarily by activation of protein kinase A to enhance the transcription of genes encoding hepatic gluconeogenesis enzymes, phosphoenolpyruvate carboxykinase (PEPCK) and glucose-6-phosphatase (G6Pase), which finally increase circulating glucose.6) Increasingly evidence suggested that Gsα-mediated signaling pathway described above (also referred to as “Gsα-cAMP signal axis”) predominantly participates in HGP and insulin sensitivity.7,8) Tronche et al. found mice with lower Gsα expressions in cerebral cortex and cerebellum through central nervous system (CNS)-specific disruption of the paternal (pBrGsKO) or maternal (mBrGsKO) Gsα allele showed different phenotypes.9) pBrGsKO mice were hypermetabolic and lean, which also showed increased insulin sensitivity and suppressed endogenous HGP.10) In contrast, mBrGsKO mice were observed as severe obese and displayed lower energy expenditure and insulin resistant.8,10) However, Gsα deficiency in peripheral tissues mainly lead to increased insulin sensitivity. Liver-specific Gsα deficient mice (LGsKO) had improved insulin sensitivity and glucose tolerance, which were manifested by increased insulin secretion and glycogen synthesis, as well as decreased expression of PEPCK and G6Pase.11) Likewise, adipose-specific Gsα knockout mice (Ad-GsKO) also had improved glucose tolerance and insulin sensitivity,12) and these mice failed to develop obesity even feed with high-fat diet (HFD). Interestingly, Podolin et al. reported that the reduction of Gsα protein was concurrent with a decrease of intracellular cAMP production with age, which may account for age-related declines in hepatic gluconeogenesis in older animals and humans.13,14)
Although many reports focused on the role of Gsα deficiency in glucose metabolism, less attention had been paid on the dynamic characterizatics of hepatic Gsα-cAMP signal axis in the process from IR to T2DM, which are important to understand the pathophysiological mechanism of hepatic IR and may also contribute to the prevention and treatment of diabetes. Thus, the changing characterizatics of hepatic Gsα-cAMP signal axis were studied in chronic high-sugar-high-fat (HSHF) diet-fed obese Wistar rats and diabetic db/db mice.
MATERIALS AND METHODS
Animal CareMale Wistar rats (140–160 g) were purchased from Laboratory Animal Centre of Institute of Pharmacology and Toxicology (Beijing, China). Eight week-old male C57BL/KsJ-db/db mice (henceforth referred to as db/db mice) and wild-type (+/+) littermates were purchased from Model Animal Research Center of Nanjing University (Nanjing, China). All animals were maintained on a 12-h day/night schedule with ad libitum access to standard diet and water unless otherwise stated. After a standard diet for one week, the Wistar rats were fed either a normal chow (NC) diet, or a HSHF diet (60% fat, 20% carbohydrate and 20% protein as D12492; Research Diets, Inc., New Brunswick, NJ, U.S.A.). For the experiments, body weight, 8 h-fasted and 2 h-postprandial blood glucose of Wistar rats were monitored every two weeks. Serum biochemical parameters and protein expressions in liver of NC and HSHF-diet rats were measured after feeding for 5, 17, 23, 41 and 63 weeks, respectively. db/db mice and their littermates were respectively fed with the diabetogenic diet or NC diet until they were 12-week old. Serum samples and liver tissues were stored at −80°C for further biochemical or protein expression analysis.
All animal care and experiments were performed in accordance with the guidelines of the Animal Ethics Committee of the Academy of Military Medical Sciences, Beijing, China.
Intraperitoneal Glucose Tolerance Test (IPGTT)Rats were intraperitoneally injected with glucose (2.0 g/kg body weight (BW)) after 12-h fasting. Blood samples were collected from tail vein at 0, 15, 30, 60 and 120 min for measuring blood glucose using Biosen C-line Plus glucose analyzer (EKF Diagnostics, Barleben, Germany). The area under the concentration–time curve (AUC0–120 min) was calculated.
Blood Glucose, Serum Insulin, Serum Glucagon and Insulin Resistance IndexFasting and postprandial blood glucose of Wistar rats and db/db mice were measured using Biosen C-line plus glucose analyzer (EKF Diagnostics) and One Touch Ultra Meter (Johnson & Johnson, Milpitas, CA, U.S.A.) through the tail tip, respectively. Serum insulin and glucagon concentrations were assayed using commercially available rat endocrine Linco-plex kit (RENDO-85K, Millipore, MO, U.S.A.) or Milliplex Mouse Metabolic Magnetic Bead Panel (MMHMAG-44K, Millipore) in a Luminex 200™ plate reader (Luminex, Austin, TX, U.S.A.) according to the manufacturer’s specifications. Standards were plotted and concentrations determined using Milliplex Analyst software version 3.5.5. IR was assessed by the homeostasis model assessment ratio (HOMA-R) in the following equation: HOMA-R=glucose (mg/dL)×insulin (µU/mL)÷405.15)
Hepatic Protein Expression AnalysisFrozen liver samples were homogenized using a TissueLyser with 5-mm stainless steel beads (QIAGEN) for 30s at 26 Hz twice in ice-cold RIPA buffer (1 mM ethylenediaminetetraacetic acid (EDTA), 1% Triton X-100, 0.1% sodium dodecyl sulfate (SDS), 1 mM Na3VO4, 1 mM phenylmethylsulfonyl fluoride (PMSF), 10 mM pyrophosphate, 100 mM NaF, and 1 mg/mL bacitracin). After protein quantification by the bicinchoninic acid (BCA) assay kit, equal amount of proteins (ca. 30 µg) were separated by SDS-polyacrylamide gel electrophoresis (PAGE) and electrotransfered on a polyvinylidene difluoride (PVDF) membrane. Membranes were blocked in 5% milk and then respectively incubated primary antibodies overnight at 4°C. The primary antibodies were anti-Gsα, anti-glucagon receptor (GlucR) (Santa Cruz, U.S.A.), anti-β2-adrenergic receptor (ADRB2) (Bioss, Beijing, China), anti-PEPCK and anti-G6Pase (Cayman Chemical, U.S.A.). After incubation with corresponding peroxidase-coupled secondary antibodies, bound proteins were visualized by enhanced ECL (Applygen, Beijing, China) and detected using ChemImager 5500 system (Alpha lnnotech, San Leandro, CA, U.S.A.). The relative protein levels were calculated based on β-actin as the loading control.
cAMP ConcentrationLiver tissues were homogenized in ice-cold acetic acid buffer, and cAMP levels in liver were determined with the 125I-cAMP radioimmunoassay (RIA) kit (HY-089, Atomic Medicine Laboratory, University of Chinese Traditional Medicine, Shanghai, China) according to the manufacturer’s instructions. The amount of 125I-cAMP bound to the plate was determined using a liquid scintillation counter (GC-911, Zonkia Scientific Instruments).
Statistical AnalysisData are presented as the mean±standard deviation (S.D.). A two-way ANOVA was used for non-repeated measures design (diet×time). Individual groups are compared using one-way ANOVA followed by LSD post-hoc analysis. Statistical significance was set at p<0.05.
RESULTS
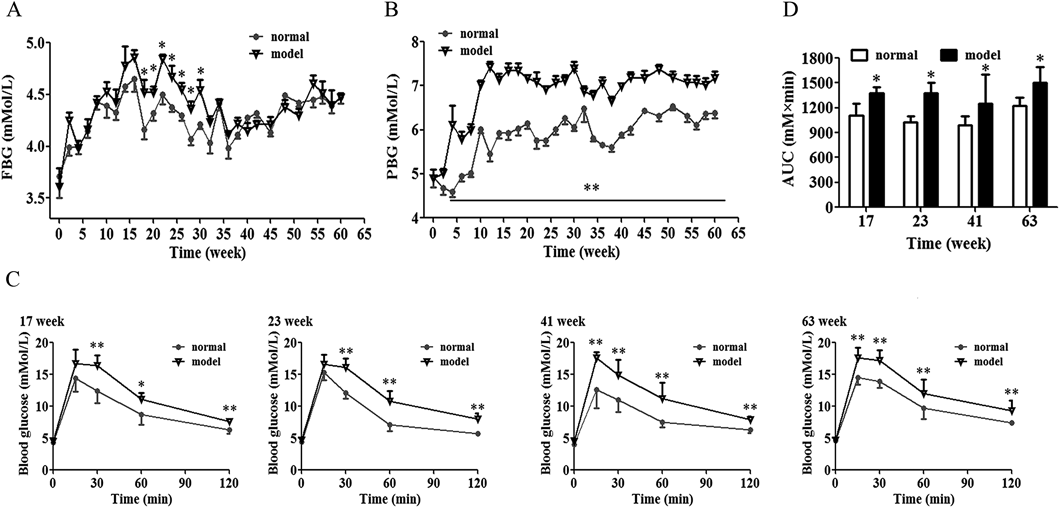
Body Weight, Blood Glucose and Glucose Intolerance in HSHF-Diet RatsTo imitate the natural pathogenesis and metabolic characteristics of human IR and T2DM, a chronic 63-weeks HSHF-diet-induced obese rat model was established. The HSHF-diet rats were significantly heavier and had more central abdominal fat than the control rats throughout the whole feeding period (Figs. S1A, B). FBG levels of rats fluctuated with the feeding time (Fig. 1A). It was slightly but significantly raised in HSHF-diet rats compared with NC-diet rats from 18 to 30 weeks, although postprandial hyperglycemia was apparently elevated after 4-week HSHF-diet feeding and continuously increased with the feeding time (Fig. 1B). Unexpectedly, no rat develops to overt diabetes even with long-term HSHF-diet challenge (FBG: 3.7–4.7 (NC) vs. 3.6–4.9 (HSHF) mmol/L).
Introperitoneal glucose tolerance test (IPGTT) that reflects the systemic insulin sensitivity was carried out. As shown in Fig. 1C, the blood glucose at 30 min after glucose injection in HSHF-diet rats at 17 and 23 weeks showed higher than those of matched control rats, whereas it was significant increased at 15, 30, 60, 120 min after glucose load in rats fed a HSHF-diet for 41 and 63 weeks compared to the NC-diet rats. The AUC(0–120 min) of HSHF-diet rats at 17, 23, 41 and 63 weeks were significantly greater than those of NC-diet rats (Fig. 1D).
Serum Insulin, Glucagon, Insulin to Glucagon Ratio and HOMA-R in HSHF-Diet RatsAs shown in Fig. 2A, fasted serum insulin levels in HSHF-diet rats at 5 weeks were significantly higher than those of the NC-diet rats (p<0.01), and the difference was growing larger with the increase of feeding time. In addition, we found that the normal rats also develop hyperinsulinemia with aging. The serum insulin levels of rats fed a NC-diet for 63-week were markedly increased compared to those of week-5 (p<0.01). As for the fasted serum glucagon levels, no obvious change at each time points was found between HSHF-diet rats and their corresponding NC-diet rats, except for a significant decrease in HSHF-diet rats at 63 week (p<0.01) (Fig. 2B). Further, we calculated the insulin/glucagon ratio (IGR) and HOMA-R value. As shown in Figs. 2C, D, the changes of IGR and HOMA-R were similar with those of serum insulin levels in NC- and HSHF-diet rats. HOMA-R was significantly increased in the HSHF-diet rats from week-5, further raised at week-23 with the value of 2.7, and persisted through week-63 compared to homochronous NC-diet rats. In addition, a significant increase of the HOMA-R value was found in NC-diet rats at 63-week relative to 5-week. These data indicated that IR was developed and further deteriorated with the continuous HSHF-diet and age in Wistar rats.
The Characteristics of Hepatic Gsα-cAMP Signal Axis in HSHF-Diet RatsTo investigate the characteristics of hepatic Gsα-cAMP signal axis induced by HSHF-diet, immunoblotting of the liver tissues were performed. As shown in Fig. 3A, expect for 41 week, Gsα expression of each indicated time in HSHF-diet rats significantly increased compared to that of NC-diet rats (p<0.01, p<0.05), although it maintained a high level at week-5, -17, -23 and reduced to low level at week-41 and -63. In NC-diet rats, the changes of Gsα expression displayed a convex parabola distribution, and only a significant increase of Gsα expression could be seen at week-23 compared to that of week-5 (p<0.01). Next, Gsα-coupled receptor for hormones, as represented by GlucR and ADRB2 that mainly participate in the gluconeogenic pathway, were also measured. As expected, the changes of GlucR and ADRB2 expression in HSHF-diet rats presented similar pattern to change of Gsα (Figs. 3B, C). After the Pearson correlation analysis of Gsα and GlucR or ADRB2, we found that Gsα expression was positive related to GlucR (r=0.946, p=0.015) or ADRB2 expression (r=0.899, p=0.038) in HSHF-diet rats. Furthermore, we found the changes of PEPCK expression, a downstream gluconeogenesis enzyme, in NC- and HSHF-diet rats were also closely parallelized with that of Gsα (Fig. 3D). G6Pase expressions, another key gluconeogenesis enzyme, were markedly elevated in HSHF-diet rats at all time points than the corresponding NC-diet rats (p<0.01, p<0.05) (Fig. 3E).
cAMP Production in HSHF-Diet RatscAMP is a pivotal second messenger in Gsα-cAMP signal axis. As shown in Fig. 4, compared to NC-diet rats, the cAMP contents in liver of HSHF-diet rats were increased at week-17 and -23, although no statistical differences were observed. However, compared with its basal levels at week 5, cAMP levels in HSHF-diet rats were significantly increased at week-17 and -23 (p<0.05) and were significantly decreased at week-41 and -63 (p<0.05). These decreased tendencies at week-41 and -63 were also present in the NC-diet rats (p<0.01).
Biochemical Parameters and Characterizations of Hepatic Gsα-cAMP Signal Axis in db/db MiceTo further disclose the characteristics of hepatic Gsα-cAMP signal axis in frank diabetes condition, diabetic db/db mice were investigated. At the time of study, db/db mice were over-weighted, hyperinsulinemia and hyperglucagonemia as previous reports,16–18) which had higher fasting hyperglycaemia level (30 mM) (Table 1). Meanwhile, the expressions of Gsα and its coupled receptors, GlucR and ADRB2, in the liver of db/db mice were significantly up-regulated when compared to their littermates (Figs. 5A–C). The expressions of G6Pase between these two groups were consistent, but PEPCK expression from the liver of db/db mice was twice as much as the littermates (Figs. 5D, E), which was consistent with the report by Davis.19) In addition, there was a slight increase in the cAMP concentration in the liver of db/db mice (Table 1).
Table 1. FBG, FINS, FGLU and cAMP Production in C57BL/KsJ and db/db Mice
| Group | N | FBG (mM/L) | FINS (ng/mL) | FGLU (pg/mL) | cAMP (nM) |
|---|
| C57BL/KsJ | 8 | 8.32±0.42 | 0.49±0.02 | U.D. | 2.48±0.06 |
| db/db | 8 | 30.01±0.82*** | 1.46±0.06*** | 22.03±3.26 | 2.64±0.22 |
Data are the mean±S.D., *** p<0.001 compared with C57BL/KsJ. FBG: fasting blood glucose; FINS: fasting serum insulin level; FGLU: fasting serum glucagon level; U.D.: underdetermined.
DISCUSSION
Clinically, IR may be manifested by glucose intolerance for decades before the diagnosis of T2DM. Thus, to mimic the natural chronic pathophysiological process of human IR and T2DM, we, for the first time, extend any previous short-term HSHF feeding in Wistar rats to a ca. 63 week period. Consistent with the report by Kraegen et al.20) the HSHF rats in current study exhibited obesity, IR and postprandial hyperglycemia after HSHF feeding for 5 weeks, and these continued to deteriorate till to the end of the experiment (63 weeks).
Postprandial hyperglycaemia or impaired oral glucose tolerance test (OGTT) seems to be better clinical predictors in early period of diagnosed diabetes.21) Our HSHF-diet rats exhibited indications of diabetes, such as increased postprandial blood glucose and impaired glucose intolerance. However, the FBG levels of HSHF-diet rats were only found significantly increased from week-18 to -30 relative to the NC-diet fed rats. And, no rat became overt diabetes even challenged with ca. 15-month HSHF-diet. These results did not contradict the report by Chalkley et al.22) where they found Wistar rats fed a high-fat diet for 10 months produced severe IR, but with only a mildly elevated FBG. In fact, we do not know whether these rats will finally get diabetes if the HSHF-diet feeding period was further extended. Additionally, another study indicated 32-week high-fat feeding induced elevated FBG only in some animals after a 24-h fast.23) The discrepancy among studies may be related with the slight difference of the high-fat diet recipe. High-fat diet rich in saturated fatty acids might be an important cause of high FBG in T2DM.22,23)
Glucose production and utilization are precisely regulated by a complex hormonal system, mainly including insulin and its counteracted hormones, glucagon and epinephrine, etc. Our present study showed that compared with NC-diet, HSHF-diet mainly caused a continuous increase of serum insulin in Wistar rats, yet without noticeably altered glucagon contents except for a decrease at week-63. In view of the results of FBG and hormones levels in whole process of the HSHF-diet-induced obese IR rat model, it can be suspected that the HSHF-diet rats in current study were mostly in a state of hyperinsulinemia, and the excessive insulin could suppress the secretion of glucagon and elevation of FBG. The above speculation were proved in our follow-up experiments, hematoxylin–eosin (H&E) staining and immunohistochemical analysis of insulin in pancreas sections revealed increased islet mass and insulin contents in HSHF-diet rats (data not shown). In addition, we calculated the value of HOMA-R to evaluate the degree of IR after feeding the HSHF-diet in Wistar rats. Although HSHF-diet induced worsening IR, we suggested that the whole HSHF-diet-induced IR stage was divided into two stage from 23 weeks, the slight IR status and high IR status, based on the HOMA-R threshold of 1.7.15)
Gsα/cAMP signaling pathway plays important role in regulation of HGP. In our HSHF-diet-induced IR rat model, we found a positive correlation between key molecules expressions of hepatic Gsα-cAMP signal axis and the fluctuations of FBG in HSHF-diet rats within the slight IR stage, that up-regulated hepatic Gsα-cAMP signal axis was accompanied with significant elevated FBG. Literature exploration suggested higher hepatic Gsα-cAMP signal axis in slight IR stage of HSHF-diet rats were normal and sensitive response to external HSHF-diet stimulation. To some extent, this active hepatic Gsα-cAMP signal axis could be regarded as a self-protection mechanism, in order to prevent the excessive energy accumulation in the liver and the occurrence of fatty liver. For instance, previous studies reported that sustained GlucR activation not only decreased food intake24,25) but also promoted lipolysis26) and weight loss.27) Loubna et al. also found increased ADRB2 expression in the liver of F28 mice could protect liver cells from apoptosis and lower the body mass index, mainly due to the ADRB2 linked increase of hepatic cAMP activity.28) Unexpectedly, there were some differences of hepatic Gsα-cAMP signal axis in high IR stage in HSHF-diet rats. The hepatic Gsα-cAMP signal axis was desensitized and almost reduced to that of normal chow-diet rats, in the face of chronic HSHF-diet stimulation. Consistent with the previous report by Charbonneau et al.29) Gsα, GlucR and ADRB2 levels in liver were decreased by HFD diet. We speculated that HSHF-diet or aging could accelerate the desensitization and destruction of the hepatic Gsα-cAMP signal axis, resulting in decreased HGP,13,30–33) and these reduced hepatic Gsα-cAMP signal axis would finally strengthen IR and was able to cause hepatic steatosis.29,33) This different tendency of hepatic Gsα-cAMP signal axis in progressing of IR also indicated that it is critical to select a suitable animal model in the research on different signaling molecules in IR.
In addition, in the genetic diabetic mice model, the hepatic Gsα-cAMP signal axis of db/db mice was over-activated at their 12-week old, which was consistent with previous studies,19,34,35) that the Gsα expression, GlucR number or ADRB2 binding sites, as well as PEPCK level in liver were increased than their respective lean controls. We think that this increased Gsα expression and activated Gsα-mediated signaling in liver were associated with pathologic states of non-insulin-dependent diabetes mellitus (NIDDM).36) However, whether the hepatic Gsα-cAMP signal axis would also be down-regulated if we extend the feeding period was still unclear, which need to be further verified.
In our study, we found the modest increases of hepatic cAMP production in either HSHF-diet rats or db/db mice could contribute to overactive Gsα-cAMP signal axis. As reported by Schiavon et al.37) a small increase in cAMP concentration could trigger a partial cAMP-mediated gluconeogenesis signal. In addition, cAMP level is dynamic and varies from minute-to-minute hormonal control including glucagon, insulin, and catecholamines, etc.6,38) suggesting that real time monitoring of cAMP production under some specific conditions worth further studying.
In conclusion, our discovery demonstrated the hepatic Gsα-cAMP signal axis were up-regulated and positively correlated with FBG in early IR stage (HOMA-R<1.7) and in overt T2DM period. These finding suggested that intervention of the hepatic Gsα-cAMP signal axis at these periods might be benefit for avoiding the occurrence of fasting hyperglycemia.
Acknowledgments
This study was supported by funds of National Science & Technology Major Project Key New Drug Creation and Manufacturing Program of China (No. 2009ZX09301-002; No. 2009ZX09501-031).
Conflict of Interest
The authors declare no conflict of interest.
REFERENCES
- 1) Cotrozzi G, Casini Raggi V, Relli P, Buzzelli G. Role of the liver in the regulation of glucose metabolism in diabetes and chronic liver disease. Ann. Ital. Med. Int., 12, 84–91 (1997).
- 2) Gerich JE. Role of liver in the pathogenesis of type II diabetes. Adv. Second Messenger Phosphoprotein Res., 24, 507–510 (1990).
- 3) Ferrannini E, Groop LC. Hepatic glucose production in insulin-resistant states. Diabetes Metab. Rev., 5, 711–726 (1989).
- 4) Weinstein LS, Yu S, Warner DR, Liu J. Endocrine manifestations of stimulatory G protein alpha-subunit mutations and the role of genomic imprinting. Endocr. Rev., 22, 675–705 (2001).
- 5) Yu S, Castle A, Chen M, Lee R, Takeda K, Weinstein LS. Increased insulin sensitivity in Gsalpha knockout mice. J. Biol. Chem., 276, 19994–19998 (2001).
- 6) Pilkis SJ, Claus TH, el-Maghrabi MR. The role of cyclic AMP in rapid and long-term regulation of gluconeogenesis and glycolysis. Adv. Second Messenger Phosphoprotein Res., 22, 175–191 (1988).
- 7) Chen M, Gavrilova O, Liu J, Xie T, Deng C, Nguyen AT, Nackers LM, Lorenzo J, Shen L, Weinstein LS. Alternative Gnas gene products have opposite effects on glucose and lipid metabolism. Proc. Natl. Acad. Sci. U.S.A., 102, 7386–7391 (2005).
- 8) Chen M, Nemechek NM, Mema E, Wang J, Weinstein LS. Effects of deficiency of the G protein Gsalpha on energy and glucose homeostasis. Eur. J. Pharmacol., 660, 119–124 (2011).
- 9) Tronche F, Kellendonk C, Kretz O, Gass P, Anlag K, Orban PC, Bock R, Klein R, Schutz G. Disruption of the glucocorticoid receptor gene in the nervous system results in reduced anxiety. Nat. Genet., 23, 99–103 (1999).
- 10) Chen M, Wang J, Dickerson KE, Kelleher J, Xie T, Gupta D, Lai EW, Pacak K, Gavrilova O, Weinstein LS. Central nervous system imprinting of the G protein G(s)alpha and its role in metabolic regulation. Cell Metab., 9, 548–555 (2009).
- 11) Chen M, Gavrilova O, Zhao WQ, Nguyen A, Lorenzo J, Shen L, Nackers L, Pack S, Jou W, Weinstein LS. Increased glucose tolerance and reduced adiposity in the absence of fasting hypoglycemia in mice with liver-specific Gs alpha deficiency. J. Clin. Invest., 115, 3217–3227 (2005).
- 12) Li YQ, Shrestha YB, Chen M, Chanturiya T, Gavrilova O, Weinstein LS. Gsalpha deficiency in adipose tissue improves glucose metabolism and insulin sensitivity without an effect on body weight. Proc. Natl. Acad. Sci. U.S.A., 113, 446–451 (2016).
- 13) Podolin DA, Wills BK, Wood IO, Lopez M, Mazzeo RS, Roth DA. Attenuation of age-related declines in glucagon-mediated signal transduction in rat liver by exercise training. Am. J. Physiol. Endocrinol. Metab., 281, E516–E523 (2001).
- 14) Ortiz-Alonso FJ, Galecki A, Herman WH, Smith MJ, Jacquez JA, Halter JB. Hypoglycemia counterregulation in elderly humans: relationship to glucose levels. Am. J. Physiol., 267, E497–E506 (1994).
- 15) Kaji M, Nomura M, Tamura Y, Ito S. Relationships between insulin resistance, blood glucose levels and gastric motility: an electrogastrography and external ultrasonography study. The Journal of Medical Investigation: JMI, 54, 168–176 (2007).
- 16) Laube H, Fussgänger RD, Maier V, Pfeiffer EF. Hyperglucagonemia of the isolated perfused pancreas of diabetic mice (db–db). Diabetologia, 9, 400–402 (1973).
- 17) Fujita H, Fujishima H, Morii T, Koshimura J, Narita T, Kakei M, Ito S. Effect of metformin on adipose tissue resistin expression in db/db mice. Biochem. Biophys. Res. Commun., 298, 345–349 (2002).
- 18) Bang CY, Choung SY. Enzogenol improves diabetes-related metabolic change in C57BL/KsJ-db/db mice, a model of type 2 diabetes mellitus. J. Pharm. Pharmacol., 66, 875–885 (2014).
- 19) Davis RC, Castellani LW, Hosseini M, Ben-Zeev O, Mao HZ, Weinstein MM, Jung DY, Jun JY, Kim JK, Lusis AJ, Peterfy M. Early hepatic insulin resistance precedes the onset of diabetes in obese C57BLKS-db/db mice. Diabetes, 59, 1616–1625 (2010).
- 20) Kraegen EW, Clark PW, Jenkins AB, Daley EA, Chisholm DJ, Storlien LH. Development of muscle insulin resistance after liver insulin resistance in high-fat-fed rats. Diabetes, 40, 1397–1403 (1991).
- 21) Avignon A, Radauceanu A, Monnier L. Nonfasting plasma glucose is a better marker of diabetic control than fasting plasma glucose in type 2 diabetes. Diabetes Care, 20, 1822–1826 (1997).
- 22) Chalkley SM, Hettiarachchi M, Chisholm DJ, Kraegen EW. Long-term high-fat feeding leads to severe insulin resistance but not diabetes in Wistar rats. Am. J. Physiol. Endocrinol. Metab., 282, E1231–E1238 (2002).
- 23) Han DH, Hansen PA, Host HH, Holloszy JO. Insulin resistance of muscle glucose transport in rats fed a high-fat diet: a reevaluation. Diabetes, 46, 1761–1767 (1997).
- 24) Geary N, Le Sauter J, Noh U. Glucagon acts in the liver to control spontaneous meal size in rats. Am. J. Physiol., 264, R116–R122 (1993).
- 25) Geary N. Pancreatic glucagon signals postprandial satiety. Neurosci. Biobehav. Rev., 14, 323–338 (1990).
- 26) Goodridge AG, Ball EG. Studies on the metabolism of adipose tissue. 18. In vitro effects of insulin, epinephrine and glucagon on lipolysis and glycolysis in pigeon adipose tissue. Comp. Biochem. Physiol., 16, 367–381 (1965).
- 27) Chan EK, Mackey MA, Snover DC, Schneider PD, Rucker RD Jr, Allen CE, Buchwald H. Suppression of weight gain by glucagon in obese Zucker rats. Exp. Mol. Pathol., 40, 320–327 (1984).
- 28) Erraji-Benchekroun L, Couton D, Postic C, Borde I, Gaston J, Guillet JG, Andre C. Overexpression of beta2-adrenergic receptors in mouse liver alters the expression of gluconeogenic and glycolytic enzymes. Am. J. Physiol. Endocrinol. Metab., 288, E715–E722 (2005).
- 29) Charbonneau A, Melancon A, Lavoie C, Lavoie JM. Alterations in hepatic glucagon receptor density and in Gsalpha and Gialpha2 protein content with diet-induced hepatic steatosis: effects of acute exercise. Am. J. Physiol. Endocrinol. Metab., 289, E8–E14 (2005).
- 30) Charbonneau A, Unson CG, Lavoie JM. High-fat diet-induced hepatic steatosis reduces glucagon receptor content in rat hepatocytes: potential interaction with acute exercise. J. Physiol., 579, 255–267 (2007).
- 31) Fraeyman N, van Ermen A. Influence of aging on the beta- and glucagon-receptor-mediated glycogenolysis in rat hepatocytes. Mech. Ageing Dev., 70, 115–126 (1993).
- 32) Van Ermen A, Fraeyman N. Desensitization of alpha 1-, beta- and glucagon receptors in rat hepatocytes: influence of ageing. Mech. Ageing Dev., 75, 45–58 (1994).
- 33) Podolin DA, Pagliassotti MJ, Gleeson TT, Mazzeo RS. Influence of endurance training on the age-related decline in hepatic glyconeogenesis. Mech. Ageing Dev., 75, 81–93 (1994).
- 34) Bégin-Heick N. Liver beta-adrenergic receptors, G proteins, and adenylyl cyclase activity in obesity-diabetes syndromes. Am. J. Physiol., 266, C1664–C1672 (1994).
- 35) Campos RV, Lee YC, Drucker DJ. Divergent tissue-specific and developmental expression of receptors for glucagon and glucagon-like peptide-1 in the mouse. Endocrinology, 134, 2156–2164 (1994).
- 36) Gettys TW, Ramkumar V, Surwit RS, Taylor IL. Tissue-specific alterations in G protein expression in genetic versus diet-induced models of non-insulin-dependent diabetes mellitus in the mouse. Metabolism, 44, 771–778 (1995).
- 37) Schiavon FP, Marques Ade C, Carrara MA, de Souza HM, Schamber CR, Curi R, Bazotte RB. Pivotal role of cAMP in the activation of liver glycogen breakdown in high-fat diet fed mice. Life Sci., 109, 111–115 (2014).
- 38) Panin LE, Kolosova IE. Effect of blood serum hormones and lipoproteins on levels of cAMP and cGMP in viable sections of rat liver. Probl. Endokrinol., 31, 69–73 (1985).