Abstract
Vancomycin hydrochloride (VCM) is a glycopeptide antibiotic that is commonly used against methicillin-resistant, Gram-positive cocci despite the nephrotoxic side effects. VCM-induced nephrotoxicity has been reported in 5–28% of recipient patients. Therefore, renal failure induced by VCM has become an important clinical problem. However, the exceedingly complex mechanism of VCM-induced nephrotoxicity is not fully understood. Therefore, this study was designed to clarify time-dependent alterations of VCM-induced nephrotoxicity in mice as a step toward decreasing the risks of kidney injury associated with VCM therapy. VCM was injected intraperitoneally into mice at a dose of 400 mg/kg body weight at 24-h intervals for 3, 5, 7, and 14 d. At 24 h after the last injection, we examined histopathological alterations of the kidney as well as blood biochemistry. VCM administration resulted in a decrease of body weight and increase of kidney weight. Histological examination revealed renal damage such as dilated proximal tubules with occasional casts and interstitial fibrosis in VCM-treated mice. Furthermore, immunohistochemical staining with anti-CD10 and anti-single-stranded DNA antibodies highlighted damaged renal proximal tubules with marked dilatation as well as numerous apoptotic cells as early as day 4 of VCM-treatment. The severity of symptoms progressed until day 15. These results suggest that VCM-induced renal damage and incipient renal failure begin soon after the start of treatment and progressively worsen. This is the first report describing the time-dependence of VCM-induced nephrotoxicity in mice and depicting a model that clarifies the mechanisms of this tissue damage.
Vancomycin hydrochloride (VCM) is a routinely prescribed antibiotic used to treat humans infected with methicillin-resistant Gram-positive cocci such as Staphylococcus aureus, S. epidermidis, and enterococci. Since the incidence of such infections has increased greatly in recent years, this medication is ever more widely distributed.1,2) VCM is excreted mainly via the kidney, where its damaging side effects occur.3) In fact, VCM-induced nephrotoxicity has been reported in 5–28% of recipient patients,4) constituting the major clinical issue of renal failure.
In the past decade, several clinical studies have tracked the duration of VCM-induced symptoms from the time of initial treatment until the emergence of renal failure.5–13) For instance, Pritchard et al.5) reported that renal failure began only 5.6 d after the initial VCM treatment and that a higher serum VCM concentration and prolonged VCM therapy were associated with increased risks of nephrotoxicity. Several clinical studies have used renal biopsies to demonstrate that patients given VCM developed renal failure at 2 to 39 d after the initial administration,5–13) which emphasizes that intervals vary between the time when treatment begins and VCM-induced renal failure follows. Moreover, short-term VCM administration, i.e., less than 7 d, produced acute tubular necrosis, whereas treatment lasting more than one week resulted in interstitial nephritis.
In rats, tubular necrosis and interstitial nephritis were observed by histological analysis when VCM was administered at a dose of 400 mg/kg body weight a day for 7 d.14–16) In mice, proximal tubular necrosis developed after 400 mg VCM a day/kg body weight was given for 7 d.17) Thus, the pathological features of VCM-induced nephrotoxicity using rats and mice were similar to those in humans. However, few reports have documented chronological alterations during the advancement of VCM-induced nephrotoxicity. Therefore, this investigation into the time-dependent alterations of VCM-induced nephrotoxicity in mice focuses on detailed biochemical and histological analysis of that process.
MATERIALS AND METHODS
AnimalsAnimal experiments were carried out in accordance with the animal care and use protocol approved by the Institutional Animal Care and Use Committee of Tokyo Metropolitan Institute of Gerontology (TMIG) (Permit Number: 12001) and in accordance with Guidelines for the Care and Use of Laboratory Animals of TMIG. Three month-old male mice of the C57BL/6NCrSlc strain were obtained from Japan SLC, Inc. (Shizuoka, Japan). All mice were fed a commercial chow diet (CRF-1, Oriental Yeast Co., Ltd., Tokyo, Japan) and maintained on a 12-h light/dark cycle in a controlled environment.
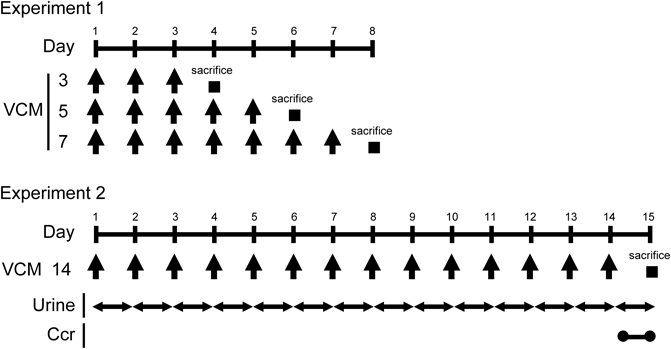
Administration of VCMVCM (Wako Pure Chemical Industries, Ltd., Osaka, Japan) was dissolved in saline and injected intraperitoneally into each mouse at a dose of 400 mg/kg body weight at 24-h intervals for 3 (n=5), 5 (n=5), 7 (n=5), and 14 (n=8) d as shown in Fig. 1 (Experiments 1 and 2). The same volume of saline was injected intraperitoneally at 24-h intervals for 3 (n=5), 5 (n=4), 7 (n=5), and 14 (n=9) d as a control. At 24 h after the last injection, mice were sacrificed and blood from the inferior vena cava of each mouse was drawn into an ethylenediaminetetraacetic acid (EDTA)-containing syringe. Plasma was obtained by centrifuging the blood samples at 880×g for 10 min at 4°C followed by storage at −80°C until use. Mice were then perfused systemically with ice-cold phosphate buffered saline through the left ventricle to remove the remaining blood in tissues. Kidneys were removed and then weighted.
Collection of UrineFor the collection of urine, mice were housed individually in metabolic cages (Tecniplast Japan Co., Ltd., Tokyo, Japan) and injected intraperitoneally with VCM daily for 14 d (Fig. 1, Experiment 2). The collected urine was measured every day and stored at −80°C until use.
Biochemical Analysis of Plasma and UrineBlood urea nitrogen (BUN), plasma creatinine (P-Cre), plasma aspartate aminotransferase (AST), plasma alanine aminotransferase (ALT), plasma lactase dehydrogenase (LD), plasma sodium (Na), plasma phosphorus (P), plasma potassium (K), and urine creatinine (U-Cre) were analyzed biochemically (Oriental Yeast Co., Ltd., Tokyo, Japan). Creatinine clearance (Ccr) was calculated according to the following equation; Ccr=U-Cre×urine volume/P-Cre.
Histological AnalysisEach kidney was divided equally into longitudinal sections and fixed with 10% formalin (Wako Pure Chemical Industries, Ltd.) for 48 h. Each formalin-fixed kidney was embedded in paraffin and finally cut serially into 4 µm-thick section. After deparaffinization, the kidney sections were subjected to hematoxylin–eosin (H&E), periodic acid Schiff (PAS), and Azan stainings. Digital images of all specimens were captured by using the virtual slide imaging system, NanoZoomer 2.0-RS (Hamamatsu Photonics, Hamamatsu, Japan). For estimation of renal tubular and glomeruli size, tubules and glomeruli of kidney sections stained with H&E were randomly selected one hundred in each VCM and control groups, and the minor axis of each was measured by using the NDP.view2 (Hamamatsu Photonics). The number of casts in renal tubules and tubular epithelial desquamations was counted in five randomly selected fields at 1 mm2 of kidney sections stained with H&E and PAS, respectively. Percentages of interstitial fibrosis-positive areas were measured in five randomly selected fields at 0.3 mm2 of kidney sections stained with Azan by using WinROOF Ver7.4.1 image analysis software (MITANI Corporation, Fukui, Japan).
ImmunohistochemistryThe kidney sections were stained by using anti-CD10 antibody (1 : 400 dilutions, Tecniplast Japan Co., Ltd., Tokyo, Japan), anti-single-stranded DNA (ssDNA) antibody (1 : 400 dilutions, DAKO Japan Co., Ltd., Tokyo, Japan), and the VECTASTAIN Elite ABC kit (VECTOR Laboratories, Inc., Burlingame, CA, U.S.A.); 3,3′-diaminobenzidine was the chromogenic substrate. Sections were also subjected to H&E counterstaining. The number of CD10-positive, dilated proximal tubules was counted in five randomly selected fields at 1 mm2 of kidney sections stained with anti-CD10 antibody.
Statistical AnalysisResults are expressed as mean±standard error of the mean (S.E.M.). Statistical analysis was performed using The two-tailed Student’s t-test was used for daily comparisons of VCM and control groups in terms of body and kidney weights as well as BUN, P-Cre, AST, ALT, LD, Na, P, K, and Ccr. Two-way ANOVA followed by Bonferroni’s post hoc comparisons were used to assess urine volume and measure minor axes of renal tubules and glomeruli as well as number of casts. All statistical analyses were performed using GraphPad Prism 6 (GraphPad Software Inc., San Diego, CA, U.S.A.). Statistical differences were considered significant at p<0.05.
RESULTS
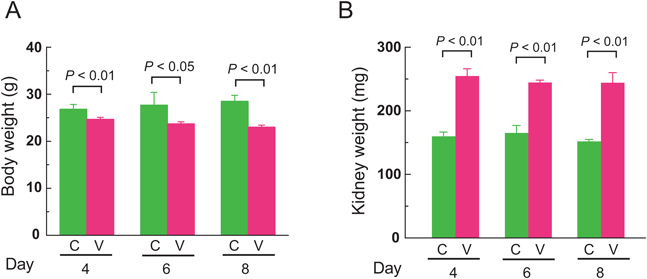
Body Weights and Kidney Weights of VCM-Treated MiceVCM or saline as a control were injected intraperitoneally into subject mice at 24-h intervals for 7 d (Fig. 1, Experiment 1). Simultaneously, their body weights were assessed on the 4th, 6th, and 8th days of treatment (Fig. 2A). Day 8 refers to the period 24 h after the final VCM injection. The mean body weights of VCM-treated mice gradually decreased on the progressive days, to 24.7±0.4, 23.7±0.4, and 23.0±0.4 g, respectively, on days 4, 6, and 8. In contrast, control mice manifested slight weight gains to mean levels of 26.8±0.5, 27.7±1.3, and 28.5±0.6 g, respectively, on days 4, 6, and 8. Overall, the mean body weights of VCM-treated mice were significantly greater than those of control mice at 4, 6, and 8 d (p<0.01, p<0.05, and p<0.01, respectively). Moreover, kidney weights of mice at 4, 6, and 8 d of VCM-treatment were a significant 1.6-, 1.5-, and 1.6-fold higher than those of control mice, respectively (p<0.01, p<0.01, and p<0.01, respectively) (Fig. 2B).
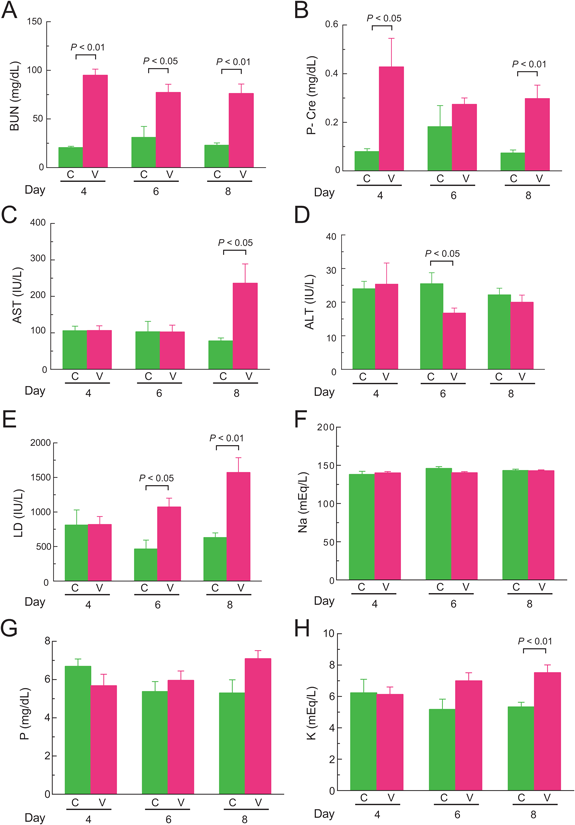
Biochemical Analysis of PlasmaBUN levels of mice after 4, 6, and 8 d of VCM-treatment were a significant 4.6-, 2.5-, and 3.3-fold higher than those of control mice, respectively (p<0.01, p<0.05, and p<0.01, respectively) (Fig. 3A). P-Cre levels of VCM-treated mice at the 4th and 8th days were a significant 5.4- and 4.0-fold higher than those of control mice, respectively (p<0.05 and p<0.01, respectively), although no significant difference was observed at 6 d (Fig. 3B). Although AST levels of VCM-treated mice at 8 d was a significant 3.0-fold higher than those of control mice (p<0.05), there were no differences between those two groups at 4 and 6 d (Fig. 3C). ALT levels of VCM-treated mice at 6 d were significantly lower than those of control mice (p<0.05), but they did not differ at 4 and 8 d (Fig. 3D). LD levels of VCM-treated mice at 6 and 8 d were significantly higher by 2.3- and 2.5-fold than those of control mice, respectively (p<0.05 and p<0.01, respectively), but there was no difference at 4 d (Fig. 3E). No significant differences were observed in Na and P levels at 4, 6, and 8 d between VCM-treated and control mice (Figs. 3F, G). However, K levels of VCM-treated mice at 8 d rose a significant 1.4-fold above those of control mice (p<0.01), whereas no significant difference was present at 4 and 6 d between VCM-treated and control mice (Fig. 3H).
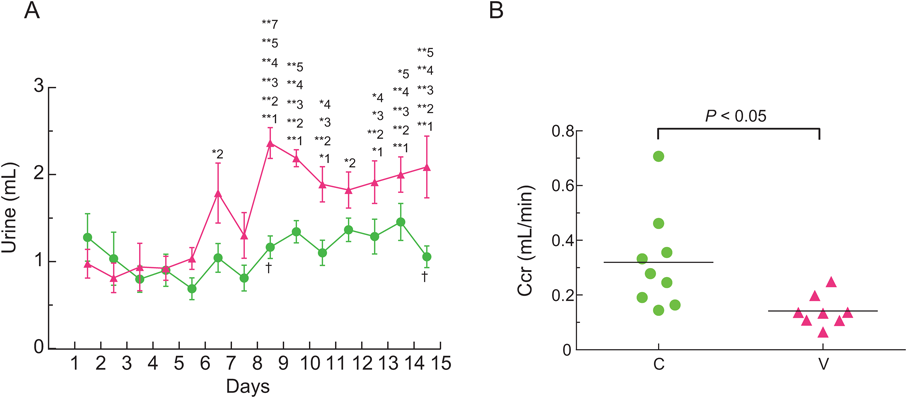
Ccr of VCM-Treated MiceUrine volumes of VCM-treated mice gradually increased as the days passed, and the urine volume for 24-h from day 14 to 15 was higher by a significant 2.1-fold than that from the first to second day (interaction: F(13, 195)=3.133, p=0.0003) (Fig. 4A). Yet, no significant difference was observed in the urine volumes of control mice during the experiment. Moreover, the Ccr from day 14 to 15 of VCM-treated mice was significantly lower than that of control mice (p<0.05), and mean Ccr values of VCM-treated and control mice were 0.14±0.02 and 0.32±0.06 mL/min, respectively (Fig. 4B).
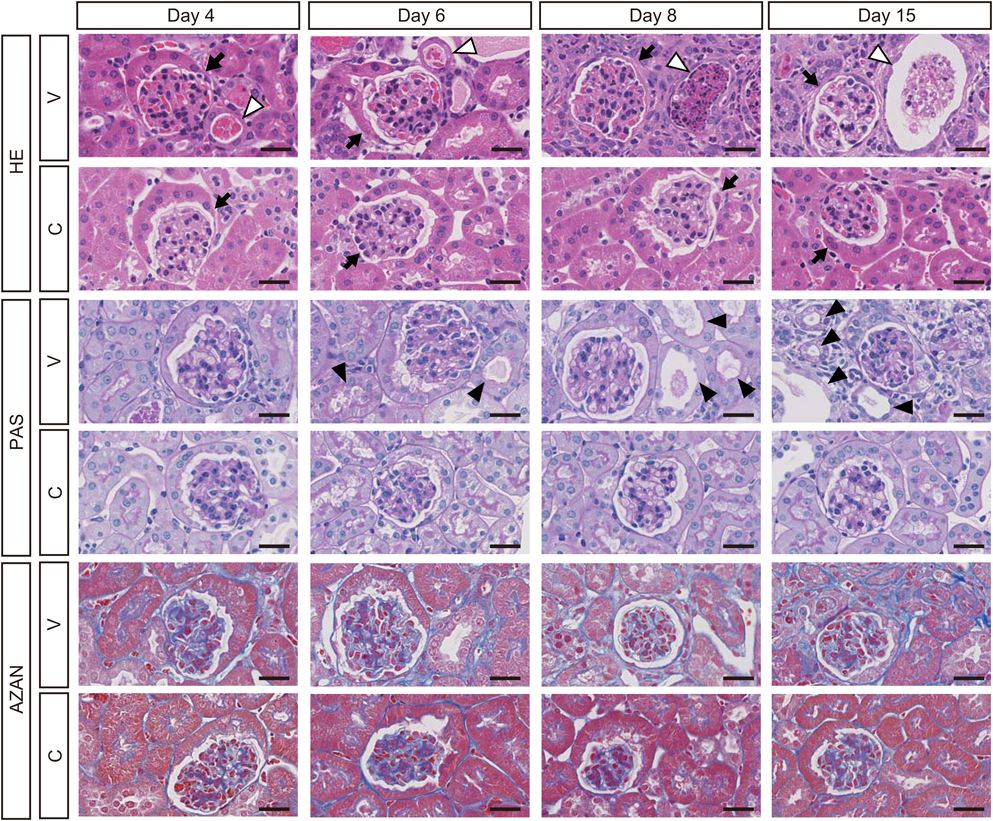
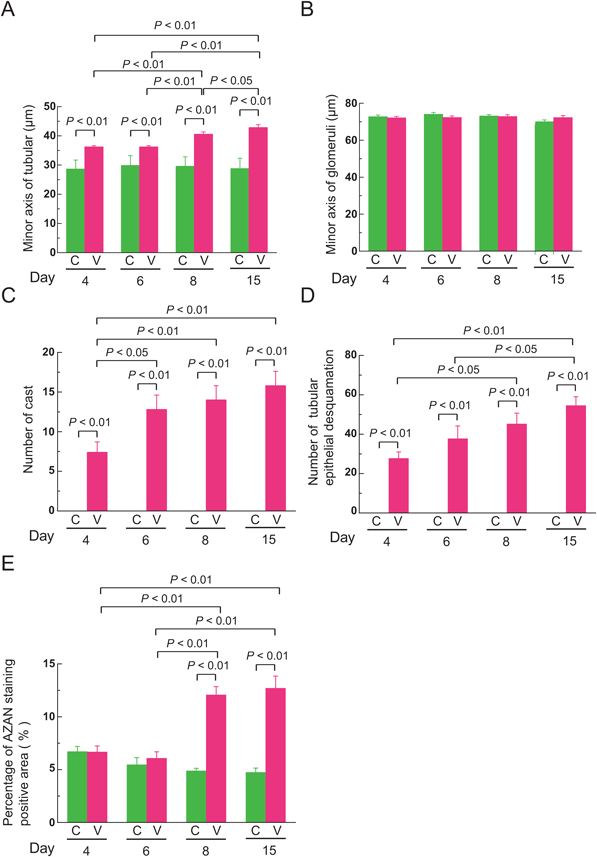
Histological Analysis of Kidneys and Livers of VCM-Treated MiceH&E staining revealed renal damage in the form of dilated renal tubules (Fig. 5, open arrowheads and Supplementary Fig. S1) in which casts appeared at the 4th day of VCM-treatment, and the damage gradually became more severe at 6, 8, and 15 d. Minor axes of renal tubules in VCM-treated mice, when examined at 4, 6, 8, and 15 d had markedly greater impairment, i.e., to a significant 1.3-, 1.2-, 1.4-, and 1.5-fold higher extent than those of control mice, respectively (interaction: F(3, 792)=19.71, p<0.0001) (Fig. 6A). Moreover, minor axes of renal tubules in VCM-treated mice at 15 d were significantly more damaged (1.2-, 1.2- and 1.1-fold) than in VCM-treated mice at 4, 6 and 8 d, respectively; even at the 8th day after VCM treatment began, minor axes of renal tubules were in significantly worse condition (1.1- and 1.1-fold) than in the VCM-treated mice at 4 and 6 d, respectively (Fig. 6A). In minor axes of glomeruli at 4, 6, 8, and 15 d, changes were minimal in VCM-treated compared to control mice (Fig. 6B). However, the number of casts in renal tubules from VCM-treated mice at 6, 8, and 15 d was significantly higher, i.e., by 1.7-, 1.9- and 2.1-fold, than those of VCM-treated mice at 4 d, respectively (interaction: F(3, 32)=4.457, p=0.01) (Fig. 6C), although renal tubules of control mice had no detectable casts at 4, 6, 8, and 15 d (Fig. 6C).
PAS staining revealed tubular epithelial desquamation at the 6th day of VCM-treatment and continuously became more severe at 8 and 15 d (Fig. 5, closed arrowheads). The number of tubules manifesting epithelial desquamation from VCM-treated mice at 8 and 15 d was significantly higher, i.e., by 1.6- and 2.0-fold, than those of VCM-treated mice at 4 d, respectively (interaction: F(3, 24)=4.266, p=0.0150) (Fig. 6D), although control mice had no detectable tubular epithelial desquamation at 4, 6, 8, and 15 d (Fig. 6D). Furthermore, Azan staining showed interstitial fibrosis in kidneys of mice at 8 and 15 d of VCM-treatment (Figs. 5, 6E). Percentages of interstitial fibrosis-positive areas from VCM-treated mice at 8 and 15 d was significantly higher, i.e., by 2.5- and 2.7-fold, than those of control mice, respectively (interaction: F(3, 24)=32.37, p<0.0001) (Fig. 6E). On the other hand, no damage was distinguishable in livers and gastrocnemius muscle of VCM-treated mice by histological analysis of H&E staining (Supplementary Fig. S2).
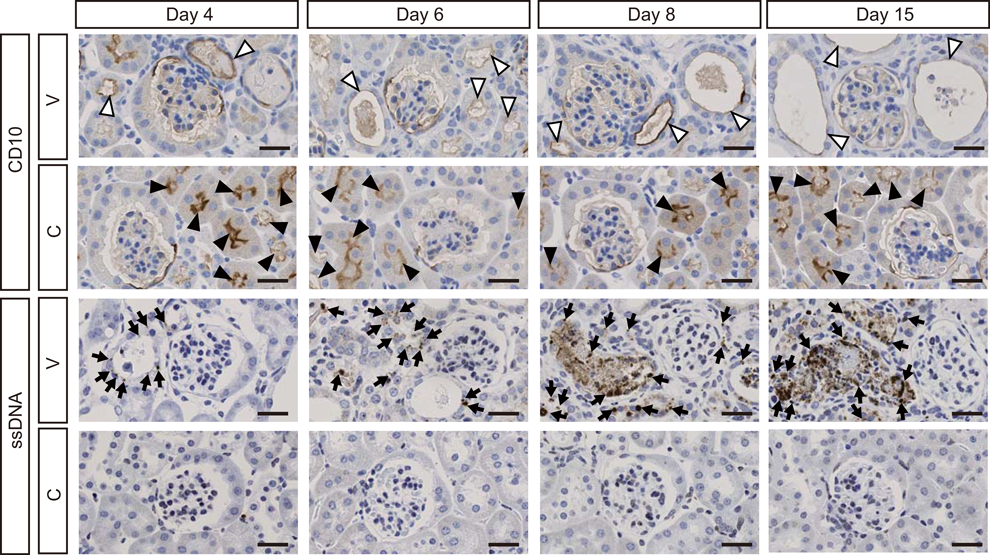
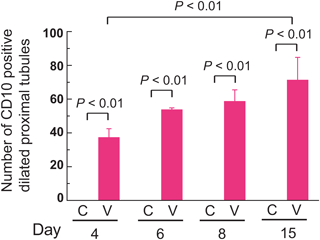
Immunohistochemical Staining of CD10 in Kidneys of VCM-Treated MiceTo clarify the location of damaged renal tubules, we performed immunohistochemical staining with CD10, which is a marker of proximal tubules.18) Accordingly, CD10 revealed dilation of renal proximal tubules at the 4th day of VCM treatment and gradual worsening at 6, 8, and 15 d (Fig. 7). The number of CD10-positive, dilated proximal tubules from VCM-treated mice at 15 d was higher by a significant 1.9-fold than those of VCM-treated mice at 4 d (interaction: F(3, 24)=3.527, p=0.0301) (Fig. 8), although control mice had no detectable CD10-positive, dilated proximal tubules at 4, 6, 8, and 15 d (Fig. 8).
Detection of Apoptotic Cells in Kidneys of VCM-Treated MiceImmunohistochemically, numerous ssDNA-positive apoptotic cells or bodies were predominant in dilated renal tubules of mice at day 4 of VCM-treatment and underwent increases at 6, 8, and 15 d (Fig. 7). Moreover, numbers of apoptotic cells observed in the casts at day 4 of VCM injections gradually increased at 6, 8, and 15 d (Fig. 7). However, no apoptotic cells were observed in the kidneys of control mice (Fig. 7).
DISCUSSION
In this study, we investigated the time-dependent alterations of VCM-induced nephrotoxicity in mice and observed the indisputable renal damage induced by this treatment. These pathologic effects began soon after the inception of VCM inoculations and progressed markedly with each passing day. These results closely resembled those of clinical and pathological studies in human.
The administration of VCM into mice resulted in decreased body weights and increased kidney weights observed from day 4 after treatment started. The cause of this decrease in body weight after VCM administration was considered to be dehydration from renal failure, and the related increases of kidney weight evidently resulted from edema. Indeed, renal damage such as dilated renal tubules and the appearance of casts therein was observed at 4 d of VCM treatments. No previous reports have described time-dependent alterations of body and kidney weights in association with VCM treatment. Moreover, we observed increased BUN and P-Cre levels in plasma of mice at 4 d of VCM treatment. These results indicate that the kidneys must begin to fail even at the first few days of VCM administration.
Plasma AST and LD levels after 8 d of VCM treatment in mice were significantly higher than those of control mice, which did not receive VCM, but there was no difference in plasma ALT levels. No previous animal studies of VCM14–16) have identified hepatopathy and myopathy as an outcome. Accordingly, after administering VCM, we performed thorough histological analysis but found no distinguishable damage in the liver and gastrocnemius muscle even after 15 d of treatment (Supplementary Fig. S2). Nevertheless, VCM-related damage might occur in tissues other than those examined in this study.
The urine volume of VCM-treated mice gradually increased with the passage of time. These increases of urine volume after VCM administration were considered to denote an impaired ability to excrete concentrated urine because of renal failure. Moreover, Ccr on the 14th to 15th day after VCM treatment of mice was significantly lower than that of control mice. This is the first report to document a time-dependent alteration of urine volume and Ccr lasting more than one week after VCM administration in mice.
In humans, many reports have described episodes of renal failure after an initial VCM treatment. For instance, Wicklow et al.8) and Sokol et al.7) observed the onset of renal failure at 2 and 3 d, respectively, after VCM administration. In this current study, VCM-induced renal damage was clear upon histochemical examination of kidneys as early as 4 d after treatment began. Therefore, our results in mice are in accordance with the onset of renal failure in humans.
Histologically, interstitial fibrosis was observed at 8 and 15 d of VCM treatment in mice. Interstitial fibrosis developing in the kidney as a result of VCM administration was considered a byproduct of prolonged inflammation from renal failure. Moreover, immunohistochemical staining using anti-CD10 antibody, which is known as a specific indicator of human proximal tubules,18) revealed that renal proximal tubules were markedly dilated at 4 d of VCM treatment in mice and continuously deteriorated. Furthermore, immunohistochemical staining with ssDNA, which is a marker of apoptosis,19) revealed apoptotic cells presumably derived from proximal tubular epithelial cells in dilated renal tubules of mice at day 4 of VCM treatment, again with progressive worsening. Interestingly, apoptotic cells were also observed in the casts of renal tubules at 4 d of VCM treatment, and the number of casts in VCM-treated mice at 15 d was a significant 2.1-fold higher than that of VCM-treated mice at 4 d. Collectively, these results strongly suggest that VCM administration induced apoptosis of epithelial cells in proximal tubules, forming a part of casts within those tubules by sloughing of apoptotic tubular epithelium.
Although the precise mechanism of VCM-induced nephrotoxicity is still unclear, elevated oxidative stress by VCM administration may be one of the triggers that cause renal damage. In fact, an increase of oxidative stress in hypoxia is involved in renal tubular damage that instigates renal fibrosis.20) Also, Arimura et al. reported that VCM caused the increased production of intracellular reactive oxygen species by inactivation of mitochondrial complex I in cultured LLC-PK1 cells.21) Thus, the enabler of VCM-induced nephrotoxicity may be increased oxidative stress leading to renal damage.
In conclusion, renal failure caused by VCM administration in mice was observed early in the treatment process and progressed thereafter. Moreover, histological and immunohistochemical analyses revealed specific sites of renal damage such as dilated renal proximal tubules with occasional casts and interstitial fibrosis. These results are consistent with those derived from clinical and pathological studies in humans. This is the first report to document the time-dependent alterations of VCM-induced nephrotoxicity in mice. Moreover, this model in mice is exceedingly useful for clarifying the little known mechanism of VCM-induced nephrotoxicity.
Acknowledgments
The authors thank Ms. P. Minick for the excellent English editorial assistance. This study is supported by the Japan Society for the Promotion of Science (JSPS) KAKENHI Grant Number 15H04505 and 15K15104 (Ishigami A.).
Conflict of Interest
The authors declare no conflict of interest.
Supplementary Materials
The online version of this article contains supplementary materials.
REFERENCES
- 1) Rodvold KA, Everett JA, Pryka RD, Kraus DM. Pharmacokinetics and administration regimens of vancomycin in neonates, infants and children. Clin. Pharmacokinet., 33, 32–51 (1997).
- 2) Nishino Y, Takemura S, Minamiyama Y, Hirohashi K, Tanaka H, Inoue M, Okada S, Kinoshita H. Inhibition of vancomycin-induced nephrotoxicity by targeting superoxide dismutase to renal proximal tubule cells in the rat. Redox Rep., 7, 317–319 (2002).
- 3) Wood MJ. The comparative efficacy and safety of teicoplanin and vancomycin. J. Antimicrob. Chemother., 37, 209–222 (1996).
- 4) Iwamoto T, Kagawa Y, Kojima M. Clinical efficacy of therapeutic drug monitoring in patients receiving vancomycin. Biol. Pharm. Bull., 26, 876–879 (2003).
- 5) Pritchard L, Baker C, Leggett J, Sehdev P, Brown A, Bayley KB. Increasing vancomycin serum trough concentrations and incidence of nephrotoxicity. Am. J. Med., 123, 1143–1149 (2010).
- 6) Rybak M, Lomaestro B, Rotschafer JC, Moellering R Jr, Craig W, Billeter M, Dalovisio JR, Levine DP. Therapeutic monitoring of vancomycin in adult patients: a consensus review of the American Society of Health-System Pharmacists, the Infectious Diseases Society of America, and the Society of Infectious Diseases Pharmacists. Am. J. Health Syst. Pharm., 66, 82–98 (2009).
- 7) Sokol H, Vigneau C, Maury E, Guidet B, Offenstadt G. Biopsy-proven anuric acute tubular necrosis associated with vancomycin and one dose of aminoside. Nephrol. Dial. Transplant., 19, 1921–1922 (2004).
- 8) Wicklow BA, Ogborn MR, Gibson IW, Blydt-Hansen TD. Biopsy-proven acute tubular necrosis in a child attributed to vancomycin intoxication. Pediatr. Nephrol., 21, 1194–1196 (2006).
- 9) Wu CY, Wang JS, Chiou YH, Chen CY, Su YT. Biopsy proven acute tubular necrosis associated with vancomycin in a child: case report and literature review. Ren. Fail., 29, 1059–1061 (2007).
- 10) Htike NL, Santoro J, Gilbert B, Elfenbein IB, Teehan G. Biopsy-proven vancomycin-associated interstitial nephritis and acute tubular necrosis. Clin. Exp. Nephrol., 16, 320–324 (2012).
- 11) Hong S, Valderrama E, Mattana J, Shah HH, Wagner JD, Esposito M, Singhal PC. Vancomycin-induced acute granulomatous interstitial nephritis: therapeutic options. Am. J. Med. Sci., 334, 296–300 (2007).
- 12) Salazar MN, Matthews M, Posadas A, Ehsan M, Graeber C. Biopsy proven interstitial nephritis following treatment with vancomycin: a case report. Conn. Med., 74, 139–141 (2010).
- 13) Wai AO, Lo AM, Abdo A, Marra F. Vancomycin-induced acute interstitial nephritis. Ann. Pharmacother., 32, 1160–1164 (1998).
- 14) Öktem F, Arslan MK, Ozguner F, Candir O, Yilmaz HR, Ciris M, Uz E. In vivo evidences suggesting the role of oxidative stress in pathogenesis of vancomycin-induced nephrotoxicity: protection by erdosteine. Toxicology, 215, 227–233 (2005).
- 15) Cetin H, Olgar S, Oktem F, Ciris M, Uz E, Aslan C, Ozguner F. Novel evidence suggesting an anti-oxidant property for erythropoietin on vancomycin-induced nephrotoxicity in a rat model. Clin. Exp. Pharmacol. Physiol., 34, 1181–1185 (2007).
- 16) Ocak S, Gorur S, Hakverdi S, Celik S, Erdogan S. Protective effects of caffeic acid phenethyl ester, vitamin C, vitamin E and N-acetylcysteine on vancomycin-induced nephrotoxicity in rats. Basic Clin. Pharmacol. Toxicol., 100, 328–333 (2007).
- 17) Dieterich C, Puey A, Lyn S, Swezey R, Furimsky A, Fairchild D, Mirsalis JC, Ng HH. Gene expression analysis reveals new possible mechanisms of vancomycin-induced nephrotoxicity and identifies gene markers candidates. Toxicol. Sci., 107, 258–269 (2009).
- 18) Shen SS, Truong LD, Scarpelli M, Lopez-Beltran A. Role of immunohistochemistry in diagnosing renal neoplasms: when is it really useful? Arch. Pathol. Lab. Med., 136, 410–417 (2012).
- 19) Naruse I, Keino H, Kawarada Y. Antibody against single-stranded DNA detects both programmed cell death and drug-induced apoptosis. Histochemistry, 101, 73–78 (1994).
- 20) Yamaguchi J, Tanaka T, Eto N, Nangaku M. Inflammation and hypoxia linked to renal injury by CCAAT/enhancer-binding protein delta. Kidney Int., 88, 262–275 (2015).
- 21) Arimura Y, Yano T, Hirano M, Sakamoto Y, Egashira N, Oishi R. Mitochondrial superoxide production contributes to vancomycin-induced renal tubular cell apoptosis. Free Radic. Biol. Med., 52, 1865–1873 (2012).