Abstract
Although calcineurin is abundantly expressed in the nervous system and involved in neurite extension and synaptic plasticity in neurons, little is known about its roles in glial cells. To investigate the roles of calcineurin in glial cells, we generated glial calcineurin B1-conditional knockout (CKO) mice and analyzed the abnormalities in the small intestine. The CKO mice were generated by crossing floxed calcineurin B1 mice with glial fibrillary acidic protein (GFAP)-Cre mice. The CKO mice exhibited growth retardation approximately from the third postnatal week and died mostly within the fourth postnatal week. The small intestine of the CKO mice was thin and hemorrhagic. The mucosal layer was degenerated and GFAP expression was reduced in the CKO small intestine. These pathological changes were associated with inflammation and increased intestinal permeability. In contrast, no apparent abnormalities were observed in the large intestine of the CKO mice. Nuclear factor of activated T cells failed to translocate into the nucleus after stimulation in enteric glial cells of the CKO small intestine. In conclusion, the calcineurin B1 deficiency in glial cells impairs the small intestine and leads to malnutrition and eventual death in mice, suggesting that calcineurin plays a novel and important role in enteric glial cells.
Calcineurin (CN), also called protein phosphatase 3 (formerly 2B), is a Ca2+/calmodulin-dependent serine/threonine protein phosphatase which is a heterodimer composed of A (catalytic) and B (regulatory) subunits.1) There are three isoforms of CNA (α, β, and γ) and two isoforms of CNB (B1 and B2) in mammals. CNAα, CNAβ, and CNB1 are ubiquitously distributed in mammalian tissues, but are highly enriched in the central nervous system (CNS). CNAγ and CNB2 are specifically expressed in the testis. In the CNS, CN regulates a number of neuronal processes, including neurite extension, synaptic transmission and plasticity, and learning and memory.2–4)
On the other hand, several studies showed that CN has functions not only in neurons, but also in glial cells in the CNS. CN is activated in response to intracellular Ca2+ elevation in astrocytes, the major type of CNS glial cells, leading to the activation of nuclear factor of activated T cells (NFAT).5–8) Furthermore, astrocytic activation of CN is suggested to be involved in neural diseases such as Alzheimer’s disease.9–12) Glial cells play important roles in the structure and function of the nervous system by supporting and regulating neurons.13–16) In contrast to recent interest in the roles of CN in glial cells in the CNS, very little is known about the roles of CN in glial cells in the peripheral nervous system, especially in the enteric nervous system (ENS).
Enteric glial cells (EGCs) are beginning to be recognized as one of the important cell types in the ENS. They support enteric neurons mechanically and trophically, modulate enteric neurotransmission, and control immune and inflammatory processes in the gut.17–22) Furthermore, EGCs are demonstrated to be involved in maintenance of intestinal barrier function and regulation of intestinal permeability.19–21,23,24) These findings suggest that dysfunction of EGCs may cause enteric diseases such as inflammatory bowel disease. However, the precise normal functions of EGCs, as well as their contribution to enteric diseases, are poorly understood.
To investigate the roles of CN in glial cells in the nervous system including the ENS, we knocked out CNB1 (Ppp3r1), the only regulatory subunit of CN in the nervous system, in glial cells by crossing floxed CNB1 mice25) with glial fibrillary acidic protein (GFAP)-Cre mice.26) These conditional knockout (CKO) mice exhibited dysfunction of EGCs, mucosal degeneration and inflammation in the small intestine, growth retardation, and eventual death, thus suggesting a novel and important role of CN in EGCs.
MATERIALS AND METHODS
AnimalsCNB1-CKO mice were generated by crossing floxed CNB1 mice25) with GFAP-Cre mice,26) both of which were purchased from the Jackson Laboratory (Bar Harbor, ME, U.S.A.; Stock No. 006581 and 004600, respectively). Genotyping was performed by PCR using primer pairs 5′-CAA CAC CAG AAA CTC TGT CAT G-3′/5′-GCA CCA CTA TCA TAC TGG TCT-3′ for CNB1 and 5′-GTC GAT GCA ACG AGT GAT GA-3′/5′-AGC ATT GCT GTC ACT TGG TC-3′ for Cre. The second generation of offspring obtained by crossing the two founder strains was used in this study. Because homozygous Cre transgenic mice are embryonically lethal for unknown reasons, homozygous floxed and heterozygous Cre transgenic mice were used as the CKO mice. All of the other genotypes were used as controls. Mice were usually fed standard dry pellets (CE-2; CLEA Japan, Tokyo, Japan). In some experiments (Fig. 2E), they were fed wet mash food prepared by mixing the powder form of the pellets with approximately two-and-a-half times the weight of sterilized water after postnatal day 17.5. As a reporter strain, we used Rosa26-GNZ knockin mice (Stock No. 008606; Jackson Laboratory).27) After crossing these mice with GFAP-Cre mice, homozygous GNZ knockin and heterozygous Cre transgenic (Rosa26-GNZ; GFAP-Cre) mice were used for analysis.
Animal experiments were carried out in accordance with the National Institutes of Health Guide for the Care and Use of Laboratory Animals revised 1996, and approved by the animal care and use committee of Nagoya City University. All efforts were made to minimize the number of animals used and their suffering.
Culture of Cerebellar AstrocytesThe cerebella were dissected from the CKO and control mice on postnatal day 4 in a 1 : 1 mixture of phosphate-buffered saline (PBS) and Eagle’s basal medium with Hank’s salts (dissection medium). After removal of the meninges and cutting them into pieces of approximately 0.5 mm length with scalpel blades, the tissues were incubated for 15 min at 37°C in PBS containing 0.2% trypsin (Sigma-Aldrich, St. Louis, MO, U.S.A.) and 20 U/mL deoxyribonuclease I (Sigma-Aldrich). After adding fetal bovine serum (Sigma-Aldrich) and washing in fresh dissection medium, the tissues were triturated with a P1000 pipette (Gilson, Middleton, WI, U.S.A.) and suspended in Dulbecco’s minimum essential medium (Thermo Fisher Scientific, Waltham, MA, U.S.A.) supplemented with 10% fetal bovine serum (culture medium). After centrifugation (170×g, 2 min, 4°C), the cell pellet was resuspended in 2 mL of the culture medium and strained through a 70-µm nylon mesh filter (Corning, Corning, NY, U.S.A.), which produced a cell suspension at a concentration of approximately 8×10⁵ cells per mL. Two milliliters of the cell suspension was plated on a culture dish 60 mm in diameter, the bottom of which was coated with poly-L-lysine (molecular weight 30000–70000; Sigma-Aldrich). After 1-h incubation, 2 mL of the culture medium was added to each dish. The cultures were incubated at 37°C in 5% CO2/95% air. After 6-d culture, cells were harvested in PBS containing 0.2% trypsin and 0.5 mM ethylenediaminetetraacetic acid (EDTA), replated, and cultured in the same medium.
RT-PCRPoly(A)+ RNA was extracted from cerebellar astrocytes subcultured for 7 d using the illustra QuickPrep Micro mRNA Purification Kit (GE Healthcare, Little Chalfont, Buckinghamshire, U.K.) and served as templates for cDNA synthesis with SuperScript III First-Strand Synthesis System (Invitrogen/Thermo Fisher Scientific). The cDNA obtained was then amplified by RT-PCR with Taq DNA polymerase (Taq Standard; Greiner, Frickenhausen, Germany for CNB1 or FastStart Taq; Roche, Mannheim, Germany for CNAα). Primer pairs used were 5′-TAT TCG ACA CAG ACG GCA AC-3′/5′-CAG CAC AGA ATT CCT CAA AGG-3′ for CNB1 and 5′-CAA GGC GAT TGA TCC CA-3′/5′-TCG AAG CAC CCT CTG TTA-3′ for CNAα.28) The PCR conditions were an initial denaturation at 95°C for 2 (CNB1) or 4 (CNAα) min, 40 cycles of amplification (95°C for 30 s, 42°C (CNB1) or 40°C (CNAα) for 30 s, 72°C for 50 s), and a final extension at 72°C for 7 min. The PCR products were electrophoresed in a 1.5% agarose gel and stained with ethidium bromide.
Western BlottingTo obtain protein samples from cerebellar astrocytes, cerebellar astrocytes subcultured for 7 d were lysed in ice-cold suspension buffer (100 mM NaCl, 10 mM Tris–HCl (pH 7.6), 1 mM EDTA, 1 µg/mL aprotinin, 100 µg/mL phenylmethylsulfonyl fluoride) and an equal volume of 2× lysis buffer (100 mM Tris–HCl (pH 6.8), 10% 2-mercaptoethanol, 4% sodium dodecyl sulfate (SDS)). To obtain protein samples from the small intestine, the small intestine (approximately 2–2.5 cm in length) was dissected from the CKO and control mice on postnatal day 20–27, opened, deprived of the mucosa using a glass slide, and minced in ice-cold suspension buffer and an equal volume of 2× lysis buffer. The cell lysates or minced tissues were boiled for 10 min and sonicated for 30 s (Handy Sonic UR-20P; Tomy Seiko, Tokyo, Japan). After the lysates were centrifuged (10000×g, 10 min, 4°C), the supernatants were electrophoresed on 12% SDS-polyacrylamide gels. Proteins were transferred to polyvinylidene difluoride membranes (Immun-Blot; Bio-Rad, Hercules, CA, U.S.A.) with an electroblotter. After blocking with 1% nonfat dry milk, the membranes were probed with a rabbit anti-CNB1 (1 : 8000; custom-made against a peptide ADEIKRLGKRFKKLDLDC by Sigma-Aldrich), mouse anti-CNA (1 : 100000; C1956, Clone CN-A1; Sigma-Aldrich), mouse anti-GFAP (1 : 4000; #270825, Clone G-A-5; Seikagaku, Tokyo, Japan), or mouse anti-β-actin (1 : 20000; A5441, Clone AC-15; Sigma-Aldrich) antibody. A horseradish peroxidase-conjugated goat anti-rabbit immunoglobulin G (IgG) (1 : 1000; Santa Cruz Biotechnology, Dallas, TX, U.S.A.) or anti-mouse IgG (1 : 1000; Medical & Biological Laboratories, Nagoya, Japan) antibody was used as a secondary antibody. The immunoreactivity was detected by enhanced chemiluminescence (Amersham ECL Western Blotting Analysis System; GE Healthcare) using a luminescent image analyzer (LAS-3000mini; FUJIFILM, Tokyo, Japan). For quantification, we obtained 12 blots from seven pairs of control and CKO mice, and measured the intensity of each band using ImageJ Ver. 1.50 software (National Institutes of Health, Bethesda, MA, U.S.A.). The intensity of GFAP bands was normalized by that of β-actin bands and shown as the relative band intensity to the control.
Immunohistochemistry of the Myenteric PlexusThe muscle strips with the myenteric plexus (MSMP) were isolated in PBS by stripping the mucosa away from the small intestine of Rosa26-GNZ; GFAP-Cre mice on postnatal day 20–24 or the CKO and control mice on postnatal day 20–27 using fine forceps. After fixation for 30 min in PBS containing 4% paraformaldehyde (Acros Organics/Thermo Fisher Scientific), they were preincubated for 60 min in PBS containing 0.5% Mouse Ig Blocking Reagent (Vector Laboratories, Burlingame, CA, U.S.A.) and 0.3% Triton X-100.
For triple fluorescent immunohistochemistry against green fluorescent protein (GFP), Sox10, and HuC/D, the specimens were incubated overnight at 4°C in PBS containing a rabbit anti-GFP antibody (1 : 2000; #598; Medical & Biological Laboratories), a goat anti-Sox10 antibody (1 : 400; sc-17342; Santa Cruz Biotechnology), and a mouse anti-HuC/D antibody (1 : 400; A21271, Clone 16A11; Molecular Probes/Thermo Fisher Scientific). Subsequently, they were incubated overnight at 4°C in PBS containing Cy2-conjugated donkey anti-rabbit IgG (1 : 1600), Cy3-conjugated donkey anti-goat IgG (1 : 1600), and Cy5-conjugated donkey anti-mouse IgG (1 : 1200) antibodies (Jackson ImmunoResearch, West Grove, PA, U.S.A.).
For double fluorescent immunohistochemistry against PGP9.5 and GFAP, the specimens were incubated overnight at 4°C in PBS containing a rabbit anti-PGP9.5 antibody (1 : 4000; AB5925; Chemicon/Millipore, Temecula, CA, U.S.A.) and a mouse anti-GFAP antibody (1 : 800; Seikagaku). Subsequently, they were incubated overnight at 4°C in PBS containing a HiLyte Fluor 555-conjugated goat anti-rabbit IgG antibody (1 : 1600; AnaSpec, Fremont, CA, U.S.A.) and a Cy2-conjugated goat anti-mouse IgG antibody (1 : 800; Jackson ImmunoResearch).
For fluorescent immunohistochemistry against HuC/D or Sox10, the specimens were incubated overnight at 4°C in PBS containing a mouse anti-HuC/D antibody or a goat anti-Sox10 antibody. Subsequently, they were incubated overnight at 4°C in PBS containing a Cy2-conjugated goat anti-mouse IgG antibody or a DyLight 488-conjugated donkey anti-goat IgG antibody (1 : 800; Rockland, Limerick, PA, U.S.A.).
After coverslipping, fluorescent images were acquired using a confocal laser scanning microscope (LSM510META; Carl Zeiss, Jena, Germany). For quantification of the area of meshes enclosed by PGP9.5-positive bundles, we acquired 9 (control) or 10 (CKO) images of 450×450 µm from three pairs of control and CKO mice, selected 36 (control) or 59 (CKO) meshes with sharp PGP9.5-positive boundaries (4 (control) or 5–6 (CKO) meshes per image), and measured the area of the meshes using Carl Zeiss LSM Ver. 4.2 software. For quantification of the mean intensity of GFAP signals, we acquired 27 images of 450×450 µm for control or CKO mice from five pairs of control and CKO mice, and measured the mean intensity of GFAP signals in each image using Carl Zeiss LSM Ver. 4.2 software. For quantification of the density of HuC/D- or Sox10-positive cells, we acquired 32 images of 112.5×112.5 µm for control or CKO mice from five pairs of control and CKO mice and manually counted the number of HuC/D- or Sox10-positive cells per image.
Myeloperoxidase (MPO) AssayThe method of MPO assay was slightly modified from that described previously.29,30) The small intestine (jejunum; approximately 1.5–2 cm in length) was dissected from the CKO and control mice on postnatal day 20–27, opened, deprived of the mucosa using a glass slide, and minced in potassium phosphate buffer (10 mM; pH 6.0) containing 0.5% hexadecyltrimethylammonium bromide (Wako Pure Chemical Industries, Ltd., Osaka, Japan) with scalpel blades. The minced tissues were sonicated for 20 s (Handy Sonic UR-20P; Tomy Seiko), freeze-thawed three times, and sonicated for a further 20 s. After the homogenates were centrifuged (20000×g, 30 min, 20°C), the supernatant (20 µL) was mixed with 200 µL of acetate buffer (10 mM; pH 3.3) containing 3,3′,5,5′-teteramethylbenzidine dihydrochloride (0.15 mM; Dojindo, Kumamoto, Japan) and hydrogen peroxide (0.03 mM), and incubated for 7–10 min at 20°C. Absorbance of the reaction solution was measured at a wavelength of 590 nm. MPO activity was expressed in units per 100 mg of wet tissue, where 1 unit is defined as the amount of enzyme required to degrade 1 µmol peroxide per minute at 20°C.
Permeability AssayEvans blue (Wako Pure Chemical Industries, Ltd.; 2% in PBS) was administered through the tail vein of the CKO and control mice on postnatal day 20–27 (40 mg/kg). Thirty minutes later, we dissected the small intestine (jejunum; approximately 3–5 cm in length), from which Evans blue was extracted in formamide at room temperature for 24 h. Evans blue content was quantified by measuring absorbance at a wavelength of 590 nm and expressed in µg of Evans blue per 100 mg of wet tissue.
Occult Blood AssayThe feces of the CKO and control mice on postnatal day 20–27 were homogenized in deionized water (1 mL to 10 mg feces) by vortexing and pipetting. After centrifugation (1500×g, 3 min, 20°C), occult blood content in the supernatant was determined by analyzing its pseudoperoxidase activity in acetate buffer (10 mM; pH 3.3) containing 3,3′,5,5′-teteramethylbenzidine dihydrochloride (0.05 mg/mL; Dojindo) and hydrogen peroxide (0.1 mg/mL).31) Absorbance of the reaction solution was measured at a wavelength of 590 nm and shown as the normalized values by the mean absorbance of control mice.
Hematoxylin-Eosin Staining of CryosectionsThe intestine was dissected from the CKO and control mice on postnatal day 20–27, fixed for 60 min in PBS containing 4% paraformaldehyde (Acros Organics/Thermo Fisher Scientific), and sectioned at 12 µm on a cryostat (CM1850UV; Leica Microsystems, Wetzlar, Germany). The cryosections were stained with Mayer’s hematoxylin and 1% eosin Y solutions (Wako Pure Chemical Industries, Ltd.). After coverslipping, bright field images were acquired using a transmission microscope (BX51; Olympus, Tokyo, Japan) equipped with a digital camera (DP72; Olympus). The total mucosal thickness, crypt depth, villus height, and perimeter were measured using Olympus DP2-BSW software.
Myenteric Primary CultureThe method of primary culture of the myenteric plexus was slightly modified from that described previously.32,33) The MSMP were isolated from the small intestine of the CKO and control mice on postnatal day 18–20 as described above. After cutting them into pieces of approximately 2 mm length with scalpel blades, the tissues were incubated for 1 h at 37°C in Eagle’s basal medium with Hank’s salts containing 1 mg/mL collagenase (Wako Pure Chemical Industries, Ltd.) and 0.5 mg/mL deoxyribonuclease I (Sigma-Aldrich). After vortexing them for 15 s, the supernatant was collected and stored on ice. The undigested tissues were again subjected to enzyme digestion for 30 min, vortexing, and collection of the supernatant. This process was repeated. The undigested tissues were triturated with a Pasteur pipette and the supernatant was collected. After the total supernatant was centrifuged (170×g, 2 min, 4°C), the cell pellet was suspended in 1 mL of Medium 199 (Sigma-Aldrich) supplemented with 10% fetal bovine serum (Sigma-Aldrich) (culture medium) and strained through a 70-µm nylon mesh filter (Corning), which produced a cell suspension at a concentration of approximately 3×10⁵ cells per mL. Seventy microliters of the cell suspension was plated on a coverslip (14 mm in diameter; Matsunami, Osaka, Japan) coated with poly-L-lysine (molecular weight 30000–70000; Sigma-Aldrich). Two coverslips were placed in a culture dish 35 mm in diameter. After 1-h incubation, 2 mL of the culture medium was added to each dish. The cultures were incubated at 37°C in 5% CO2/95% air. After 2-d culture, 220 µL of Medium 199 with or without 10 mM ATP (Sigma-Aldrich) were added into the medium (final concentration of ATP: 1 mM). After 15-min incubation, the cells were washed two times for several seconds in PBS and fixed for 10 min in PBS containing 4% paraformaldehyde (Acros Organics/Thermo Fisher Scientific).
Immunocytochemistry of Myenteric Primary CulturesThe fixed cells were preincubated for 30 min in PBS containing 10% goat serum and 0.3% Triton X-100, then incubated for 1 h at room temperature in PBS containing a rabbit anti-GFAP antibody (1 : 500; AB5804; Chemicon/Millipore) and a mouse anti-NFATc1 antibody (1 : 50; MA3-024, Clone 7A6; Thermo Fisher Scientific). Subsequently, they were incubated for 1 h at room temperature in PBS containing a DyLight 488-conjugated goat anti-rabbit IgG antibody (1 : 100; Rockland) and a HiLyte Fluor 555-conjugated goat anti-mouse IgG antibody (1 : 400; AnaSpec), then incubated for 5 min in PBS containing 1 µg/mL 4′,6-diamidino-2-phenylindole (DAPI; Sigma-Aldrich). After coverslipping, fluorescent images were acquired using a confocal laser scanning microscope (LSM510META; Carl Zeiss). For quantification of the relative mean fluorescent intensity of NFATc1 signals in the nucleus of EGCs, the mean fluorescent intensity of NFATc1 signals in the nucleus and cytoplasm of 20 EGCs for control or CKO mice from two pairs of control and CKO mice was measured using Carl Zeiss LSM Ver. 4.2 software. The relative mean fluorescent intensity in the nucleus was calculated by dividing the mean fluorescent intensity in the nucleus by that in the cytoplasm.
Statistical AnalysisStatistical analysis was performed using two-tailed Student’s t-test. p<0.05 was considered statistically significant.
RESULTS
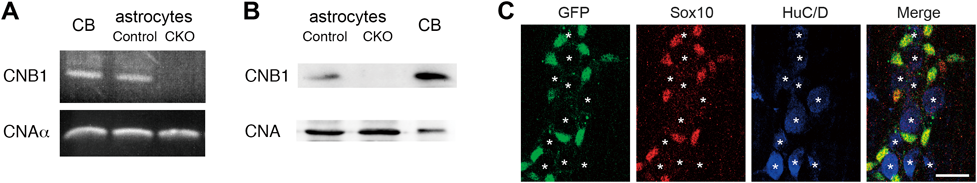
Generation of Glial CNB1-CKO MiceGlial CNB1-CKO mice were generated by crossing floxed CNB1 mice25) with GFAP-Cre mice.26) Knockout of CNB1 in glial cells was confirmed by RT-PCR and Western blot analyses of astrocytes purified from the cerebellum (Figs. 1A, B). Astrocytes, the major type of glial cells in the CNS, were used for these analyses because we can easily purify and obtain a large quantity of them by subculturing brain tissues.
To examine the specificity of glial knockout in the small intestine of these CKO mice, we performed reporter analysis using Rosa26-GNZ knockin mice which express a nuclear localized GFP/β-galactosidase fusion protein following Cre-mediated recombination.27) In the MSMP of the small intestine of Rosa26-GNZ; GFAP-Cre mice, the GFP-positive cells were positive for Sox-10 (glial marker) and negative for HuC/D (neuronal marker) (Fig. 1C). Thus, the GFAP-Cre-mediated recombination specifically occurred in EGCs in the ENS of the small intestine.
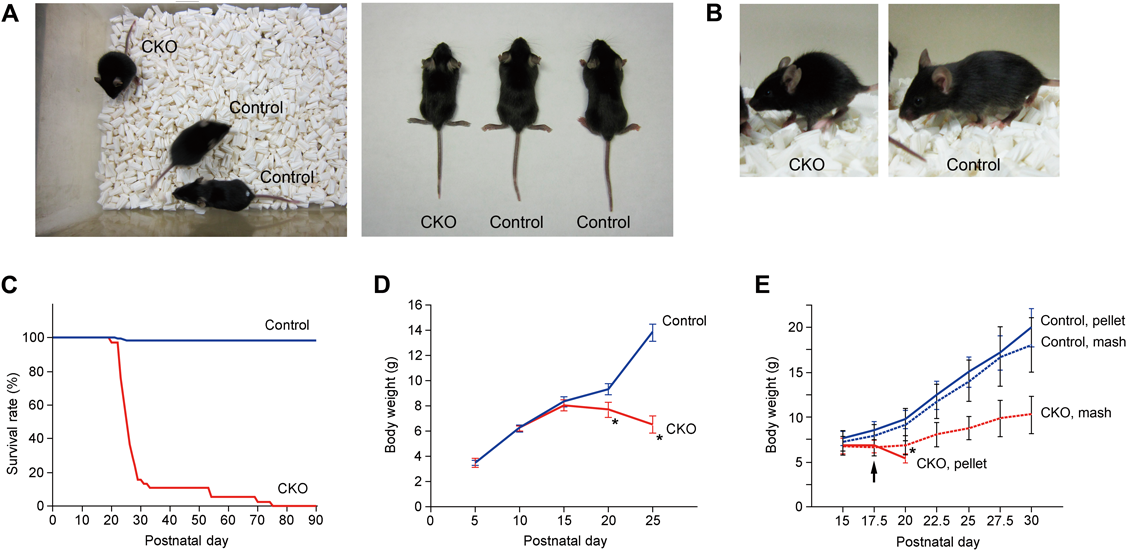
Appearance, Growth, and Survival of CNB1-CKO MiceAlthough the CKO mice appeared normal during the first and second postnatal weeks, they exhibited growth retardation and body weight loss approximately from the third postnatal week (Figs. 2A, B, D). The other external abnormalities of the CKO mice in and after the third postnatal week were raised hair and stooped posture (Figs. 2A, B). In addition, the CKO mice in this period displayed increased spontaneous locomotor activity (data not shown). Finally, approximately 80% of the CKO mice died within the fourth postnatal week, while the other CKO mice died by postnatal day 75 (Fig. 2C). The CKO mice became emaciated and hardly moved one or two days before death. No obvious paralysis or seizures were observed.
Because the CKO mice began to lose body weight within the weaning period (around postnatal day 20) and most of them died shortly after weaning, we suspected that indigestion and/or malabsorption of dry food pellets may have caused malnutrition and eventual death in the CKO mice. In fact, growth and survival of the CKO mice were rescued to some extent by feeding wet mash food instead of dry pellets after postnatal day 17.5. Body weight of the CKO mice fed wet mash food was significantly greater than that of the CKO mice fed dry pellets on postnatal day 20 (Fig. 2E), although it was still lower than that of control mice fed dry pellets or wet mash food. The CKO mice fed wet mash food survived longer than postnatal day 30.
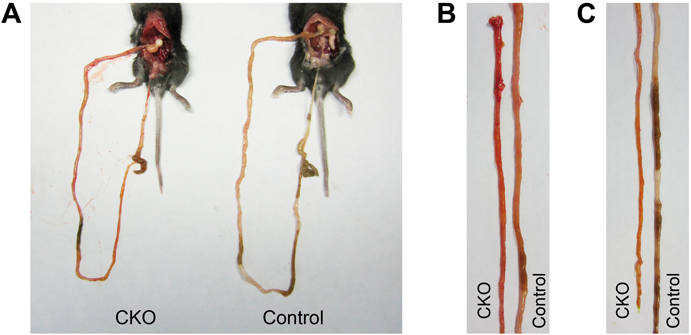
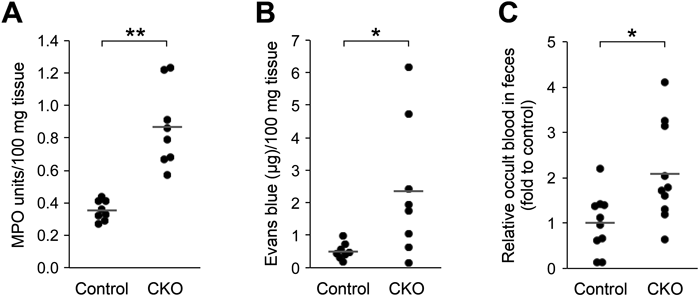
Abnormalities in the Small Intestine of CNB1-CKO MiceBy macroscopic observation of various organs of the CKO mice on postnatal day 20–27, it was found that the small intestine was often thinner than that of control mice and yellowish or reddish (Fig. 3). The length of the small intestine relative to body length was not significantly different between the control and CKO mice (Table 1). The small intestine of the CKO mice exhibited significant increases in MPO activity (Fig. 4A) and permeability (Fig. 4B). MPO activity is a marker of polymorphonuclear neutrophils and an indicator of tissue inflammation. Thus, the pathological changes in the small intestine of the CKO mice were associated with inflammation. In the emaciated CKO mice, the small intestine was still thinner, blackish, and fragile. The stomach and large intestine appeared normal. Stasis of gut contents was not observed. Occult blood was detected in the feces of some CKO mice (Fig. 4C). The appearance of the other organs was almost normal except for the small size.
Table 1. Length of the Small Intestine of
CNB1-CKO Mice
| Small intestine | Body | Small intestine/body |
|---|
| P14–16 | Control | 239±23 mm | 70±5 mm | 3.4±0.3 |
| CKO | 229±15 mm | 67±5 mm | 3.4±0.2 |
| p | 0.72 | 0.025 | 0.78 |
| P20–27 | Control | 288±35 mm | 78±5 mm | 3.7±0.4 |
| CKO | 236±26 mm | 66±4 mm | 3.6±0.4 |
| p | 9.9×10⁻⁸ | 2.4×10⁻⁹ | 0.28 |
Small intestine and body length of control and CNB1-CKO mice on postnatal day 14–16 and 20–27 were measured (n=11 and 22 mice for postnatal day 14–16 and 20–27, respectively). A pair of one CKO mouse and one littermate control mouse was used for each experiment. Data were expressed as mean±S.D. Statistical analysis was performed using two-tailed paired t-test.
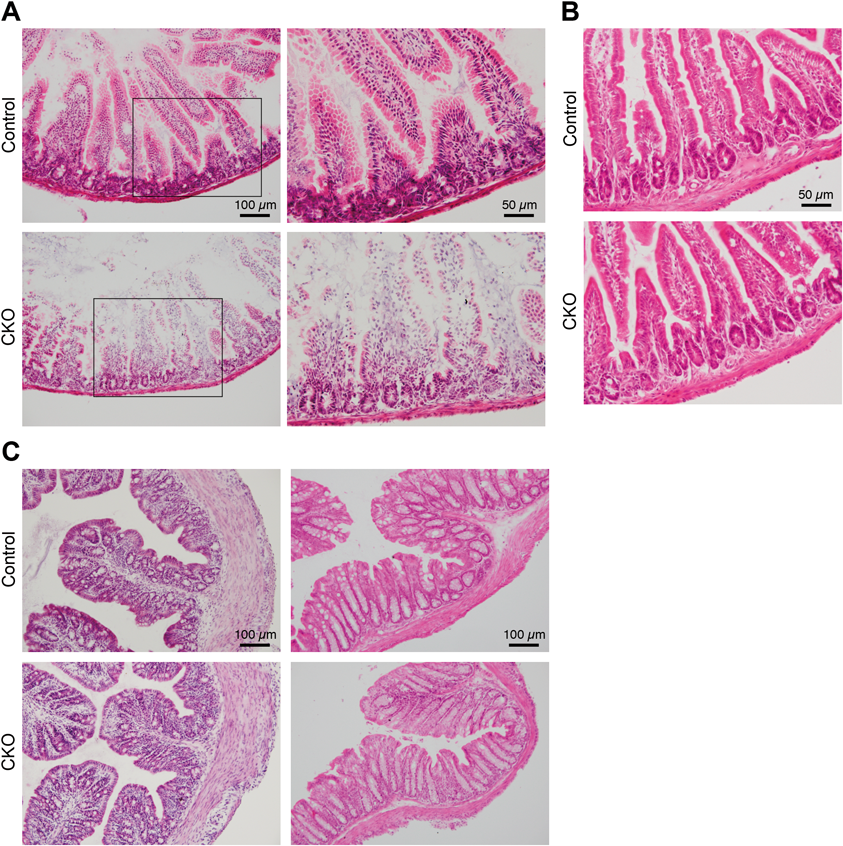
Histological analysis by hematoxylin-eosin staining of cryosections of the small intestine revealed that the mucosal layer was degenerated in the CKO mice on postnatal day 20–27 (Fig. 5A). In the villi of the CKO mice, loss of epithelial cells and vacuolization in the lamina propria were observed. Cells with condensed nuclei were observed in the lamina propria, as well as in and around the crypts. The crypts appeared to be smaller in the CKO mice than in control mice. In fact, quantification of the total mucosal thickness, crypt depth, villus height, and perimeter showed that the crypt depth was particularly low among these parameters in the CKO mice (Table 2). Immunohistochemistry against Ki67 antigen, a marker of cell proliferation, showed that cell proliferation was suppressed in the crypt of the small intestine of the CKO mice (Supplementary Fig. 1). In the emaciated CKO mice, the small intestine was too fragile to perform histological analysis. In contrast, the small intestine on postnatal day 14–16 (Fig. 5B) and the large intestine (Fig. 5C) and stomach (data not shown) on postnatal day 14–27 showed no apparent abnormalities on macroscopic and histological analyses. No abnormalities were found in the major structures of the CNS of the CKO mice (data not shown).
Table 2. Quantification of Histology of the Small Intestine of
CNB1-CKO Mice
| Mucosal thickness | Crypt depth | Villus height | Perimeter |
|---|
| Control | 425±102 µm | 82±12 µm | 343±104 µm | 5480±1063 µm |
| CKO | 295±95 µm | 46±13 µm | 249±93 µm | 4102±681 µm |
| p | 8.4×10⁻⁶ | 9.5×10⁻¹⁵ | 7.5×10⁻⁴ | 3.9×10⁻⁷ |
| CKO/control | 0.70±0.22 | 0.57±0.16 | 0.73±0.27 | 0.75±0.12 |
The total mucosal thickness, crypt depth, villus height, and perimeter of the small intestine (jejunum) of control and CNB1-CKO mice on postnatal day 20–27 were measured in hematoxylin-eosin stained cryosections (n=28). Data were expressed as mean±S.D. Statistical analysis was performed using two-tailed unpaired t-test.
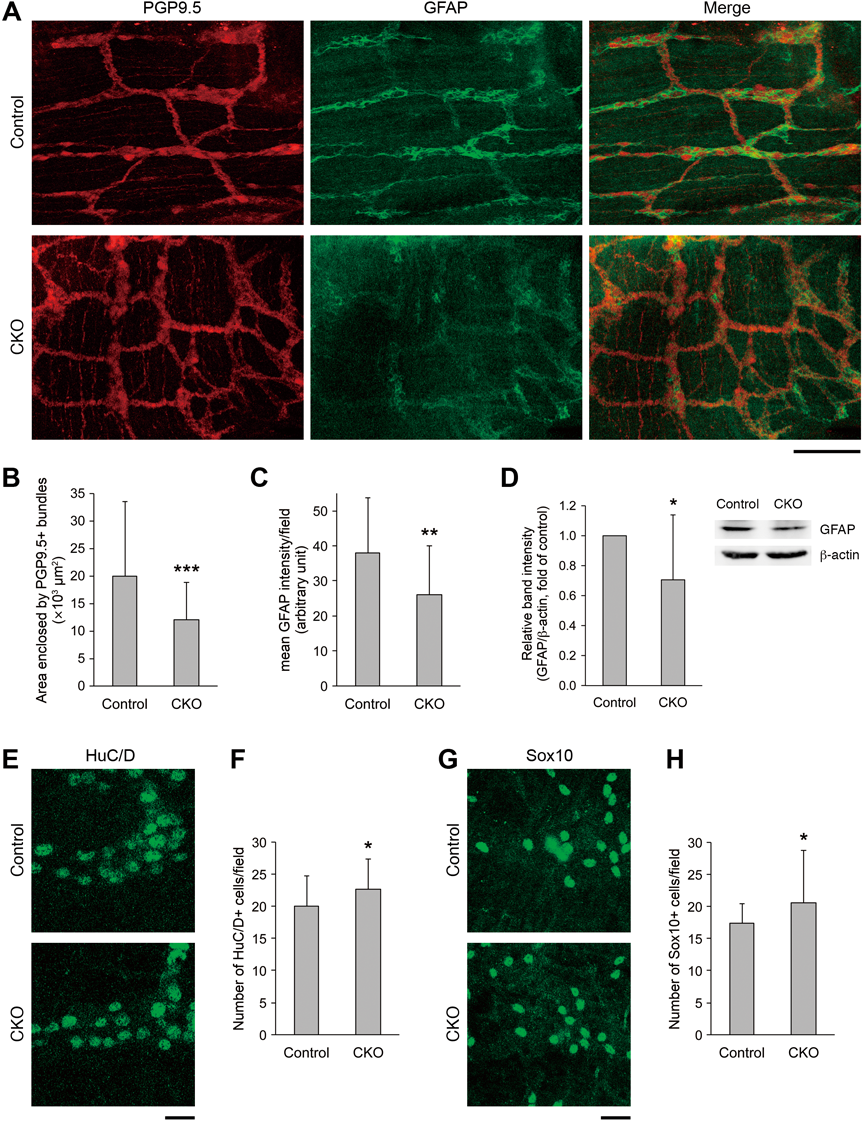
To analyze the morphology of the ENS, we performed double fluorescent immunohistochemistry against PGP9.5 (neuronal marker) and GFAP (glial marker) of the MSMP of the small intestine of the CKO mice on postnatal day 20–27 (Fig. 6A). In the CKO mice, the PGP9.5-positive meshwork structure of the myenteric plexus was irregular and the area of meshes enclosed by PGP9.5-positive bundles was smaller compared with that in control mice (Figs. 6A, B). In addition, GFAP expression was reduced in some areas of the myenteric plexus of the CKO mice (Figs. 6A, C). The reduction in GFAP expression was confirmed by Western blot analysis (Fig. 6D). In fluorescent immunohistochemistry against HuC/D (neuronal marker; Figs. 6E, F) and Sox10 (glial marker; Figs. 6G, H), the densities of both HuC/D- and Sox10-positive cells were significantly higher in the CKO mice than in control mice. These changes may be due to the thinning of the small intestine of the CKO mice.
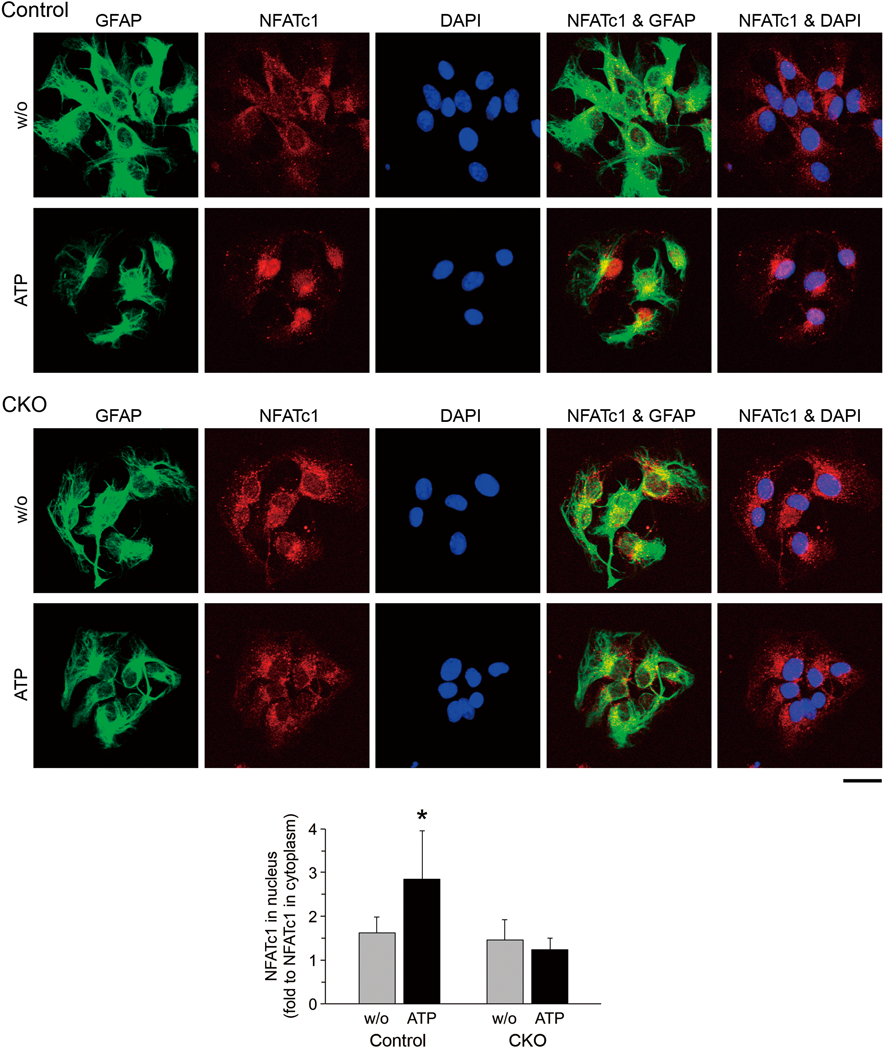
Abnormalities in EGCs of CNB1-CKO MiceFinally, we analyzed whether CN-related signaling is impaired in EGCs of the small intestine of the CKO mice. In response to intracellular Ca2+ elevation, CN is activated and dephosphorylates cytosolic NFAT, leading to its translocation into the nucleus in many types of cells34) including astrocytes.6,7) Myenteric primary cultures of the small intestine were stimulated with ATP and processed for triple fluorescent staining of immunocytochemistry against GFAP and NFATc1, and nuclear staining with DAPI (Fig. 7). In EGCs derived from control mice, translocation of NFATc1 into the nucleus was observed after ATP stimulation (Fig. 7 upper images and graph). In contrast, the nuclear translocation of NFATc1 after ATP stimulation was impaired in EGCs derived from the CKO mice (Fig. 7 lower images and graph).
DISCUSSION
The present study showed that the glial CNB1-CKO mice (Fig. 1) exhibited growth retardation in the weaning period and died shortly after weaning (Fig. 2). Growth and survival of the CKO mice were rescued to some extent by feeding wet mash food instead of dry pellets. The small intestine, particularly its mucosal layer, was degenerated in the CKO mice (Figs. 3, 5). The pathological changes in the small intestine of the CKO mice were associated with inflammation and increased intestinal permeability (Fig. 4). Glial GFAP expression was reduced in the small intestine of the CKO mice, although the density of EGCs (Sox10-positive cells) was not lower in the CKO mice than in control mice (Fig. 6). Nuclear translocation of NFATc1 after stimulation, the most important CN-related signaling, was impaired in EGCs of the CKO mice (Fig. 7). These results suggest that abnormalities in CNB1-deficient EGCs induce mucosal degeneration and inflammation in the small intestine and lead to indigestion and/or malabsorption, malnutrition, and eventual death.
How do abnormalities in CNB1-deficient EGCs induce mucosal degeneration and inflammation in the small intestine and lead to indigestion and/or malabsorption? EGCs are thought to modulate enteric neurotransmission and regulate gastrointestinal function.17–22) EGCs are involved in glutamatergic, γ-aminobutyric acidergic, peptidergic, and nitrergic neurotransmission.17,19) In addition, purines released from enteric neurons elicit Ca2+ responses in the surrounding EGCs.35–37) Such Ca2+ responses in EGCs regulate intestinal transit.38) EGCs are responsive not only to purines, but also to other neurotransmitters such as acetylcholine and serotonin.39) Although how Ca2+ responses in EGCs regulate gastrointestinal function is poorly understood, there is a report suggesting that prostaglandin E2 released from EGCs potentiates bradykinin-induced Ca2+ response in enteric neurons.33) Furthermore, EGCs are involved in the development of sensory enteroendocrine cells. Neurotrophic factors derived from EGCs enhance formation of axon-like basal processes called “neuropods” in enteroendocrine cells.40) Considering such roles of EGCs in enteric neurotransmission and gastrointestinal function, abnormalities in CNB1-deficient EGCs may cause dysregulation of enteric neurotransmission and result in indigestion and/or malabsorption in our CKO mice. How the CNB1 deficiency in EGCs influences enteric neurotransmission and digestion/absorption is one of the interesting issues for future studies.
EGCs are also involved in maintenance of intestinal barrier function and regulation of intestinal permeability.19–21,23,24) For example, EGCs induce intestinal mucosal barrier function via release of s-nitrosoglutathione.23) In addition, EGCs inhibit proliferation of intestinal epithelial cells via release of transforming growth factor β141) and enhance differentiation of intestinal epithelial cells via release of 15-deoxy-∆12,14-prostaglandin J2.42) In our CKO mice, the mucosal layer was degenerated and intestinal permeability was increased in the small intestine (Figs. 4, 5). CNB1 deficiency in EGCs may cause dysfunction of the mucosal barrier and result in inflammation in the small intestine in our CKO mice.
EGCs support enteric neurons mechanically and trophically.17,19–21,24) In the present study, individual neurons positive for PGP9.5 appeared to be normal in the small intestine of our CKO mice (Fig. 6). In addition, the density of neurons (HuC/D-positive cells) was not lower but higher in the CKO mice than in control mice. Thus, we think that mechanical and trophic support of EGCs to neurons was not severely impaired in the small intestine of our CKO mice. Although the PGP9.5-positive meshwork structure of the myenteric plexus was altered, this may be due to the thinning of the small intestine.
GFAP expression was reduced in some areas of the myenteric plexus of the CKO mice, although the density of Sox10-positive cells was not lower but higher in the CKO mice than in control mice (Fig. 6). These results indicate that EGCs were not lost but some of them reduced their GFAP expression in the CKO mice.
Immunohistochemical analyses shown in Fig. 6 focused on the myenteric plexus. In contrast, the submucosal plexus was not analyzed in the present study because the submucosal plexus was not sufficiently retained in the muscle strips we used. Further analyses are needed to clarify whether similar morphological changes are observed in the submucosal as well as the myenteric plexus.
There are several mouse models which show the importance of EGCs in the function and homeostasis of the gut. Bush et al. performed genetic ablation of EGCs by treating transgenic mice expressing herpes simplex virus thymidine kinase under the control of the GFAP promoter with antiviral agent ganciclovir.43) These mice exhibited a fulminating and fatal enteritis, demonstrating that EGCs play an essential role in maintaining the integrity of the gut. This study suggested that loss or dysfunction of EGCs may contribute to the cellular mechanisms of enteric diseases such as inflammatory bowel disease for the first time. Cornet et al. performed genetic ablation of EGCs by an autoimmune mechanism mediated by CD8+ T cells.44) These mice exhibited growth retardation after birth and died by postnatal day 8. The small and large intestines were distended, inflamed, and hemorrhagic. The early onset of the phenotypes, distension of intestines, and abnormalities in the large intestine in these mice were different features from those in our CKO mice. Aubé et al. used an adoptive transfer model in which disruption of EGCs was induced in adult animals.45) These mice exhibited a delay in intestinal transit and an increase in intestinal permeability, demonstrating that EGCs play an important role in intestinal motility and permeability.
In the present study, pathological changes were observed in the small intestine, but not in the large intestine. The reason why the CNB1 deficiency in EGCs did not impair the large intestine is unknown at present. However, confined defects in the small intestine were also reported in several other studies that performed glial ablation in mice.43,46,47) This feature is reminiscent of that of Crohn’s disease: the primary disease location is the small intestine in approximately two-thirds of Crohn’s disease.48) Furthermore, GFAP expression is reduced in non-inflamed intestine specimens of patients with Crohn’s disease, whereas it is increased or unaltered in inflamed specimens of patients with Crohn’s disease and ulcerative colitis.44,49) Thus, the reduced GFAP expression observed in our CKO mice is similar to that in non-inflamed intestine regions of Crohn’s disease patients. Therefore, these CKO mice could be a novel animal model to elucidate the etiology and pathogenesis of enteric diseases such as Crohn’s disease.
In conclusion, glial CNB1-CKO mice exhibited dysfunction of EGCs, mucosal degeneration and inflammation in the small intestine, growth retardation in the weaning period, and eventual death after weaning. Abnormalities in CNB1-deficient EGCs may cause dysregulation of enteric neurotransmission and dysfunction of the mucosal barrier, leading to indigestion/malabsorption and inflammation, respectively, in these CKO mice, although how the CNB1 deficiency in EGCs influences enteric neurotransmission and the mucosal barrier needs to be clarified by future studies. The findings in the present study suggest that CN plays a novel and important role in EGCs and that these CKO mice could be a novel animal model of enteric diseases such as inflammatory bowel disease.
Acknowledgments
This study was supported in part by Grants-in-Aid from the Japan Society for the Promotion of Science (JSPS KAKENHI Grant Numbers 16K08744 and 22500312).
Conflict of Interest
The authors declare no conflict of interest.
Supplementary Materials
The online version of this article contains supplementary materials.
REFERENCES
- 1) Rusnak F, Mertz P. Calcineurin: form and function. Physiol. Rev., 80, 1483–1521 (2000).
- 2) Groth RD, Dunbar RL, Mermelstein PG. Calcineurin regulation of neuronal plasticity. Biochem. Biophys. Res. Commun., 311, 1159–1171 (2003).
- 3) Tojima T, Hines JH, Henley JR, Kamiguchi H. Second messenger and membrane trafficking direct and organize growth cone steering. Nat. Rev. Neurosci., 12, 191–203 (2011).
- 4) Baumgärtel K, Mansuy IM. Neural functions of calcineurin in synaptic plasticity and memory. Learn. Mem., 19, 375–384 (2012).
- 5) Fernandez AM, Fernandez S, Carrero P, Garcia-Garcia M, Torres-Aleman I. Calcineurin in reactive astrocytes plays a key role in the interplay between proinflammatory and anti-inflammatory signals. J. Neurosci., 27, 8745–8756 (2007).
- 6) Pérez-Ortiz JM, Serrano-Pérez MC, Pastor MD, Martín ED, Calvo S, Rincón M, Tranque P. Mechanical lesion activates newly identified NFATc1 in primary astrocytes: implication of ATP and purinergic receptors. Eur. J. Neurosci., 27, 2453–2465 (2008).
- 7) Sama MA, Mathis DM, Furman JL, Abdul HM, Artiushin IA, Kraner SD, Norris CM. Interleukin-1β-dependent signaling between astrocytes and neurons depends critically on astrocytic calcineurin/NFAT activity. J. Biol. Chem., 283, 21953–21964 (2008).
- 8) Serrano-Pérez M, Martín ED, Vaquero CF, Azcoitia I, Calvo S, Cano E, Tranque P. Response of transcription factor NFATc3 to excitotoxic and traumatic brain insults: identification of a subpopulation of reactive astrocytes. Glia, 59, 94–107 (2011).
- 9) Abdul HM, Sama MA, Furman JL, Mathis DM, Beckett TL, Weidner AM, Patel ES, Baig I, Murphy MP, LeVine H 3rd, Kraner SD, Norris CM. Cognitive decline in Alzheimer’s disease is associated with selective changes in calcineurin/NFAT signaling. J. Neurosci., 29, 12957–12969 (2009).
- 10) Fernandez AM, Jimenez S, Mecha M, Dávila D, Guaza C, Vitorica J, Torres-Aleman I. Regulation of the phosphatase calcineurin by insulin-like growth factor I unveils a key role of astrocytes in Alzheimer’s pathology. Mol. Psychiatry, 17, 705–718 (2012).
- 11) Jin SM, Cho HJ, Kim YW, Hwang JY, Mook-Jung I. Aβ-induced Ca2+ influx regulates astrocytic BACE1 expression via calcineurin/NFAT4 signals. Biochem. Biophys. Res. Commun., 425, 649–655 (2012).
- 12) Lim D, Iyer A, Ronco V, Grolla AA, Canonico PL, Aronica E, Genazzani AA. Amyloid beta deregulates astroglial mGluR5-mediated calcium signaling via calcineurin and NF-κB. Glia, 61, 1134–1145 (2013).
- 13) Volterra A, Meldolesi J. Astrocyte, from brain glue to communication elements: the revolution continues. Nat. Rev. Neurosci., 6, 626–640 (2005).
- 14) Halassa MM, Haydon PG. Integrated brain circuits: astrocytic networks modulate neuronal activity and behavior. Annu. Rev. Physiol., 72, 335–355 (2010).
- 15) Parpura V, Heneka MT, Montana V, Oliet SHR, Schousboe A, Haydon PG, Stout RF Jr, Spray DC, Reichenbach A, Pannicke T, Pekny M, Pekna M, Zorec R, Verkhratsky A. Glial cells in (patho)physiology. J. Neurochem., 121, 4–27 (2012).
- 16) Pannasch U, Rouach N. Emerging role for astroglial networks in information processing: from synapse to behavior. Trends Neurosci., 36, 405–417 (2013).
- 17) Rühl A. Glial cells in the gut. Neurogastroenterol. Motil., 17, 777–790 (2005).
- 18) Bassotti G, Villanacci V, Antonelli E, Morelli A, Salerni B. Enteric glial cells: new players in gastrointestinal motility? Lab. Invest., 87, 628–632 (2007).
- 19) Gulbransen BD, Sharkey KA. Novel functional roles for enteric glia in the gastrointestinal tract. Nat. Rev. Gastroenterol. Hepatol., 9, 625–632 (2012).
- 20) Neunlist M, Rolli-Derkinderen M, Latorre R, Van Landeghem L, Coron E, Derkinderen P, De Giorgio R. Enteric glial cells: recent developments and future directions. Gastroenterology, 147, 1230–1237 (2014).
- 21) Coelho-Aguiar JM, Bon-Frauches AC, Gomes ALT, Verîssimo CP, Aguiar DP, Matias D, Thomasi BBM, Gomes AS, Brito GAC, Moura-Neto V. The enteric glia: identity and functions. Glia, 63, 921–935 (2015).
- 22) Ochoa-Cortes F, Turco F, Linan-Rico A, Soghomonyan S, Whitaker E, Wehner S, Cuomo R, Christofi FL. Enteric glial cells: a new frontier in neurogastroenterology and clinical target for inflammatory bowel diseases. Inflamm. Bowel Dis., 22, 433–449 (2016).
- 23) Savidge TC, Sofroniew MV, Neunlist M. Starring roles for astroglia in barrier pathologies of gut and brain. Lab. Invest., 87, 731–736 (2007).
- 24) Neunlist M, Van Landghem L, Mahé MM, Derkinderen P, des Varannes SB, Rolli-Derkinderen M. The digestive neuronal–glial-epithelial unit: a new actor in gut health and disease. Nat. Rev. Gastroenterol. Hepatol., 10, 90–100 (2013).
- 25) Zeng H, Chattarji S, Barbarosie M, Rondi-Reig L, Philpot BD, Miyakawa T, Bear MF, Tonegawa S. Forebrain-specific calcineurin knockout selectively impairs bidirectional synaptic plasticity and working/episodic-like memory. Cell, 107, 617–629 (2001).
- 26) Zhuo L, Theis M, Alvarez-Maya K, Brenner M, Willecke K, Messing A. hGFAP-cre transgenic mice for manipulation of glial and neuronal function in vivo. Genesis, 31, 85–94 (2001).
- 27) Stoller JZ, Degenhardt KR, Huang L, Zhou DD, Lu MM, Epstein JA. Cre reporter mouse expressing a nuclear localized fusion of GFP and β-galactosidase reveals new derivatives of Pax3-expressing precursors. Genesis, 46, 200–204 (2008).
- 28) Yang WY, Yang TTC, Schubert W, Factor SM, Chow C-W. Dosage-dependent transcriptional regulation by the calcineurin/NFAT signaling in developing myocardium transition. Dev. Biol., 303, 825–837 (2007).
- 29) Bradley PP, Priebat DA, Christensen RD, Rothstein G. Measurement of cutaneous inflammation: estimation of neutrophil content with an enzyme marker. J. Invest. Dermatol., 78, 206–209 (1982).
- 30) Esposito G, Capoccia E, Turco F, Palumbo I, Lu J, Steardo A, Cuomo R, Sarnelli G, Steardo L. Palmitoylethanolamide improves colon inflammation through an enteric glia/toll like receptor 4-dependent PPAR-α activation. Gut, 63, 1300–1312 (2014).
- 31) Jaffe RM, Zierdt W. A new occult bood test not subject to false-negative results from reducing substances. J. Lab. Clin. Med., 93, 879–886 (1979).
- 32) Ohta T, Kubota A, Murakami M, Otsuguro K, Ito S. P2X2 receptors are essential for [Ca2+]i increases in response to ATP in cultured rat myenteric neurons. Am. J. Physiol. Gastrointest. Liver Physiol., 289, G935–G948 (2005).
- 33) Murakami M, Ohta T, Otsuguro K, Ito S. Involvement of prostaglandin E2 derived from enteric glial cells in the action of bradykinin in cultured rat myenteric neurons. Neuroscience, 145, 642–653 (2007).
- 34) Hogan PG, Chen L, Nardone J, Rao A. Transcriptional regulation by calcium, calcineurin, and NFAT. Genes Dev., 17, 2205–2232 (2003).
- 35) Gomes P, Chevalier J, Boesmans W, Roosen L, Van den Abbeel V, Neunlist M, Tack J, Vanden Berghe P. ATP-dependent paracrine communication between enteric neruons and glia in a primary cell culture derived from embryonic mice. Neurogastroenterol. Motil., 21, 870–e62 (2009).
- 36) Gulbransen BD, Sharkey KA. Purinergic neuron-to-glia signaling in the enteric nervous system. Gastroenterology, 136, 1349–1358 (2009).
- 37) Broadhead MJ, Bayguinov PO, Okamoto T, Heredia DJ, Smith TK. Ca2+ transients in myenteric glial cells during the colonic migrating motor complex in the isolated murine large intestine. J. Physiol., 590, 335–350 (2012).
- 38) McClain JL, Grubisic V, Fried D, Gomez-Suarez RA, Leinninger GM, Sévigny J, Parpura V, Gulbransen BD. Ca2+ responses in enteric glia are mediated by connexin-43 hemichannels and modulate colonic transit in mice. Gastroenterology, 146, 497–507.e1 (2014).
- 39) Boesmans W, Cirillo C, Van den Abbeel V, Van den Haute C, Depoortere I, Tack J, Vanden Berghe P. Neurotransmitters involved in fast excitatory neurotransmission directly activate enteric glial cells. Neurogastroenterol. Motil., 25, e151–e160 (2013).
- 40) Bohórquez DV, Samsa LA, Roholt A, Medicetty S, Chandra R, Liddle RA. An enteroendocrine cell—enteric glia connection revealed by 3D electron microscopy. PLOS ONE, 9, e89881 (2014).
- 41) Neunlist M, Aubert P, Bonnaud S, Van Landeghem L, Coron E, Wedel T, Naveilhan P, Ruhl A, Lardeux B, Savidge T, Paris F, Galmiche JP. Enteric glia inhibit intestinal epithelial cell proliferation partly through a TGF-β1-dependent pathway. Am. J. Physiol. Gastrointest. Liver Physiol., 292, G231–G241 (2007).
- 42) Bach-Ngohou K, Mahé MM, Aubert P, Abdo H, Boni S, Bourreille A, Denis MG, Lardeux B, Neunlist M, Masson D. Enteric glia modulate epithelial cell proliferation and differentiation through 15-deoxy-Δ12,14-prostaglandin J2. J. Physiol., 588, 2533–2544 (2010).
- 43) Bush TG, Savidge TC, Freeman TC, Cox HJ, Campbell EA, Mucke L, Johnson MH, Sofroniew MV. Fulminant jejuno-ileitis following ablation of enteric glia in adult transgenic mice. Cell, 93, 189–201 (1998).
- 44) Cornet A, Savidge TC, Cabarrocas J, Deng W-L, Colombel J-F, Lassmann H, Desreumaux P, Liblau RS. Enterocolitis induced by autoimmune targeting of enteric glial cells: a possible mechanism in Crohn’s disease. Proc. Natl. Acad. Sci. U.S.A., 98, 13306–13311 (2001).
- 45) Aubé A-C, Cabarrocas J, Bauer J, Philippe D, Aubert P, Doulay F, Liblau R, Galmiche JP, Neunlist M. Changes in enteric neurone phenotype and intestinal functions in a transgenic mouse model of enteric glia disruption. Gut, 55, 630–637 (2006).
- 46) Nasser Y, Fernandez E, Keenan CM, Ho W, Oland LD, Tibbles LA, Schemann M, MacNaughton WK, Rühl A, Sharkey KA. Role of enteric glia in intestinal physiology: effects of the gliotoxin fluorocitrate on motor and secretory funciton. Am. J. Physiol. Gastrointest. Liver Physiol., 291, G912–G927 (2006).
- 47) Savidge TC, Newman P, Pothoulakis C, Ruhl A, Neunlist M, Bourreille A, Hurst R, Sofroniew MV. Enteric glia regulate intestinal barrier function and inflammation via release of S-nitrosoglutathione. Gastroenterology, 132, 1344–1358 (2007).
- 48) Peyrin-Biroulet L, Loftus EV Jr, Colombel J-F, Sandborn WJ. The natural history of adult Crohn’s disease in population-based cohorts. Am. J. Gastroenterol., 105, 289–297 (2010).
- 49) von Boyen GBT, Schulte N, Pflüger C, Spaniol U, Hartmann C, Steinkamp M. Distribution of enteric glia and GDNF during gut inflammation. BMC Gastroenterol., 11, 3 (2011).