Regular Articles
Central Nervous System Agent Classes and Fragility Fracture Risk among Elderly Japanese Individuals in a Nationwide Case-Crossover Design Study
2020 年 43 巻 2 号 p. 340-347
詳細
2020 年 43 巻 2 号 p. 340-347
Central nervous system (CNS) agents cause fractures among the elderly, but fracture risks of a wide range of CNS agent classes have not been analyzed in a study with the same population and definitions of variables. This study aimed to estimate the degree of fragility fracture risk of a wide range of CNS agent classes in elderly Japanese people. A case-crossover design study, with a case window and three control windows of 3 d each, as well as longer windows up to 15 d, was conducted among opioid non-users who lived without hospitalization for ≥13 months and incurred fragility fractures at ≥65 years of age, using the National Database of Health Insurance Claims and Specific Health Checkups of Japan. Conditional logistic regression estimated adjusted odds ratios (ORs) of CNS agent classes for fragility fractures for groups including and excluding users of pro re nata CNS agents (PRN-CNS agents) and for windows of 3–15 d. Antiepileptic agents had the highest adjusted ORs, 2.4 (95% confidence interval 2.3–2.5) for the group including PRN-CNS agent users (n = 446101). The next-highest classes were anti-dementia agents 1.5 (1.5–1.6), antipsychotics 1.5 (1.4–1.6), anti-Parkinson agents 1.3 (1.2–1.5), and antidepressants 1.1 (1.1–1.2). Similar ORs were found when PRN-CNS agent users were excluded (n = 352828), and slightly higher ORs were found for longer windows, with almost the same order of classes. Elderly individuals who use antiepileptic agents or a combination of antiepileptic agents and CNS agent classes with the next-highest ORs should be carefully monitored.
The global burden of mental and nervous system disorders has increased because of the expanding aging population.1,2) Central nervous system (CNS) agents have been reported to increase the risk of fractures,3–5) especially in the elderly. Fractures in the elderly lead to decreases in levels of activity of daily living, loss of independence, the need for more advanced care, and higher mortality, contributing to the burden of medical and nursing costs.6,7)
Thus far, the association between the use of CNS agents and fracture risk has been investigated by focusing on each medication individually or by analyzing the risk with the use of some restricted classes of CNS agents, such as antiepileptic agents, antidepressants, antipsychotics, benzodiazepines, and opioids.3–5,8–15) However, no study has estimated the fracture risk of a wide range of CNS agent classes to the best of our knowledge. A study among individuals in the same population using the same definitions of exposure and outcome makes fracture risk among CNS agent classes appropriate to compare and easy to interpret.
The present study aimed to estimate the degree of fragility fracture risk of a wide range of CNS agent classes in elderly Japanese people by employing a case-crossover design. We used the National Database of Health Insurance Claims and Specific Health Checkups of Japan (NDB Japan), which covers almost all Japanese citizens, to provide an estimation with sufficient statistical power, even for a wide variety of CNS agent classes.
This case-crossover design study was undertaken as a part of the Polypharmacy and Fracture in Older People Study, approved by the ethics committee of Tokushima Bunri University in September 2015 (No. H27-8). The study design, data source, study population, and definition of fragility fracture used in the present study have been described elsewhere,16,17) and are summarized briefly in the paragraphs below. Our previous reports did not focus on single classes of CNS agents, but instead focused on other topics; one revealed the number of elderly people who incurred fragility fractures according to sex, age, and received care,16) and the other estimated fracture risk associated with statin use.17)
The case-crossover design, which is self-controlled,18) compares medication use between case and control windows for patients who incurred any event. Therefore, it can control time-invariant confounders, such as underlying disease, frailty, and genetics.19) For the present study, the case window was defined as the three days immediately before the occurrence of fragility fracture, and the three control windows were defined as Days 31–33, 34–36, and 37–39 prior to the date of fracture (Fig. 1). We thought that a 30-d length would be a suitable washout period to avoid carryover effects from the control window to the case window, and to minimize changes in patient conditions, such as frailty and disease severity. Effects of extended length of case and control windows were evaluated as sensitivity analyses by changing the length from 3 to 5, 10, and 15 d.

NDB Japan, which is the data source of the present study, includes almost all Japanese citizens (total of approximately 125 million citizens and approximately 31 million elderly people [aged ≥65 years]), of which claims data from April 2012 to September 2014 were used in the present study. The study population met the following inclusion criteria: (1) opioid non-users with any medication record who had incurred fragility fractures in the proximal humerus, distal radius, vertebra, and/or femoral neck at age of 65 years or over from May 2013 to September 2014 and (2) those who had not been hospitalized for at least 13 months prior to the occurrence of the fracture.
The occurrence of fragility fractures, which are caused by a slight external force such as falling from a standing height or less,6,20) was determined by (1) use of diagnostic codes and modifier codes added to the diagnostic codes and (2) radiographic examination on the date of diagnosis at the institution where the diagnosis was made. The combinations of diagnostic codes and modifier codes defined as fragility fractures are shown in Supplementary Materials Table S1. Fracture diagnoses with the following modifier codes were not recognized as fragility fractures: modifier codes that were not thought as fracture occurrence (e.g. 5124: old) or fragility fractures (e.g. 1002: axilla) (Supplementary materials Table S2).
MedicationAll prescribed medications were classified according to the Anatomical Therapeutic Chemical (ATC) classification system of WHO. Medications not included in the ATC list were classified into similar ATC classification groups. CNS agent classes were defined as antiepileptic agents (ATC code N03A), anti-Parkinson agents (N04), antipsychotics (N05A), anxiolytics (N05B), hypnotics and sedatives (N05C), antidepressants (N06A), and anti-dementia agents (N06D).
We addressed bone metabolism-related agents and fall-inducing agents as potential confounding medications. Bone metabolism-related agents were classified as the following 12 groups: proton pump inhibitors, steroids, thyroid hormones, antiestrogens, vitamin D agents, calcium agents, anabolic steroids, vitamin K agents, statins, estrogen agonists, calcium homeostasis agents and somatropin, and bisphosphonates and receptor activator of nuclear factor-kappa B ligand-targeted antibody. Fall-inducing agents were classified as the following eight groups: insulins, hypoglycemic agents except for insulin, nitrates and erectile dysfunction agents, antiadrenergic agents and vasodilators relaxing vascular smooth muscle, diuretics, beta-blocking agents, calcium channel blockers, and renin-angiotensin-system-acting agents. The detailed definition has been published elsewhere.17)
For the above medications, oral formulations, transdermal absorption agents with systemic effects (rotigotine, rivastigmine, estrogen, nitrates, and beta-blocking agents), and injection formulations were employed. The dates that oral formulations would have been used were identified as day-units using the dispensing date and days-of-supply. The administration days for transdermal absorption agents were estimated by dividing the total quantity by the standard daily maintenance dose. The dates that injection formulations would have been used were defined as only the dispensing dates, excluding self-injection agents such as insulin and glucagon-like peptide-1. The dates for self-injection were defined as 365 d.
Statistical AnalysesThe usage pattern of CNS agent classes between case and control windows was investigated, because discordant data of medication use between windows (i.e., a class used in the case window but not in control windows and vice versa), not concordant data, are used for estimation of odds ratios (ORs) in the case-crossover design.21) Conditional logistic regression analyses for 1 : 3 matched sets estimated crude and adjusted ORs of CNS agent classes for fragility fracture. Crude ORs were also estimated with the Cochran–Mantel–Haenszel (CMH) method, because the ORs estimated from conditional logistic regression analyses are likely to be biased due to within-subject exposure dependence,22) which is natural for a case-crossover design of self-control.
CNS agents, especially anxiolytics, hypnotics, and sedatives, are often prescribed as medications to be taken as needed according to physicians’ direction (pro re nata). Data for pro re nata CNS agents (PRN-CNS agents) were thought to influence the estimation of ORs, as dates when patients actually used PRN-CNS agents were unclear. We therefore estimated the ORs for both groups, including or excluding patients to whom PRN-CNS agents were dispensed in the case window or control windows (PRN-CNS agent users). PRN use was defined with the PRN code that was described as the medication record in medical claims and as the prescription base record in dispensing claims.
Statistical significance was assessed with 95% confidence intervals (CIs). SAS Enterprise Guide 7.13 and SAS ver.9.4 (SAS Institute Inc., Cary, NC, U.S.A.) were used for data processing and statistical analyses.
A total of 446101 patients who met the inclusion criteria were used for analyses including PRN-CNS agent users (n = 446101) and for analyses excluding them (n = 352828) (Fig. 2). The characteristics of each group are summarized in Table 1. Females and patients aged ≥80 years accounted for approximately 80 and 50% of the analysis populations, respectively. The percentages of patients with mental or nervous system disorders, such as schizophrenia, depression, and Parkinson’s disease, were lower in the group excluding PRN-CNS agent users than the group including them.
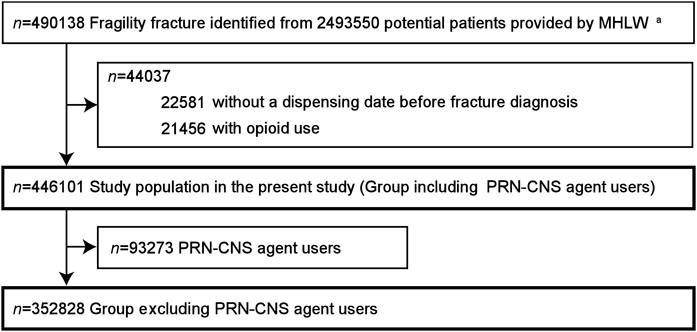
MHLW, Ministry of Health, Labour and Welfare; CNS, central nervous system; PRN, pro re nata (as needed). a The detailed flowchart to identify patients who incurred fragility fractures is illustrated elsewhere.16)
| Characteristic | Including PRN-CNS agent users N = 446101 n (%) | Excluding PRN-CNS agent users n = 352828 n (%) |
|---|---|---|
| Gender | ||
| Male | 83656 (18.8) | 69279 (19.6) |
| Female | 362445 (81.2) | 283549 (80.4) |
| Age (years) | ||
| 65–69 | 47589 (10.7) | 42061 (11.9) |
| 70–74 | 70327 (15.8) | 58937 (16.7) |
| 75–79 | 91794 (20.6) | 72622 (20.6) |
| 80–84 | 101476 (22.7) | 76541 (21.7) |
| ≥85 | 134915 (30.2) | 102667 (29.1) |
| Disease: codeb) | ||
| Diabetes mellitus: E10–14 | 137338 (30.8) | 104400 (29.6) |
| Hyperlipidemia: E78.0–78.5 | 210952 (47.3) | 160366 (45.5) |
| Schizophrenia: F20 | 13241 (3.0) | 5897 (1.7) |
| Depression: F32–33 | 42607 (9.6) | 20495 (5.8) |
| Nervous system disease | ||
| Parkinson disease: G20 | 14543 (3.3) | 7185 (2.0) |
| Alzheimer’s disease: G30 | 55687 (12.5) | 31838 (9.0) |
| Epilepsy: G40–41 | 12214 (2.7) | 6357 (1.8) |
| Sleep disorder: G47 | 156090 (35.0) | 91917 (26.1) |
| Nerve, nerve root and plexus disorder: G50–59 | 26273 (5.9) | 18252 (5.2) |
| Polyneuropathy and peripheral nervous system: G60–64 | 92141 (20.7) | 64107 (18.2) |
| Cerebral palsy and paralytic syndrome: G80–83 | 5107 (1.1) | 3719 (1.1) |
| Other disorder of nervous system: G90–99 | 24949 (5.6) | 14782 (4.2) |
| Essential hypertension: I10 | 291876 (65.4) | 222149 (63.0) |
| Angina: I20 | 84650 (19.0) | 59630 (16.9) |
| Heart failure: I50 | 92706 (20.8) | 66669 (18.9) |
| Cerebrovascular disease | ||
| Cerebral infarction: I63 and I69.3 | 95450 (21.4) | 66683 (18.9) |
| Excluding cerebral infarction: I60–69 excluding I63 and I69.3 | 46133 (10.3) | 33270 (9.4) |
| Osteoporosis: M80–82 | 190575 (42.7) | 142334 (40.3) |
| Fracture history | ||
| No | 354375 (79.4) | 285633 (81.0) |
| Yes | 91726 (20.6) | 67195 (19.0) |
| Location of fragility fractures | ||
| Proximal humerus | 23832 (5.4)c) | 18616 (5.3)d) |
| Distal radius | 75256 (17.0)c) | 62156 (17.7)d) |
| Vertebra | 268702 (60.5)c) | 210442 (59.9)d) |
| Femoral neck | 76296 (17.2)c) | 60099 (17.1)d) |
| Received treatment | ||
| Ambulatory care | 358147 (80.3) | 282085 (79.9) |
| Hospitalization | 87954 (19.7) | 70743 (20.1) |
CNS, central nervous system; PRN, pro re nata (as needed). a) Patients used for the analyses under 3-d window. b) ICD-10 codes based on data from April 2012 until onset of fragility fracture. c) Patients with fragility fracture at one location. The percentage was estimated by dividing the shown number of patients by 444086. d) Patients with fragility fracture at one location. The percentage was estimated by dividing the shown number of patients by 351313.
Usage patterns of CNS agent classes between the case and control windows are shown in Table 2. Antiepileptic agents had a large difference in percentages between the two patterns of discordant use: 0.9% use in the case window but non-use in the control windows and 0.5% non-use in the case window but use in the control windows if including PRN-CNS agent users, and 0.5 and 0.3%, respectively, if excluding PRN-CNS agent users.
| Class | Case window vs. Control windowsa) | |||
|---|---|---|---|---|
| Use vs. Use n (%)b) | Use vs. Non-use n (%)b) | Non-use vs. Use n (%)b) | Non-use vs. Non-use n (%)b) | |
| Including PRN-CNS agent users, n = 446101 | ||||
| Antiepileptic agents | 50398 (3.8) | 12167 (0.9) | 7006 (0.5) | 1268732 (94.8) |
| Anti-dementia agents | 103066 (7.7) | 9515 (0.7) | 7102 (0.5) | 1218620 (91.1) |
| Antipsychotics | 52021 (3.9) | 6845 (0.5) | 5119 (0.4) | 1274318 (95.2) |
| Anti-Parkinson agents | 31757 (2.4) | 2116 (0.2) | 1626 (0.1) | 1302804 (97.3) |
| Antidepressants | 54938 (4.1) | 5545 (0.4) | 4813 (0.4) | 1273007 (95.1) |
| Hypnotics and sedatives | 166388 (12.4) | 29056 (2.2) | 28497 (2.1) | 1114362 (83.3) |
| Anxiolytics | 146366 (10.9) | 21223 (1.6) | 20910 (1.6) | 1149804 (85.9) |
| Excluding PRN-CNS agent users, n = 352828 | ||||
| Antiepileptic agents | 21769 (2.1) | 5525 (0.5) | 3044 (0.3) | 1028146 (97.1) |
| Anti-dementia agents | 49204 (4.7) | 4802 (0.5) | 3697 (0.4) | 1000781 (94.6) |
| Antipsychotics | 19981 (1.9) | 2696 (0.3) | 1960 (0.2) | 1033847 (97.7) |
| Anti-Parkinson agents | 13647 (1.3) | 996 (0.1) | 781 (0.1) | 1043060 (98.5) |
| Antidepressants | 20888 (2.0) | 2065 (0.2) | 1736 (0.2) | 1033795 (97.7) |
| Hypnotics and sedatives | 69922 (6.6) | 12512 (1.2) | 12241 (1.2) | 963809 (91.1) |
| Anxiolytics | 62951 (6.0) | 9022 (0.9) | 9020 (0.9) | 977491 (92.4) |
CNS central nervous system; PRN pro re nata (as needed). a) Use of CNS agent classes in control windows was defined as ‘use’ if they was used in either window of three control windows. b) Number of combination of case window and each control window was 1338303 for a group including PRN-CNS agent users and 1058484 for a group excluding those because it was calculated by multiplying three (number of control windows) by number of patients. The percentages were estimated by dividing the number identified as each use pattern by 1338303 for a group including PRN-CNS agent users or 1058484 for a group excluding those.
The adjusted OR of antiepileptic agents for fragility fracture was 2.40 (95% CI, 2.28–2.53) if including PRN-CNS agent users and 2.59 (2.39–2.80) if excluding PRN-CNS agent users, being the highest among CNS agent classes (Table 3, Fig. 3). The following classes with adjusted ORs of approximately 1.0 to 1.5 were anti-dementia agents, antipsychotics, anti-Parkinson agents, and antidepressants. Of them, anti-dementia agents and antipsychotics showed slightly higher ORs: 1.54 (1.46–1.63) for anti-dementia agents if including PRN-CNS agent users and 1.48 (1.37–1.59) if excluding them, and 1.47 (1.37–1.57) for antipsychotics if including PRN-CNS agent users and 1.52 (1.37–1.69) if excluding them. The adjusted ORs of hypnotics and sedatives and anxiolytics were not statistically significant for either group.
| Class | Logistic regression | CMH | |
|---|---|---|---|
| Crude OR (95% CI) | Adjusted OR (95% CI)a) | Crude OR (95% CI) | |
| Including PRN-CNS agent users, n = 446101 | |||
| Antiepileptic agents | 2.45 (2.33, 2.59) | 2.40 (2.28, 2.53) | 1.74 (1.67, 1.81) |
| Anti-dementia agents | 1.57 (1.48, 1.65) | 1.54 (1.46, 1.63) | 1.34 (1.28, 1.40) |
| Antipsychotics | 1.59 (1.49, 1.70) | 1.47 (1.37, 1.57) | 1.34 (1.27, 1.41) |
| Anti-Parkinson agents | 1.52 (1.35, 1.71) | 1.32 (1.18, 1.49) | 1.30 (1.19, 1.43) |
| Antidepressants | 1.25 (1.17, 1.34) | 1.13 (1.06, 1.22) | 1.15 (1.09, 1.22) |
| Hypnotics and sedatives | 1.03 (1.00, 1.06) | 1.01 (0.99, 1.04) | 1.02 (1.00, 1.04) |
| Anxiolytics | 1.02 (0.99, 1.06) | 1.00 (0.96, 1.03) | 1.02 (0.99, 1.04) |
| Excluding PRN-CNS agent users, n = 352828 | |||
| Antiepileptic agents | 2.66 (2.46, 2.87) | 2.59 (2.39, 2.80) | 1.82 (1.71,1.93) |
| Anti-dementia agents | 1.50 (1.39, 1.62) | 1.48 (1.37, 1.59) | 1.30 (1.22,1.38) |
| Antipsychotics | 1.67 (1.50, 1.85) | 1.52 (1.37, 1.69) | 1.38 (1.27,1.49) |
| Anti-Parkinson agents | 1.48 (1.25, 1.75) | 1.28 (1.08, 1.52) | 1.28 (1.12,1.46) |
| Antidepressants | 1.32 (1.17, 1.48) | 1.19 (1.06, 1.33) | 1.19 (1.09,1.30) |
| Hypnotics and sedatives | 1.04 (0.99, 1.08) | 1.02 (0.98, 1.07) | 1.02 (0.99,1.06) |
| Anxiolytics | 1.00 (0.95, 1.05) | 0.97 (0.92, 1.02) | 1.00 (0.96,1.04) |
CNS, central nervous system; CMH, Cochran–Mantel–Haenszel; PRN, pro re nata (as needed); OR, odds ratio; CI, confidence interval. a) Adjusted for all CNS agent classes listed in this table and the pre-defined potential confounding medication groups of 12 groups of bone metabolism-related agents and 8 groups of fall-induced agents.

CNS, central nervous system; PRN, pro re nata (as needed); OR, odds ratio; CI, confidence interval.
Compared with the crude ORs of logistic regression, those estimated with the CMH method were lower, especially for CNS agent classes with relatively greater ORs such as antiepileptic agents (e.g. 1.74 vs. 2.45 for antiepileptic agents including PRN-CNS agent users), but statistically significant classes were the same with methods (Table 3). Crude ORs and adjusted ORs from conditional logistic regression showed almost the same values for all CNS agent classes.
Sensitivity analysis for length of windows showed that the longer-length windows had increased adjusted ORs for all classes in both groups, but the magnitude of the increase varied (Table 4). The adjusted ORs of antipsychotics were slightly increased (were able to be interpreted as almost the same), compared with antiepileptic agents, anti-dementia agents, anti-Parkinson agents, and antidepressants. Hypnotics and sedatives and anxiolytics were not associated with fragility fractures for the 3-d window, but a slightly significant association was found for the 15-d window.
| Class | Length of window | |||
|---|---|---|---|---|
| 3 d | 5 d | 10 d | 15 d | |
| Adjusted OR (95% CI) | Adjusted OR (95% CI) | Adjusted OR (95% CI) | Adjusted OR (95% CI) | |
| Including PRN-CNS agent users | n = 446101 | n = 446101 | n = 446101 | n = 446101 |
| Antiepileptic agents | 2.40 (2.28, 2.53) | 2.46 (2.34, 2.72) | 2.59 (2.46, 2.72) | 2.62 (2.50, 2.75) |
| Anti-dementia agents | 1.54 (1.46, 1.63) | 1.65 (1.56, 1.98) | 1.86 (1.76, 1.98) | 2.09 (1.97, 2.22) |
| Antipsychotics | 1.47 (1.37, 1.57) | 1.52 (1.42, 1.62) | 1.53 (1.43, 1.62) | 1.51 (1.42, 1.60) |
| Anti-Parkinson agents | 1.32 (1.18, 1.49) | 1.32 (1.17, 1.74) | 1.54 (1.37, 1.74) | 1.67 (1.49, 1.88) |
| Antidepressants | 1.13 (1.06, 1.22) | 1.18 (1.10, 1.39) | 1.30 (1.21, 1.39) | 1.37 (1.27, 1.46) |
| Hypnotics and sedatives | 1.01 (0.99, 1.04) | 1.03 (1.00, 1.07) | 1.04 (1.01, 1.07) | 1.08 (1.05, 1.11) |
| Anxiolytics | 1.00 (0.96, 1.03) | 1.01 (0.97, 1.07) | 1.04 (1.00, 1.07) | 1.05 (1.01, 1.08) |
| Excluding PRN-CNS agent users | n = 352828 | n = 350881 | n = 347535 | n = 3454493 |
| Antiepileptic agents | 2.59 (2.39, 2.80) | 2.72 (2.51, 2.94) | 2.86 (2.65, 3.08) | 2.89 (2.69, 3.11) |
| Anti-dementia agents | 1.48 (1.37, 1.59) | 1.56 (1.45, 1.69) | 1.79 (1.65, 1.94) | 2.08 (1.91, 2.26) |
| Antipsychotics | 1.52 (1.37, 1.69) | 1.58 (1.42, 1.75) | 1.61 (1.45, 1.79) | 1.57 (1.42, 1.74) |
| Anti-Parkinson agents | 1.28 (1.08, 1.52) | 1.33 (1.11, 1.58) | 1.60 (1.34, 1.91) | 1.74 (1.46, 2.08) |
| Antidepressants | 1.19 (1.06, 1.33) | 1.25 (1.11, 1.41) | 1.33 (1.18, 1.50) | 1.34 (1.19, 1.50) |
| Hypnotics and sedatives | 1.02 (0.98, 1.07) | 1.04 (1.00, 1.09) | 1.04 (1.00, 1.09) | 1.08 (1.03, 1.13) |
| Anxiolytics | 0.97 (0.92, 1.02) | 1.00 (0.95, 1.06) | 1.06 (1.01, 1.11) | 1.08 (1.03, 1.13) |
CNS, central nervous system; OR, odds ratio; CI, confidence interval. a) Adjusted for all CNS agent classes listed in this table and the pre-defined potential confounding medication groups of 12 groups of bone metabolism-related agents and 8 groups of fall-induced agent.
This case-crossover design study found that antiepileptic agents had the highest risk of fragility fracture among the wide range of CNS agent classes prescribed to relatively healthy elderly people in Japan, who were opioid non-users without hospitalization for at least 13 months. The OR for fragility fractures was approximately 2.0 for antiepileptic agents (adjusted OR of 2.40 from conditional logistic regression and crude OR of 1.74 from CMH). The ORs were approximately 1.0 to 1.5 for anti-dementia agents, antipsychotics, anti-Parkinson agents, and antidepressants, although the two former classes showed slightly higher ORs than the rest.
The results were relatively consistent, even if the use of PNR-CNS agents and length of windows were taken into account. Besides, the estimated fracture risk was almost the same as in previous studies, especially for antiepileptic agents, antipsychotics, and antidepressants, as described below. Use of the NDB Japan, which includes approximately 31 million elderly individuals aged ≥65 years in Japan, enabled estimation of the risk of a wide range of CNS agents with sufficient statistical power and generalization of the findings. Elderly individuals in Japan who use antiepileptic agents and combinations of antiepileptic agents and CNS agent classes with the next-highest ORs should be carefully monitored.
A meta-analysis by Shen et al. in 2014 estimated the fracture risk of antiepileptic agents8) and showed a relative risk (RR) of 2.0 for cohort studies and 1.8 for case-control studies. Another meta-analysis by Takkouche et al. in 20073) showed a RR of 1.5 for non-barbiturates and 2.2 for barbiturates. Shiek et al. reported that fractures occurred more often during treatment with antiepileptic agents in patients without vs. with seizures.23) Involvement of low bone mineral density from antiepileptic agent-mediated hepatic enzyme induction8,24) and drowsiness related to use of antiepileptic agents8) are reported as the underlying mechanisms. In the present study, the existence of seizure prior to the occurrence of fragility fractures was unclear, but percentage of elderly individuals who used antiepileptic agents in the case window (i.e., immediately before incurring the fracture) but did not use them in the control windows was certainly higher than the opposite pattern, suggesting that the use of antiepileptic agents, not the occurrence of seizures, caused fragility fractures. This is because an antiepileptic agent would have been used after a fracture if a seizure caused the fracture.
Regarding antipsychotics and antidepressants, several previous cohort, case-control, and meta-analysis studies support the findings of the present study: a RR of 1.63) and a hazard ratio (HR) of 1.45) for antipsychotics (OR of 1.7 for first-generation antipsychotics and 1.3 for second-generation antipsychotics9)) and a RR of 1.6 for antidepressants3) (1.7 for selective serotonin reuptake inhibitors (SSRIs)),10,11) a HR of 1.7 for SSRIs and serotonin and noradrenaline reuptake inhibitors,12) and a RR of 1.513) or a nonsignificant HR5) for tricyclic antidepressants. In addition, the case-crossover design study by Leach et al. also showed an OR of 1.5 each for antipsychotics and SSRIs.4)
The use of medications such as SSRIs,5,11,12) antipsychotics,5) and high doses of levodopa25) was reported to be an independent risk factor for fracture, but some reports showed an association between mental and nervous system disorders and fracture risk; depressive disorder26,27) and Parkinson’s disease28) have been associated with decreased bone mineral density, and Parkinson’s disease25,29) and Alzheimer’s disease30,31) have been associated with increased fracture risk. Therefore, as described below, we think that it is difficult to exclude the possibility of confounding completely due to the disease requiring a prescription (called ‘confounding by indication’) from the findings of the present study.
The results of the present study showed that the risk of fragility fracture associated with the use of hypnotics and sedatives and anxiolytics was statistically nonsignificant for the analyses with a 3-d window, but marginally significant in analyses with longer windows. Results of previous studies are controversial; the association was nonsignificant in the meta-analysis by Takkouche et al.3) and in a case-crossover study by Leach et al.,4) and the RR was 1.514) and 1.215) in two other meta-analyses.
The present study has some limitations related to the case-crossover design. First, the findings may have been related to disease that developed immediately prior to fracture (time-variant confounders). Thus, confounding may have existed due to the disease requiring a prescription (called ‘confounding by indication’), as described above. However, the case-crossover design has the advantage that it can control time-invariant confounders, even if they are measurable, unmeasurable, or unknown: e.g. underlying diseases, complications, bone mineral density, daily supplements, alcohol, and smoking, and genetic factors in drug metabolism; therefore, it is less likely to be influenced by confounders than are cohort and case-control studies.
Second, due to persistent user bias32) that occurs with chronic, long-term medication use, the fragility fracture risk might have been overestimated; therefore, a cautious interpretation of the findings is needed. As chronic medications are permanently used after treatment start, a pattern of medication use in the case window and non-use in the control windows is more likely to occur than the opposite pattern, which causes overestimation. Such a chronic medication use pattern would also be more likely to occur if analyzed with extended window length, as the probability of non-use in the control windows becomes higher. Actually, the sensitivity analyses in the present study showed that longer windows caused an increase in the ORs for fragility fracture for antiepileptic agents, anti-dementia agents, anti-Parkinson agents, and antidepressants, but made the OR for antipsychotics almost even. The reason is presumably that the four former classes were permanently used once treatment started, but antipsychotics were used for a short period in elderly people, as medications for managing hallucinations, delusions and agitation along with dementia.33–35)
Third, there is within-subject exposure dependency22) by using conditional logistic regression in case-crossover design, causing overestimation of risk. For this issue, the present study estimated crude ORs for fragility fracture using the CMH method in addition to conditional logistic regression, as Vines and Farrington reported that the estimation of the CMH method was approximately unbiased.22) Actually, the present study showed that the estimated value of the CMH method was lower than that of conditional logistic regression, especially for antiepileptic agents (1.74 vs. 2.45, respectively). The present study showed that the crude and adjusted ORs calculated from conditional logistic regression were similar, and thus, crude ORs from CMH methods would be presumably right as estimated values. Therefore, the OR for antiepileptic agents is thought to be approximately 2.0, not 2.5, as described at the start of this discussion.
There are also some limitations based on claims data, i.e., information bias such as inaccuracy of disease and medication use, which has been described in detail elsewhere.16) It is difficult to carry out validation studies to confirm accuracy in Japan, where links between social security numbers and databases are not established. For this reason, we did not conduct validation studies, but we carefully identified fragility fractures by connecting diagnostic codes with modifier codes in addition to diagnostic codes, diagnosis date, and radiographic examination, as described in Materials and Methods.
Regardless of the limitations, the results of the present study suggest that antiepileptic agents have the highest risk of fragility fracture among a wide range of CNS agent classes in elderly non-opioid users in Japan. Elderly individuals who use antiepileptic agents or combinations of antiepileptic agents and the CNS agent classes with the next-highest ORs, such as anti-dementia agents and antipsychotics, should be carefully monitored.
We thank the Ministry of Health, Labour and Welfare for generating and making the dataset from the NDB Japan available for our study. This work was supported by JSPS KAKENHI Grant Number JP15K08121.
The authors declare no conflict of interest.
The online version of this article contains supplementary materials.