Regular Articles
Oridonin Suppresses Human Gastric Cancer Growth in Vitro and in Vivo via Inhibition of VEGF, Integrin β3, and PCNA
2020 Volume 43 Issue 7 Pages 1035-1045
Details
2020 Volume 43 Issue 7 Pages 1035-1045
The diterpenoid oridonin is an extract from the herb Rabdosia rubescens, commonly used in Traditional Chinese medicine. Oridonin has putative inhibitory activity in many human cancers. This study continued investigations into the therapeutic potential of oridonin against gastric carcinoma, and the underlying mechanism. An in vitro 3-(4,5-dimethylthiazol-2-yl)-2,5-diphenyltetrazolium bromide (MTT) assay with BGC823 cells was used to examine the cytotoxicity and apoptosis associated with oridonin treatment. RT-PCR and immunocytochemistry results showed evaluated levels of vascular endothelial growth factor (VEGF), cluster of differentiation 31 (CD31), integrin β3, and proliferating cell nuclear antigen (PCNA) in BGC823 cells, or BGC823 xenografts nude mice. The inhibitory effect of oridonin was determined in vivo using the xenograft model, comparing tumor weight and volume, and calculating the tumor inhibition rate. The oridonin treatment and control groups were compared for associations between microvessel density and tumor inhibition rate, VEGF mRNA, integrin β3 mRNA, and PCNA protein. The IC50s of oridonin at 12 and 72 h were 17.08 ± 2.38 and 8.76 ± 0.90 µg/mL, respectively. VEGF protein levels dramatically decreased in a time- and dose-dependent manner with oridonin treatment. BGC823 xenograft growth was notably less in the oridonin treatment groups, responding in a dose-dependent manner. After 14 d of treatment, VEGF, integrin β3, and PCNA levels were dramatically lower, and positively correlated with CD31 levels. Oridonin was associated with inhibition of BGC823 cell growth and tumor angiogenesis, in vitro and in vivo, in a dose-and-time dependent manner with lower levels of VEGF, integrin β3, and PCNA. Oridonin is a potential candidate agent for chemotherapy of gastric carcinoma.
Among all malignancies worldwide, gastric cancer (GC) is the fifth most frequent in incidence, and the third most common in mortality, accounting for approx. 1033000 total patients and 782000 deaths annually, with twice as men as women.1) The only curative treatment for early-stage GC is surgery. Although chemotherapy in advanced GC effectively improves the survival quality and time, the 5-year survival rate is <25%,2) and the toxicity and side effects of current clinical chemotherapeutics limits wide application. Thus, the development of effective treatments with fewer side effects is needed.
Gastric cancer cells depend on angiogenesis, a complex process that requires endothelial cell development and tubule formation, modulated by different transcription factors,3) and regulated by both anti- and pro-angiogenetic factors. Tumor angiogenesis is involved in malignant transformation,4) tumor cell invasion into the circulation, and the switch of dormant tumor cells to metastatic lesions.5) Microvessel density (MVD) is widely used to evaluate angiogenesis in many human solid cancers.6)
Vascular endothelial growth factor (VEGF) is an important mediator of tumor angiogenesis,7,8) which is upregulated in GC.9) Preventing or stopping angiogenesis has been studied in tumor patients, including those with GC, from the preclinical stage to clinical applications. The recent REGARD (ramucirumab monotherapy for previously treated advanced gastric or gastro-esophageal junction adenocarcinoma) trial showed that ramucirumab, an anti-angiogenic agent binding to VEGF-R2, achieved the primary endpoint of increased overall survival for patients with advanced, pre-treated gastric cancer.10,11) However, the combination of other VEGF target drugs (such as bevacizumab) with first-line cisplatin therapy failed to increase the overall survival of GC patients, as demonstrated in a randomized controlled trial.10)
PECAM-1 (platelet endothelial cell adhesion molecule), also known as cluster of differentiation 31 (CD31), is a protein that in humans is encoded by the PECAM-1 gene located on chromosome 17. CD31 is found on the surface of platelets, monocytes, neutrophils, and some types of T-cells, and makes up a large portion of endothelial cell intercellular junctions. The encoded protein is a member of the immunoglobulin superfamily and is likely involved in angiogenesis and integrin activation.
In immunohistochemistry, CD31 is used primarily to indicate the presence of endothelial cells in histological tissue sections. This can help evaluate the degree of tumor angiogenesis, which can imply a rapidly growing tumor. Malignant endothelial cells also commonly retain the antigen, so that CD31 immunohistochemistry can be used to reveal both angiomas and angiosarcomas. It can also be seen in small lymphocytic and lymphoblastic lymphomas, although more specific markers are available for these conditions.12)
The medicinal plant Rabdosia rubescens was originally described in the ancient book Materia Medica for Famines in Ming Dynasty of China, it has been traditionally used as an herb to clear away heat and toxic materials, to relieve pain and inflammation. In 1977, it has been included in China Pharmacopoeia. Oridonin (Isodonrubescens(Hemsl.) Hara. molecular formula C20H28O6; relative molecular weight: 364.42; Fig. 1A), is a natural diterpenoid compound extracted from Rabdosia rubescens.13) Oridonin has been found to have antiangiogenic effects,14) trigger apoptosis and reverse chemoresistance,15) and induce autophagy.16–18) Oridonin is also an important antitumor active ingredient of Rabdosia rubescens.19,20)

BGC823 cells (2.5 × 10⁵ cells/well) were treated with various doses of oridonin for 12, 24, 48, or 72 h. Cell numbers were detected by MTT assay and the growth inhibition rate was calculated (3 replications).
Previous studies have indicated the tumor inhibitory potential of oridonin in several human GC cell lines.21,22) However, there has been no investigation of the effects of oridonin on human GC BGC-823 cells, and its growth in vivo. In the present study, we provided convincing anti-cancer evidences of oridonin on human GC, both in vitro and in vivo.
Oridonin (>98%) was purchased from the National Institutes for Food and Drug Control (Beijing, China). The contents of the Oridonin were determined by HPLC. Fluorouracil (5FU) was obtained from Tianjin Jinyao Amino Acid (Tianjin, China). Dimethyl sulfoxide (DMSO), trypsin, acrylamide, methylene diacrylamide, and Tween-20 were from Sigma-Aldrich (St. Louis, U.S.A.). RPMI-1640 cell culture medium was supplied from Gibco (Grand Island, U.S.A.). Fetal calf serum was purchased from Beijing Dingguo Biotech (Beijing, China). Antibodies against VEGF and immunoglobulin G (IgG) were from ZSGB-BIO (Fremont, CA, U.S.A.). 3-[4,5-Dimethylthiazol-2-yl]-2,5-diphenyltetrazolium bromide (MTT) was obtained from Gen View (Tallahassee, FL, U.S.A.). EnVision Two-Step Histostaining reagent, and antibodies against proliferating cell nuclear antigen (PCNA) and CD31 were purchased from Agilent Technologies (San Francisco, CA, U.S.A.). All other chemicals and solvents used were the highest purity grade.
Cell Line, Cell Culture Conditions, and TreatmentsThe human gastric carcinoma cell line BGC823 was a gift from the Digestive Surgery Experimental Center of Shanghai Jiaotong University. The BGC823 cells were cultured in RPMI-1640 complete medium, which was supplied with antibiotics (100 IU/mL penicillin and 100 µg/mL streptomycin) and 10% (v/v) fetal bovine serum, at 37°C in a humidified atmosphere containing 5% CO2 (v/v).
Cells in the 5 experimental groups were treated respectively with 5 final concentrations of oridonin: 3, 6, 12, 24, and 48 µg/mL. There were 4 control groups: positive, negative, vehicle, and blank. Specifically, cells in the positive control group were treated with 5FU at a final concentration of 25 µg/mL. Cells in the negative control were treated with the same volume of culture medium, but without the test drugs. Cells in the vehicle control were treated with the largest volume DMSO as used in the 48 µg/mL oridonin experimental group. The wells in the blank control were filled with culture medium, without cells.
Cell Viability AssayBGC823 cells were harvested in logarithmic growth phase from culture flasks with trypsin and then re-suspended in fresh RPMI-1640 complete medium. The cells were seeded into 96-well microplates at a final concentration of 2.5 × 10⁵/mL, 200 µL/well, and then placed in an incubator with 5% CO2 (v/v) at 37°C. The wells of the blank control group were filled with culture medium (200 µL/well) without cells. The cell culture medium was discarded every 12 h, until the cells were attached.
Wells in the experimental group were respectively filled with 200 µL of the test concentrations of oridonin. Wells in the positive group were supplemented with 200 µL/well of 5FU at a final concentration of 25 µg/mL. The wells of the negative control group were supplemented with 200 µL/well of culture medium only. Wells in the blank control group were only supplemented with 200 µL/well of culture medium without the test cells.
Cells in each group were incubated for 20, 24, 48, or 72 h, after which 20 µL of freshly prepared MTT solution (5 mg/mL) was added to each well. After incubation at 37°C for 4 h, the culture medium was discarded and fresh DMSO (150 µL) was added to each well. The plates were shaken for 10 min with a micro-oscillator to solubilize the water-insoluble purple formazan crystals. The blank control group was used as reference.
The amount of MTT-formazan was directly proportional to the number of living cells. This was determined by measuring the optical density (OD) at 570 nm wavelength using an automatic microplate reader (model 680; Bio-Rad Laboratories, Hercules, CA, U.S.A.).
The experiments were repeated 3 times. The cell inhibition rate (%) was calculated as: (l – OD of the test drug well/OD of the negative control well) × 100%. The IC50 of oridonin at each incubation time (12, 24, 48, or 72 h) was calculated using the regression equation.
Cell Apoptosis Analysis by Dual Acridine Orange/Ethidium Bromide (AO/EB) Fluorescent StainingHuman gastric carcinoma BGC823 cells at the logarithmic growth phase, cultured in 6-well plates, were treated with oridonin at final concentrations of 3.75, 7.5, or 10 µg/mL. Cells in the negative control group were cultured with only the culture medium without drugs. Cells in the positive control group were treated with 5FU at 10 µg/mL. After a 24-h incubation, the cell culture medium was discarded and 15 µL of AO/EB fluorescent staining solution was added. The cells were then observed under a fluorescence microscope and photographically recorded.
Immunohistochemistry Analyzing VEGF ProteinAfter the human gastric carcinoma BGC823 cells were successfully grown on the chamber slips, the cells were treated with oridonin at final concentrations of 3.75, 7.5, or 10 µg/mL, for 24 h. The cells were then fixed and stored in the refrigerator for immunocytochemical staining, which was performed using the EnVision method with Diaminobenzidine (DAB), in accordance with the manufacturer’s protocol.
In brief, the fixed cells on the coverslips were washed with phosphate buffered saline (PBS) 3 times. The endogenous peroxidase was blocked with 0.3% H2O2 for 10 min and washed with PBS containing 1% Tween 20, 3 times ×5 min. Cells were treated with a permeation solution of Triton X-100 for 10 min and then incubated with VEGF primary antibody (Ab) (1: 200) at 37°C for one hour (for the blank control, the primary antibody was replaced with PBS). The cells were washed with PBS 3 times ×5 min and incubated with a secondary antibody of goat anti-mouse IgG-horseradish peroxidase (HRP) at 37°C for 40 min. The cells were washed with PBS 3 times ×5 min and incubated with 3,3′-diaminobenzidine (DAB) coloration solution for 10 min. The reaction was terminated with water. Counterstaining was conducted with Harris hematoxylin for 1 min. The cells were dehydrated with 95 and 100% ethanol and a xylene series; and sealed with neutral gum.
The nucleus stained blue. Yellow or yellow-brown stain indicated the positive presence of VEGF, which was located in the cytoplasm, cell membrane, or both. The experiment for each concentration of oridonin was repeated using 5 different coverslips with cells. Five fields of view were counted for each coverslip under 200× visual fields. The number of positively stained cells in more than 500 tumor cells was counted, and the positive percentage (%) was calculated. The percentage of positive cells was calculated using the following equation: positive percentage, % = number of positive cells within the field of view/total number of cells within the field of view ×100%. The percentage of positive cells was scored as follows: <25%, −; 25–50%, +; 50–75%, ++; ≥75%, +++.
Cell Morphological Observation by Inverted MicroscopeHuman gastric carcinoma BGC823 cells were cultured in 25 cm2 cell culture bottles. At the logarithmic growth phase, the cells were treated with oridonin at final concentrations of 0, 3.75, 7.5, or 10 µg/mL for 24, 48, or 72 h, or with 5FU at final concentrations of 10 µg/mL for 24, 48, or 72 h. The cell morphology was observed under an inverted microscope.
In Vivo Model Establishment and TreatmentThe Animal Care and Use Committee of Zhejiang University of Traditional Chinese Medicine approved all the procedures and animal experiments in this study, including establishment and treatment of the in vivo model, xenograft tumor resection for tumor weight analysis, and immunohistochemistry assay. All the experiments with animals were performed in accordance with the regulations for using animals for laboratory experiments.
Six-week-old female BALB/c nude mice, weighing 18 to 20 g, were purchased from Shanghai SLAC Laboratory Animal (Shanghai, China); animal certificate number SCXK (Shanghai) 2003-003. Mice were maintained in separate cages at the Animal Experiment Center of Zhejiang University of Traditional Chinese Medicine. Mice were kept in a pathogen-free environment, maintained under a 12 h-light/dark cycle, with free access to water and food.
Animal experiments were performed to evaluate orthotopic tumor growth of human gastric carcinoma cells in vivo. In brief, BGC823 cells in logarithmic phase were harvested by trypsin ethylenediaminetetraacetic acid (EDTA) digestion, washed with PBS, and re-suspended in serum-free RPMI-1640 at a final concentration of 1 × 10⁷ cells/mL. A cell suspension with 1 × 10⁶ cells in 100 µL was injected into the right flank of each anesthetized nude mouse. One week after inoculation, the tumors were measured using Vernier calipers, and the tumor volumes were calculated using the following formula: 0.5 × a × b, where a is the largest diameter and b is the square of smallest diameter.
Forty mice inoculated with BGC823 cells with the same tumor volume were then randomly and equally apportioned into the following 5 groups: oridonin groups of 20, 40, or 80 mg·kg−1·d−1; a positive control, and a negative control. Mice in the oridonin groups were administered intragastrically 100 µL oridonin at 20, 40, or 80 mg·kg−1·d−1 every day for 14 d. Mice in the negative control group were given 100 µL of saline via intragastric administration, once each day for 14 d. Mice in the positive control group were given 100 µL 5FU (20 mg·kg−1·d−1) via intragastric administration, once every other day for 14 d. Tumor formation and survival of the mice was observed every day. The tumor volumes were measured every 4 d and body weights were measured every 3 d.
Mice were killed by cervical dislocation after administration of the above treatments for 14 d, and tumors were isolated and weighed. The tumor inhibition rate was calculated using the following formula: tumor inhibition rate, % = (1− average tumor weight in the experimental group/average tumor weight in the negative control group) × 100%.
Immunohistochemical Analysis of PCNA, VEGF, and CD31 ProteinsXenograft tumors were resected immediately after the mice were killed, and fixed in 10% neutral buffered paraformaldehyde at 4°C for 24 h. Selected samples were embedded in paraffin, sectioned (4 µm thick), deparaffinized, rehydrated with PBS (pH 7.4), and incubated with aqueous 3% H2O2 for 10 min. The antigen was retrieved with high temperature and pressure for 100 s, blocked with 5% bovine serum albumin at room temperature for 30 min, and stained serially with primary antibodies (PCNA, VEGF, or CD31) at 4°C overnight. The slices were incubated with a secondary antibody of goat anti-mouse IgG-HRP at 37°C for 40 min; washed with PBS 3 times ×5 min; and incubated with DAB for 1 to 3 min. The reaction was terminated with water and counterstained with hematoxylin. Sections were mounted with neutral gum after transparency with xylene. Images were obtained with an imagine autoanalysis system (Olympus BX50, Olympus, Tokyo, Japan) and one representative area was shown. The nucleus stained blue, and the positive presence of the analyzed proteins was indicated by a stronger brown color.
VEGF protein levels were evaluated by semi-quantitative analysis using a HPIAS-1000 pathology analysis system (Tongji Qianping Imaging Engineering, Wuhan, China). In brief, the images were collected by the pathology analysis system, and the color intensity of the positive VEGF staining in the cells was evaluated by semi-quantitative analysis. Five visual fields were randomly collected in each slice (200×). Five average optical density values were automatically analyzed within the 5 fields, and the average intensity was calculated for statistical analysis.
The PCNA number was presented as a PCNA labeling index, which was calculated as the percentage of the total number of cells that were PCNA-positive.
Quantitative Analysis of mRNA LevelsQuantitative real-time PCR (qRT-PCR) with specific primers was performed to determine the relative mRNA levels of VEGF AND Integrin-β3. The primer sequences were as follows: VEGF (forward 5′-GTA CCT CCA CCA TGC CAA GT-3′ and reverse 5′-TCA CAT CTG CAA GTA CGT TCG-3′), Integrin-β3 (forward 5′-TGC TCC AGA GTC TAT TGA GTT CC-3′ and reverse 5′-GAG AAA GAC AGG TCC ATC AAG TAG-3′), β-actin (forward 5′-AAA TCG TGC GTG ACA TCA AA-3′ and reverse 5′-AAG GAA GGC TGG AAA AGA GC-3′). Total RNA was isolated from xenograft tumors using TRIzol reagent (Invitrogen; Thermo Fisher Scientific) according to the manufacturer’s instructions. All PCRs were performed in a total volume of 10 µL using a SYBR Premix Ex Taq Kit (TaKaRa Bio, Shanghai, China). The amplification conditions for qRT-PCR were as follows: one cycle at 95°C for 30 s, followed by 45 cycles of 95°C for 5 s and 60°C for 20 s, and a single cycle of 95°C for 15 s, 60°C for 15 s, and 95°C for 15 s. Relative expression levels were calculated using the 2−ΔCT method with β-actin for normalization. Each sample was evaluated in triplicate and measurements were repeated independently at least thrice. An average threshold (Ct) was retrieved for data analysis.
Western Blotting Analysis of Protein LevelsWestern blotting was carried out to verify VEGF and integrin β3 expression. Total protein was isolated from tissues samples, and approximately 30 µg of protein was separated by 12% polyacrylamide gelunder reducing conditions. After being transferred to a polyvinylidenedifluoride (PVDF) membrane (GE Healthcare, Fairfield, Connecticut, U.S.A.), 5% bovine serum albumin (BSA) was used for blocking, and the membranes were incubated with anti-VEGF (1 : 1000; Abcam, U.S.A.), anti-Integrin β3 (1 : 1000; Abcam) and anti-β-actin (1 : 2,000, Cell Signaling Technology, U.S.A.) primary antibodies, followed by secondary HRP-conjugated IgG Ab (1 : 8000, Jackon ImmunoResearch, U.S.A.). The membranes were developed with electrochemiluminescence (ECL) reagent (Generay, Shanghai, China) and exposed to autoradiographicfilms.
Statistical AnalysisThe measurement data are shown as mean ± standard deviation. The data were analyzed using SPSS 13.0 statistical software. Data among groups were compared by one-way ANOVA with post hoc contrasts by the Tukey–Kramer method. After Kolmogorov–Smirnov test of normality, the correlation ANOVA was measured by the Pearson’s Correlation Coefficient test. A p-value <0.05 was considered statistically significant.
To evaluate the effect of oridonin on the survival of the GC cells, BGC823 cells were treated with different concentrations (3, 6, 12, 24, or 48 µg/mL) of oridonin for various incubations times (12, 24, 48, or 72 h; Table 1; Fig. 1B). Cell viability was quantitated by MTT assay.
| 12 h | 24 h | 48 h | 72 h | ||
|---|---|---|---|---|---|
| Control | Conc., µg/mL | 0 | 0 | 0 | 0 |
| Oridonin | 3 | 8.02 ± 3.54 | 7.30 ± 1.31 | 7.95 ± 2.63 | 7.78 ± 4.45 |
| 6 | 15.41 ± 8.629 | 15.18 ± 4.51 | 14.24 ± 5.67 | 16.41 ± 1.48a) | |
| 12 | 34.36 ± 13.98a) | 47.41 ± 2.20a,b) | 65.28 ± 2.26a,b) | 73.29 ± 6.48a) | |
| 24 | 70.17 ± 4.29a) | 84.42 ± 4.34a,b) | 96.52 ± 1.18a,b) | 98.23 ± 1.39a) | |
| 48 | 75.98 ± 2.92a) | 90.41 ± 0.77a,b) | 98.26 ± 0.54 | 98.66 ± 1.03 | |
| 5FU | 25 | 22.20 ± 5.71 | 44.90 ± 5.29 | 65.50 ± 1.50 | 91.59 ± 6.25 |
a) p < 0.05 compared with previous concentration at the same time; b) p < 0.05 compared with previous time at the same concentration.
The results showed that the proliferation of BGC823 cells treated with oridonin was significantly less than that of the negative control group (Fig. 1). In the groups treated with 3 and 6 µg/mL oridonin for 72 h, the number of cells were, respectively, 7.78 and 16.41% that of the negative control. In the groups treated with 12, 24, and 48 µg/mL oridonin for 72 h, the number of cells were 73.29, 98.23, and 98.66% that of the negative control (all p < 0.05). In the groups treated with 48 µg/mL oridonin for 12, 24, 48, and 72 h, the number of cells were 75.98, 90.41, 98.26, and 98.66% that of the negative control (all p < 0.05). This indicated that oridonin had a significant anti-tumor effect on human GC BGC823 cells, showing dose–effect and time–effect associations. The IC50s of oridonin at 12, 24, 48, and 72 h were 17.08, 12.41, 9.52, and 8.76 µg/mL, calculated by the linear regression equation.
Morphologies of Human GC BGC823 Cells Were Destroyed by OridoninThe results above suggested that oridonin could significantly inhibit human GC BGC823 cells. To determine whether the antitumor activity of oridonin was associated with morphological changes, the morphological changes of BGC823 cells were observed under an inverted microscope (Fig. 2A). The cells of the negative control group had normal morphology, closely adhered to the bottom of the culture bottle, appeared stone-like with high density, active growth and cell processes, and dividing cells were more common than non-dividing cells.

(A–E) At 24 h. (A) Negative control; (B) 5FU 10 µg/mL; (C) Oridonin 3.75 µg/mL; (D) Oridonin 7.5 µg/mL; (E) Oridonin 10 µg/mL. (F–H) At 48 h. (F) Oridonin 3.75 µg/mL; (G) Oridonin 7.5 µg/mL; (H) Oridonin 10 µg/mL. (I, J) At 72 h. (I) Oridonin 10 µg/mL; (J): 5FU 10 µg/mL.
Compared with the control, after treatment with 10 µg/mL 5FU, the BGC823 cells in the positive control group had less density and proliferation ability, with more floating dead cells (Fig. 2B). After treatment with oridonin, the BGC823 cells in the experimental group were also lower in density and proliferation ability with fewer cell processes, with rounder and smaller shapes. The adhesion ability of cells was also less. The number of floating dead cells was higher, which showed dose-dependent and time dependent associations with oridonin.
Compared with the negative control group, after treatment with oridonin for 24 h the cell density was inversely associated with the oridonin concentration (3.75, 7.5, 10 µg/mL; Figs. 2C–E). After treatment with oridonin for 48 or 72 h, this negative association became progressively more significant (Figs. 2F–J).
Oridonin Induced Apoptosis of Human GC BGC823 CellsIn the negative control group, the nucleus chromatin of BGC823 cells appeared as bright green fluorescence (Fig. 3A). The nuclei were almost round with clear edges and uniform staining.
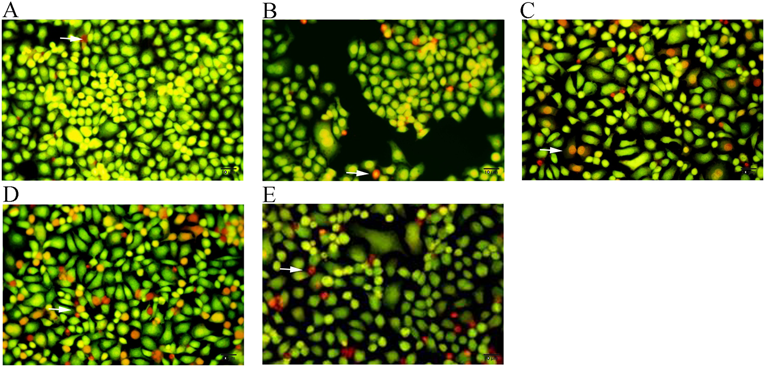
Cell morphologies were observed under a fluorescence microscope after AO/EB staining. BGC823 cells were incubated in 24-well plates for 24 h with (A) culture medium alone; (B) oridonin 3.75 µg/mL; (C) oridonin 7.5 µg/mL; (D) oridonin 10 µg/mL; and (E) 5FU 10 µg/mL. (200×). (Color figure can be accessed in the online version.)
In the experimental group, the nuclear chromatin was green with pycnosis, or reddish-orange with pycnosis, or rounded nuclear after treatment with 3.75, 7.5, or 10 µg/mL oridonin for 24 h. The nucleus was reduced in size, and its chromatin was hyperchromic massive or granular, aggregating around the nucleus or cleaving into fragments with apoptotic bodies compared with the control. At higher concentrations of oridonin, the number of apoptotic cells and necrotic cells were higher, and the morphological changes of the BGC823 cells were more significant (Figs. 3B–D)
In the positive control (5FU) group, after treatment with 10 µg/mL 5FU for 24 h, the nucleus was stained yellow-green or reddish-orange, and the cell morphology showed varying degrees of apoptosis and necrosis (Fig. 3E).
VEGF Level in BGC823 Cells Treated with Oridonin Was Less than That of the ControlBGC823 cells in both the oridonin intervention and control groups showed different degrees of positive VEGF expression, as shown by immunocytochemical staining. VEGF-positive staining was mainly in the cytoplasm, with little in the cell membrane. Compared with the control group with medium only, which showed strong positive VEGF staining (+++), the VEGF staining in the oridonin intervention group was significantly less, specifically VEGF (++), VEGF (+), or VEGF (−) in the BGC823 cells treated with oridonin at 3.75, 7.5, and 10 µg/mL for 24 h (Fig. 4).

VEGF levels were scored as (A) +++; (B) ++; (C) +; (D) −; or (E) ++. (200×, 400×). (Color figure can be accessed in the online version.)
To explore further whether oridonin can suppress human GC growth in vivo, BGC823 cells were inoculated into the right flanks of nude mice. One week after the inoculation, mice were treated for 14 consecutive days with either oridonin (20, 40, or 80 mg/kg/body weight) in the experimental groups, the same volume of saline in the negative control group, or 5FU (20 mg·kg−1·d−1) in the positive control group. After 14 d, mice were euthanized to compare the tumor burdens of the control (saline) and oridonin-treated group.
The oridonin treatment was associated with significantly less tumor growth based on tumor weight (p < 0.05, Fig. 5A), while body weight was unaffected (p = 0.629, Fig. 5B). Although, the decreasing of tumor volume in high dose oridonin group was more conspicuous than the positive control group, the p value did not have significance (p = 0.061, Fig. 5C). No mice died in the 20 mg/kg oridonin group during the experimental period, while one mouse died in each of the negative control, 5FU positive control, and mid- and high-dose oridonin groups (Fig. 5D). In the low-, mid-, and high-dose oridonin groups and positive control group, the tumor inhibition rates were 16.09, 27.19, 43.72, and 18.13%, respectively, (Fig. 5F). The inhibition rate of oridonin was dose-dependent and had significant difference between the high-dose group and negative group (p < 0.01).

Change in (A) tumor weight; (B) body weight; and (C) tumor volume; (D) Survival rates of mice, in oridonin-treated, and positive and negative control groups, after treatment for 14 d; (E) Image of the xenograft tumors isolated from each group; (F) Inhibition rates of oridonin in BGC823 xenograft. * p < 0.05, ** p < 0.01, compared with the control. (Color figure can be accessed in the online version.)
To investigate further the inhibitory effect of oridonin treatment on human GC growth in vivo, the levels of PCNA in xenograft tumor tissues were detected (Figs. 6A–F). Staining for PCNA showed that the oridonin treatment was significantly associated with the inhibition of PCNA expression in tumors, as indicated by the less brown nuclear staining (Figs. 6A–E), and the quantitative analysis (Fig. 6F). This further confirmed that oridonin could inhibit human GC cell proliferation in vivo.

The red immunostaining indicated the (200×). (F) Quantitative analysis of PCNA positive expression in Figs. 6A–E, * p < 0.05, ** p < 0.01, compared with the control. (Color figure can be accessed in the online version.)
To explore whether the therapeutic function of oridonin in human GC in vivo is associated with tumor blood vessel formation, the mRNA expressions of VEGF and integrin β3 in tumor tissues of xenograft-bearing nude mice were detected.
In the low-, mid-, and high-dose oridonin groups, the mRNA levels of VEGF became progressively less and compared with the negative control, with significant differences between the mid- and high-dose groups (Fig. 7C).

(A) VEGF protein expression by Western blot. (B) Integrin β3 protein expression by Western blot. (C) VEGF mRNA expression by qRT-PCR. (D) Integrin β3 mRNA expression by qRT-PCR. * p < 0.05, ** p < 0.001, compared with the control.
In the low-, mid-, and high-dose oridonin groups, the mRNA levels of integrin β3 became progressively less and compared with the negative control, with significant differences between the low- and mid-dose groups (Fig. 7D). The differences were also significant between the high-dose oridonin group and the negative control.
Consist with the qRT-PCR outcomes, Western-blotting verification showed that the protein levels of VEGF and integrin β3 were gradually down-regulated as the oridonin administration dose increased. (Figs. 7A, B).
To evaluate the MVD of the BGC823 xenografts, the protein levels of CD31 and VEGF were determined by immunohistochemical assay. In the BGC823 xenografts, the oridonin intervention and control groups differed in the levels of positive VEGF staining, and the VEGF-positive staining mainly appeared in the cytoplasm, with less in the cell membrane. In the blank control group, almost all the cancer cells in the tumor tissue were stained brown-to-dark brown, while there were only a few cells in the oridonin groups that were positively stained. The amount of VEGF protein stain in the cytoplasm of the cancer cells decreased gradually with the increase in oridonin concentration. There was a significant difference between each oridonin group and the negative control group, and between the high-dose oridonin and low- or mid-dose oridonin groups (Figs. 8A–F).

VEGF and CD31 protein was determined by immunohistochemistry to quantify microvessels in BGC823 xenografts. (A–F) VEGF. (G–L) CD31. (A) and (G) saline 0.1 mL/d; (B) and (H) oridonin 55 µmol/kg/d; (C) and (I) oridonin 110 µmol /kg/d; (D) and (G) oridonin220 µmol/kg/d; and (E) and (K) 5FU 153 µmol/kg/d (200×). (F) Quantitative analysis of (A–E). (L) Quantitative analysis of (G–K), * p < 0.05, ** p < 0.01, compared with the control. (Color figure can be accessed in the online version.)
Positive staining for CD31 appeared brown in endothelial cells. The size and shape of the microvessels were obviously different from the negative control group: some of them only had a single endothelial cell or endothelial cell cluster, some had an unclear lumen or irregular shape, and the distribution of microvessels was heterogeneous (Figs. 8G–L). The number of CD31+ blood vessels in 5 random visual fields was calculated under the microscope and the density of microvessels were represented as mean ± standard deviation. A large number of CD31+ cells were observed in the negative control group, which was less in the oridonin treatment groups in a dose-dependent association (Table 2, Fig. 8L). The difference between the negative control group and each oridonin group was statistically significant.
| CD31 protein | ||
|---|---|---|
| Negative control | 26 ± 3.786 | |
| Oridonin dose | Low | 18.63 ± 7.425* |
| Oridonin | Mid | 15 ± 7.303 |
| Oridonin | High | 9.14 ± 4.298* |
| 5FU | 9.00 ± 2.517 |
*p < 0.05 compared with previous group. MVD: microvessel density.
The correlation between MVD and tumor inhibition rate, VEGF mRNA expression, integrin β3 mRNA expression, or PCNA protein levels in 29 nude mice in the negative control and oridonin treatment groups was measured using Spearman’s method. The results showed that VEGF mRNA, integrin β3 mRNA, and PCNA protein levels positively correlated with MVD in the tumors (r = 0.779, p < 0.001; r = 0.863, p < 0.001; r = 0.812, p < 0.001). However, the tumor inhibition rate negatively correlated with MVD (r=−0.577, p < 0.01). This suggests that oridonin may inhibit tumor growth by inhibiting the expression of VEGF, integrin β3, and PCNA, reducing the formation of microvessels.
The plant Rabdosia rubescens has been applied in Traditional Chinese Medicine for the treatment of human malignancies for decades.23,24) Studies have shown that oridonin is an important antitumor active ingredient of Rabdosia rubescens.25–27) However, the anti-GC activity and mechanism of oridonin has not been well clarified.
The present study attempted to identify novel functions of oridonin. We found that oridonin inhibited human GC BGC823 cell viability in a time- and concentration-dependent manner, as shown by the MTT assay. The IC50s of oridonin at 12, 24, 48, and 72 h were 17.08, 12.41, 9.52, and 8.76 µg/mL, respectively.
In addition, the anti-GC function of oridonin was associated with oridonin-induced apoptosis, as confirmed by AO/EB staining and AO/EB fluorescent staining observed under a fluorescent microscope, which can be used to identify apoptosis-associated changes in cell membranes during the development of apoptosis. This technique can also accurately determine the stage of apoptosis.26,27) Therefore, AO/EB staining can be used in tumor drug sensitivity tests.
For the concern about the excessive cell death caused by high drug concentrations, we adopted relatively low concentrations of 24h-oridonin treatment (3.75, 7.5, and 10 µg/mL, while 24h-IC50 is 12.41 µg/mL) to ensure the cell changes observation went successfully. Under the fluorescence microscope, 4 types of cell morphologies were observed: viable cells with nuclear chromatin stained green and normal structure; viable apoptotic cells, fragmented or with shrinkage, and green nuclear chromatin; non-viable apoptotic cells, fragmented or with shrinkage, and reddish-orange nuclear chromatin; and non-apoptotic necrotic cells with reddish-orange nuclear chromatin and normal structure.
The anti-GC effect of oridonin was further confirmed in the BGC823 cell xenograft model. The results showed an oridonin concentration-dependent reduction in tumor weight and volume, and concomitant associated increase in tumor inhibition rate. Although, the tumor weight and volume in high dose oridonin group seemed much lower than the 5 Fu positive control group, the difference did not arrive the significant value. The comparison of the effects and side effects of the two drugs, as well as the feasibility of combined drugs using worth further study. Oridonin putatively has an anti-angiogenesis effect, and tumor blood vessel formation has a crucial role in the development of cancer.28,29) Therefore, we further explored whether the anti-GC effect of oridonin was due to the inhibition of blood vessel formation via inhibition of VEGF or CD31 expression.
PCNA was discovered originally as the antigen to autoimmune antibody in the sera of patients with systemic lupus erythematosus.14,30) It was initially considered that PCNA was produced during cell proliferation, especially during the late G1 and S phases.31,32) However, in recent years, PCNA has been thought to be a molecular platform that interacts with various processes involved in genome maintenance, transmission, duplication, and cell-cycle regulation.33,34) Since cell proliferation is required for tumor progression, much attention has been paid to the function of PCNA in malignancies.33) Indeed, PCNA may be a prognosticator of poor survival and a promising therapeutic target in cancer, including gastric carcinoma.35–38) Therefore, in the present study PCNA was detected to evaluate further the anti-GC activity of oridonin. Our results showed that oridonin treatment was significantly and inversely associated with PCNA levels in BGC823 cell xenografts. Furthermore, we found that the tumor inhibition rate negatively correlated with MVD, and VEGF, integrin β3, and PCNA levels positively correlated with MVD.
As we stated, the tumor suppressive roles of oridonin have been proven in several types of GC cells such as AGS, HGC-27, MGC80-3, MKN 45, and SNU-216. The most commonly verified mechanism was p53-and caspase-3-related cell apoptosis.39–41) Our laboratory has also shown oridonin promoted the cell apoptosis of HCG-27 cells via enhancing the Apaf-1, cytochrome c and caspase-3 pathway.42) But yet, research of oridonin actions on BGC-823 cells has rarely been reported, and rare animal experiment has been performed to verify the anti-cancer ability of oridonin in vivo. That is the novelty our current study presented. However, there were several limitations of this study. First, only phenotypes such as apoptosis and vascularization were detected, while the underlying molecular mechanisms were not explored. Secondly, the mechanisms of anti-GC effect of oridonin was assessed only by the assay of RT-PCR, and immunohistochemistry, more detailed cellular experiments such as enzyme-linked immunosorbent assay (ELISA) and Western-blot were lacked to confirm the results. Likewise, in the murine model experiment part, examination methods we applied were relatively monotonous, and merely focused on tumor growth and angiogenesis that without in-depth exploration. Therefore, the comprehensive role and mechanisms of oridonin in GC should be probed into in our future work.
In conclusion, this study showed that oridonin inhibits BGC823 cell growth and tumor angiogenesis both in vitro and in vivo in a dose-and-time dependent manner, by inhibiting VEGF, integrin β3, and PCNA levels, and reducing the formation of microvessels. Thus, oridonin has a potential role in therapy for GC.
This study was supported by Grants from the Traditional Chinese Medicine Science and Technology Project of Zhejiang Province of China (Grant number 2018ZA015) and by the Natural Science Foundation of Zhejiang Province of China (Grant number LY18H160039).
Qiong Yang and Shuguang Li conducted all experiments. Wenjie Xia, and Zaiyuan Ye supervised the experiments. Wengdong Ma and Kun Yu conducted most of the molecular biology experiments, and Qi Zhang participated in the in vivo research with nude mice. Qiong Yang wrote the final article.
The authors declare no conflict of interests.