Regular Articles
Synergistic Interaction of Ochratoxin A and Acrylamide Toxins in Human Kidney and Liver Cells
2020 Volume 43 Issue 9 Pages 1346-1355
Details
2020 Volume 43 Issue 9 Pages 1346-1355
Ochratoxin A (OTA) is a mycotoxin produced by Aspergillus and Penicillium, and it is found in many foods. Acrylamide (AA) can be produced in foods treated at high temperatures. In this study, we investigated the combined toxicity of OTA and AA against human renal and hepatic cells in vitro. The concentration at which the synergistic effect of OTA and AA occurs was determined using the combination index obtained from the cell viability results for OTA and AA individually or in combination. The synergistic toxicity of both substances was evaluated by cell viability and the production of reactive oxygen species. In addition, apoptosis-related markers were significantly upregulated by OTA and AA individually or in combination. To determine the combined toxic effects of OTA and AA on the cells, the levels of enzymes involved in the phase I reaction and apoptosis-related markers were determined using quantitative (q)PCR and Western blot. The expression levels of CYP enzymes CYP1A1 and CYP1A2 involved in the phase I reaction significantly increased when the cells were treated with OTA and AA in combination. The expression of apoptosis-related markers, Bcl2-associated X protein (Bax) and caspase 3, also increased when the cells were treated with OTA and AA in combination. Therefore, the synergistic toxicity of OTA and AA suggests that such effects may contribute to nephrotoxicity and hepatotoxicity.
Ochratoxin A (OTA, C20H18O6NCl, molecular weight: 403.8), a poorly soluble, colorless, and odorless crystalline compound, is a fungal toxin produced by two species of fungi, Aspergillus and Penicillium.1) It is present in various food groups, including rice and coffee, consumed worldwide.2) OTA causes renal toxicity, hepatotoxicity, neurotoxicity, immunotoxicity, genotoxicity, and carcinogenicity and is classified as a group 2B substance in International Agency for Research on Cancer (IARC) and a potential carcinogen in humans.3–5)
Acrylamide (AA, C3H5NO, molecular weight: 71.079), soluble in water, odorless and white crystalline solid compound, is used in many chemical industries and laboratories, and it is often found in French fries, potato chips, and cereals.6) AA is produced when starch-rich foods are heated to temperatures above 120°C by a reaction between reducing sugar and asparagine, called the Maillard reaction.7,8) AA is a neurotoxic, carcinogenic, and reproductive toxic chemical, and it has been classified by IARC as a group 2A substance.9–12)
The main exposure route for OTA and AA is oral ingestion through food intake.13–15) The toxic substances entering the body are delivered to the liver and kidney, which are the target organs that generally contain the highest concentration of enzymes involved in xenobiotic activation.16) The kidney is an organ that contributes greatly to xenobiotic metabolism, receives about 25% of cardiac output, and discharges metabolic waste and xenobiotics from the circulatory system. During this process, the kidney has a relatively high concentration of toxic substances.17) It may also be exposed to toxic substances through the activation of xenobiotic metabolism in the renal tubule epithelium; thus, it can be said that through the urine concentration process the kidneys are subjected to a higher concentration of toxic substances than other tissues.18) In the case of liver, its major function is to eliminate endogenous and exogenous compounds through metabolism19); accordingly, they are metabolized to increase their solubility in the liver, facilitating their elimination.20,21) CYP plays an important role in the phase I metabolism of many harmful substances, such as toxins, and it is present in various organs such as the liver and kidney.22,23) Among the many CYP enzymes, CYP1A1 and CYP1A2 are CYP enzymes that commonly metabolize ochratoxin A and acrylamide.24–26)
During metabolism between ochratoxin A, acrylamide and CYP1A enzymes, excess reactive oxygen species (ROS) are generated, leading to oxidative stress.25,27) This oxidative stress in the cells activates caspase 3, resulting in apoptosis.28) Caspase 3 is a caspase family member of the main executioner which plays an essential role in apoptosis. When apoptosis occurs in cells, caspase 3 is activated and plays an important role in cellular morphogenesis. For this reason, caspase 3 expression is used to assess apoptosis.29)
Because of the presence of OTA in various foods, many studies have been conducted to develop methods to mitigate OTA-induced toxicity.30,31) Foods are subjected to heat treatment to reduce OTA,32) but the consequent possibility of acrylamide production during such a process cannot be excluded.6) OTA and AA may also be detected simultaneously in foods such as cereal, coffee and beer.6,15,33)
Thus, it is necessary to study the combined toxic effect of OTA and AA, but no studies on the combined toxic effect of OTA and AA have been conducted. Therefore, this study aimed to examine the toxicity and its mechanism underlying the interaction of OTA and AA in kidney and liver cells.
OTA was bought from Cfm Oskar Tropitzsch GmbH (Marktredwitz, Germany). AA was purchased from GE Healthcare (Piscataway, NJ, U.S.A.). Dulbecco’s modified Eagle’s medium-low glucose (DMEM) and Rosewell Park Memorial Institute (RPMI) 1640 medium were obtained from Gibco (Grand Island, NY, U.S.A.). Penicillin/streptomycin solution, 0.25% trypsin–ethylenediaminetetraacetic acid (EDTA), and fetal bovine serum (FBS) were obtained from Hyclone (Logan, UT, U.S.A.). 4-(2-Hydroxyethyl)piperazine-1-ethanesulfonic acid (HEPES), sodium bicarbonate, dextrose, dimethyl sulfoxide (DMSO), 2′,7′-dichlorodihydrofluorescein diacetate (DCFH-DA), reduced glutathione (GSH), 3-(4,5-dimethyl-2-thiazolyl)-2,5-diphenyl-2H-tetrazolium bromide (MTT) were purchased from Sigma-Aldrich (St. Louise, MO, U.S.A.). A bicinchonic acid (BCA) kit and SuperSignal™ West Femto were obtained from Thermo Scientific (Waltham, MA, U.S.A.). An enhanced chemiluminescence (ECL) detection kit was acquired from Abclone (Seoul, Republic of Korea). Monoclonal mouse antibodies against CYP1A1 (SC-393979), caspase 3 (SC-56053), glyceraldehyde-3-phosphate dehydrogenase (GAPDH, SC-32233) and polyclonal rabbit anti-CYP1A2 (SC-30085) antibody were obtained from Santa Cruz Biotechnology (Dallas, TX, U.S.A.). Polyclonal rabbit anti-Bcl2-associated X protein (Bax, 2772S) antibody and monoclonal rabbit anti-Cleaved Caspase 3 (9664S) antibody were obtained from Cell Signaling Technology (Danvers, MA, U.S.A.).
Isobologram Method for Assessing the Effects of OTA and AATo determine the interaction toxicity of OTA and AA on liver and kidney cells exposed to both toxins, we used the method reported by Chou and Talalay.34)
The combination index (CI) value can be calculated using the following general equation:
 |
where, n(CI)x represents the combination index for n chemicals at x% effect, D is the concentration of the chemical, (Dx)1−n is the sum of concentration of n chemicals that exerts x% effect in combination, [D]j/∑1n [D] is the proportionality of the concentration of each of the n chemicals that exerts x% effect in combination, and (Dm)j{(fax))j/[1 − (fax)j]}1/mj is the concentration of each chemical alone that exerts x% inhibition. Dm represents the median effect, m is the slope of the median-effect plot, and fax is the fraction inhibition of x% inhibition. CI <1 means synergism, CI = 1 means additive effect, and CI >1 means antagonism. IC25, IC50, and IC75 represent the concentrations required for 25, 50, and 75% inhibition, respectively.
Cell CultureHK-2, the human proximal tubule epithelial cell, was obtained from the Korean Cell Line Bank (Seoul, Republic of Korea) and incubated in RPMI 1640 medium containing 2 g/L of sodium bicarbonate, 0.11 g/L of sodium pyruvate, 2.383 g/L of HEPES, 2.5 g/L of dextrose, 100 U/mL of penicillin and streptomycin, and 10% FBS (v/v). Human hepatocyte HepG2 was bought from the American Type Culture Collection (ATC C) and incubated in DMEM containing 100 U/mL of penicillin and streptomycin, 3.7 g/L of sodium bicarbonate, and 10% FBS (v/v). The cells were cultured at 37°C in a humidified atmosphere containing 5% CO2. The HK-2 and HepG2 cells used in the experiments (passages 21–25) were sub-cultured when the density reached 80–90%.
Cytotoxicity AssayCell viability was measured using the MTT assay. The HK-2 and HepG2 cells (1 × 10⁵ cells/well) were seeded for 24 h in 24-well plates, followed by treatment with OTA and AA for 48 h; then, MTT solution was added to the well and incubated at 37°C for 4 h. Next, the medium was removed, and 200 µL of DMSO was added to each well to resolve the formazan crystals. Finally, optical density at 540 nm was measured using a multiplate reader (EL-808; BioTek, Winooski, VT, U.S.A.).
Measurement of Intracellular Generation of ROSTo determine the amount of ROS produced by the HK-2 and HepG2 cells, the amount of DCF-DA produced by the reaction of DCFH-DA with ROS was measured using fluorescence spectrophotometry. The HK-2 and HepG2 cells were seeded into a 96-well plate at a density of 2 × 10⁴ cells/well. After 24 h, the supernatant was removed, and the cells were exposed to 10 µm of DCFH-DA at 37°C for 30 min, followed by treatment of the HK-2 cells with 100 nM OTA and 1 mM AA or treatment of the HepG2 cells with 125 nM OTA and 1.25 mM AA for 48 h. Then, the fluorescence (at the following wavelengths: excitation, 485 nm; emission, 535 nm) was measured using a multi-detection microplate reader (Sense; HIDEX, Turku, Finland).
Measurement of Intracellular GSH ContentFor the GSH assay, cells were collected with 5% sulfosalicylic acid and homogenized with an ultrasonic homogenizer (VCX 130, Sonics, Newtown, CT, U.S.A.). The GSH levels were measured using the 5,5′-dithiobis(2-nitrobenzoic acid)-oxidized glutathione reductase recycling assay, as described previously.35)
Caspase 3/7 ActivityTo determine the degree of induction of apoptosis, the activities of caspase 3 and 7, which are last-stage apoptosis-related markers, were measured using the Caspase-Glo® 3/7 Assay kit (G8090; Promega, Mannheim, Germany), according to the manufacturer’s instructions and as described by.36) The HK-2 and HepG2 cells were seeded in 96-well plates at a density of 2 × 10⁴ cells/well. The following steps were performed according to the protocol recommended by the kit. Luminescence was measured using the multi-detection microplate reader (Sense; HIDEX).
Total RNA Isolation and cDNA SynthesisThe HK-2 cells and HepG2 cells were seeded in a 6-well plate at a density of 1 × 10⁶ cells/well. After incubation for 24 h, OTA and AA were added individually or in combination for 48 h, and RNA was isolated using RNAiso Plus (TaKaRa, Kusatsu, Japan). The RNA quantity was measured using NanoDrop™2000 (Thermo Scientific, IL, U.S.A.). cDNA was synthesized using a first-strand cDNA synthesis kit (LeGene Biosciences, San Diego, CA, U.S.A.), according to the manufacturer’s instructions.
Quantitative Real-Time PCRQuantitative real-time PCR (qPCR) was performed using 0.5 µL of cDNA, 9.5 µL of primer cocktail, and 10 µL of SYBR Green in a total reaction volume of 20 µL on a BioRad iQ5 thermal cycler, according to the manufacturer’s instructions (iQ SYBR Green Supermix. Bio-Rad, Hercules, CA, U.S.A.). The primers used for qPCR were designed on the basis of published cDNA sequences (Supplementary material). The comparative CT method was used for relative quantification and normalized using a housekeeping gene, GAPDH, and expressed in terms of 2−△△CT values.
Isolation of Total Cell Lysates and Western Blot AnalysisAfter treatment with OTA and AA individually or in combination, the total cell lysate was collected as reported previously.37) Sodium dodecyl sulfate-polyacrylamide gel electrophoresis (SDS-PAGE) was performed with the same amount of protein (32 µg) and transferred to polyvinylidene membranes (Millipore, Billerica, MA, U.S.A.). Immunoblotting was performed using monoclonal or polyclonal antibodies against CYP1A1, CYP1A2, Bax, and caspase 3. The protein bands were detected using SuperSignal™ West Femto and ECL solution and quantified using Image J software (National Institutes of Health, MD, U.S.A.).
Data and Statistical AnalysesThe dose–effect relationship analysis for individual chemical cytotoxicities, their 95% confidence intervals and combination indexes (CIs), dose reduction index calculation, and fa-CI plots for combined effects were performed using Compusyn software version 1.0 (ComboSyn Inc., Paramus, NJ, U.S.A.). This software calculates IC50 by using the median-effect equation of the mass-action law described by Chou and Talalay and considering the shape of the dose–response curve, either when m = 1, hyperbolic; m > 1, sigmoidal; or m < 1, flat sigmoidal.34) All statistical analyses were performed using SAS version 9.4 (SAS Institute, Cary, NC, U.S.A.). All results are expressed as mean ± standard deviation (S.D.) values. Three repeated experiments were performed for each experiment (n = 3). Different letters mean significant differences at p < 0.05 according to ANOVA followed by Tukey’s multiple range tests.
To evaluate the interaction between OTA and AA in the cells, cell viability was measured using the MTT assay at various concentrations for OTA (HK-2 cell 0–800 nM, HepG2 cell 0–500 nM), AA (HK-2 cell 0–8 mM, HepG2 cell 0–5 mM), and combination of OTA and AA (Fig. 1). The interaction between OTA and AA was assessed by running the cell viability values obtained from the MTT assay on the Compusyn software program. The types of interaction were determined by creating a combination index plot (Fa-CI plot) and calculating CI values (Fig. 2, Table 1). The Fa-CI plot is a plot that shows the type of interaction by indicating the combined index value for the fraction affected by a certain amount of toxic substances in cells. In the Fa-CI plot shown in Fig. 2, where the y-axis means CI, the CI value of the reference line is 1, CI = 1 means additive effect, CI <1 means synergism, and CI >1 means antagonism. The CI values for the OTA/AA combination and three different cytotoxicity levels (25, 50, and 75%) are presented in Table 1. In Fig. 2 and Table 1, the CI value is less than 1 at all concentration points in the kidney cell HK-2, which is the main target of OTA, and CI value is in the range of 0.3–0.7 at IC25, IC50, and IC75. According to the Chou and Talalay method, the interaction of OTA and AA has a toxic effect of common synergism in the kidney cells. In contrast, the HepG2 cells showed common antagonism at IC25, slight synergism at IC50, and common synergism at IC75. Thus, when OTA and AA are present together at low concentrations, the toxic effect on the liver is not high; however, the synergy effect is observed when both are present together at a high concentration. On the basis of these results, the OTA and AA concentrations had synergistic effects on HK-2 and HepG2 cells were used for investigating the mechanism underlying the cytotoxicity caused by OTA and AA.

In each experiment, the HK-2 cells were treated with 0–800 nM OTA and 0–8 mM AA individually or in combination and HepG2 cells with 0–500 nM OTA and 0–5 mM AA individually or in combination for 48 h. Then, the cell viability was determined using the MTT assay. The data are expressed as mean ± S.D. values of three independent experiments.
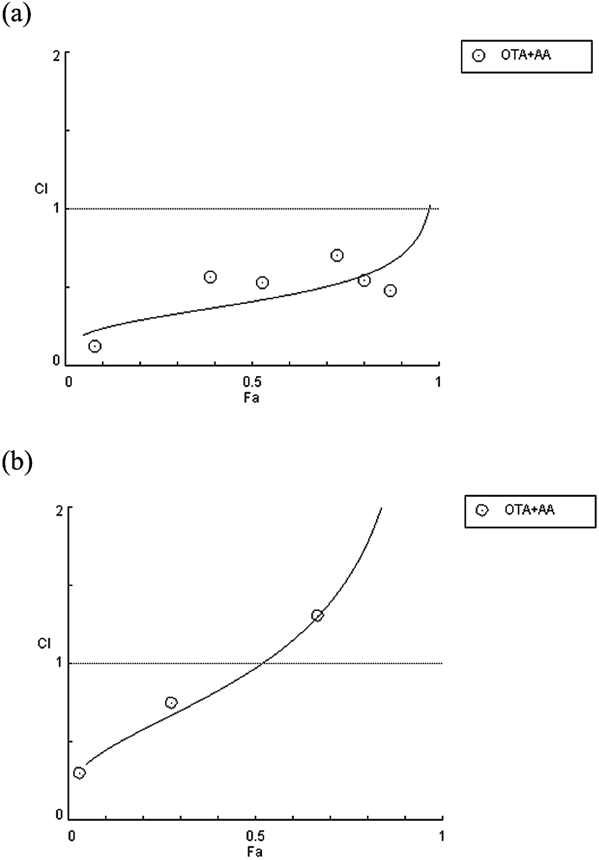
The combination index (CI) values are plotted as a function of the fraction affected (Fa) by using the Compusyn software. CI <1, CI = 1, and CI >1 indicate synergistic, additive, and antagonistic effects, respectively.
 |
The computer software Compusyn was used for calculating the parameters for Dm, m, r, and CI. The parameters of Dm, m, and r are the antilog of the x-intercept, slope, and linear correlation coefficient of the median-effect plot, respectively. The Dm and m values were used to calculate the CI values. IC25, IC50, and IC75 are the concentrations required for 25, 50, and 75% inhibition, respectively.
To determine the oxidative stress caused by treatment with OTA and AA, intracellular ROS production and reduced GSH content were measured in both kidney and liver cells. The treatment with OTA (HK-2 cell 100 nM, HepG2 cell 125 nM) and AA (HK-2 cell 1 mM, HepG2 cell 1.25 mM) individually significantly increased ROS production when compared with the control, and the OTA and AA combined treatment (HK-2 cell OTA 100 nM + AA 1 mM, HepG2 cell OTA 125 nM + AA 1 mM) further increased ROS production (Figs. 3a, b). GSH, an endogenous antioxidant in the body, is oxidized to GSSG, and its level decreases when oxidative stress occurs. In the HK-2 cells, the synergistic effect was confirmed because the GSH content of the combined treatment group (HK-2 cell OTA 100 nM + AA 1 mM, HepG2 cell OTA 125 nM + AA 1 mM) was significantly lower than those of the OTA (HK-2 cell 100 nM, HepG2 cell 125 nM) and AA (HK-2 cell 1 mM, HepG2 cell 1.25 mM) treatments individually (Fig. 3c). However, no significant differences were found in the GSH content of in the HepG2 cells in the AA (HK-2 cell 1 mM, HepG2 cell 1.25 mM) and combined treatment groups (HK-2 cell OTA 100 nM + AA 1 mM, HepG2 cell OTA 125 nM + AA 1 mM) (Fig. 3d). This result suggests that AA plays a greater role in GSH reduction in hepatocytes than OTA.

In each experiment, the HK-2 cells were treated with 100 nM OTA or 1 mM AA individually or in combination and HepG2 cells, 125 nM OTA (OTA) and 1.25 mM AA (AA) individually or in combination (125 nM OTA + 1.25 mM AA; OTA + AA) for 48 h. The cells in control group (Con) received no treatment. The ROS levels were measured by DCFH-DA staining of the (a) HK-2 and (b) HepG2 cells. Total intracellular glutathione levels in the (c) HK-2 and (d) HepG2 cells were measured. The data are expressed as mean ± S.D. values of three independent experiments. Different letters indicate significant differences at p < 0.05 according to Tukey’s multiple range test.
The mRNA and protein expression of CYP1A1 and CYP1A2, involved in the phase I reaction, was examined to understand the effects of OTA and AA on this reaction in the HK-2 and HepG2 cells (Fig. 4). In the group treated with OTA (HK-2 cell 100 nM, HepG2 cell 125 nM) and AA (HK-2 cell 1 mM, HepG2 cell 1.25 mM), no significant differences were observed in the expression level compared to the control group. However, in the combined group (HK-2 cell OTA 100 nM + AA 1 mM, HepG2 cell OTA 125 nM + AA 1 mM), the level was significantly increased, suggesting that the increased expression of CYP1A1 and CYP1A2 in the combined group (HK-2 cell OTA 100 nM + AA 1 mM, HepG2 cell OTA 125 nM + AA 1 mM) resulted in synergistically toxic effects on both the kidney and hepatocytes (Fig. 4).

In each experiment, the HK-2 cells were treated with 100 nM OTA and 1 mM AA individually or in combination and HepG2 cells, 125 nM OTA and 1.25 mM AA individually or in combination (OTA + AA) for 48 h. The cells in Con received no treatment. The mRNA expression levels of phase I enzymes (CYP1A1 and CYP1A2) were measured in the (a) HK-2 and (b) HepG2 cells. The protein expression levels of the phase I enzymes (CYP1A1 and CYP1A2) in the (c) HK-2 and (d) HepG2 cells were measured using Western blot. The data are expressed as mean ± S.D. values of three independent experiments. Different letters indicate significant differences at p < 0.05 according to Tukey’s multiple range test.
The contribution of the synergistic effect between OTA and AA to apoptosis-related cell death and expression of caspase and Bax apoptosis markers were evaluated (Fig. 5). The activity of caspase 3/7 increased in the HK-2 and HepG2 cells in the combined group (HK-2 cell OTA 100 nM + AA 1 mM, HepG2 cell OTA 125 nM + AA 1 mM) when compared with the control and OTA and AA groups (Figs. 5a, b). The mRNA expression levels of caspase 3, caspase 9 and their upstream regulator, Bax, significantly increased in the combined group (HK-2 cell OTA 100 nM + AA 1 mM, HepG2 cell OTA 125 nM + AA 1 mM) when compared to the control and OTA and AA groups (Figs. 5c, d). Similarly, the protein expression levels of caspase 3, cleaved caspase 3, and Bax further increased after the combined treatment with OTA and AA (HK-2 cell OTA 100 nM + AA 1 mM, HepG2 cell OTA 125 nM + AA 1 mM) (Figs. 5e, f).

In each experiment, the HK-2 cells were treated with 100 nM OTA and 1 mM AA individually or in combination and HepG2 cells, 125 nM OTA and 1.25 mM AA individually or in combination for 48 h. The cells in Con received no treatment. Caspase 3/7 activities were measured in the (a) HK-2 and (b) HepG2 cells, and mRNA expression levels of apoptosis-related markers (Bax, caspase 3, and caspase 9) in the (c) HK-2 and (d) HepG2 cells were measured using quantitative real-time PCR. Protein expression levels of apoptosis-related markers (Bax, caspase 3, and cleaved caspase 3) in the (e) HK-2 and (f) HepG2 cells were measured using Western blot. The data are expressed as mean ± S.D. values of three independent experiments. Different letters indicate significant differences at p < 0.05 according to Tukey’s multiple range test.
OTA, which is a mycotoxin naturally distributed in foods such as grains, coffee, wine, and milk, damages the kidneys, liver, and nerves.38,39) AA is a chemical used in industries and laboratories, and it has toxic effects on nerves, liver, and kidneys.40,41) The AA is produced massively in high carbohydrate-containing foods, such as grains and potatoes, prepared at high temperatures.42) OTA and AA are present in foods commonly encountered in daily life such as cereals, coffee and beer, and OTA and AA enter the human body through the intake of such foods.6,15,33)
To the best of our knowledge, toxicity studies on treatment with OTA and AA individually have been reported, whereas studies on their combined toxic effects have not been reported. Generally, OTA has toxic effects at 100 to 800 µM,43,44) and AA, at 2 to 10 mM.45,46) Therefore, the nephrotoxicity and hepatotoxicity of OTA and AA individually at very low concentrations are not cause for concern; however, a combination of OTA and AA at low concentrations may cause synergistic toxicity in the kidney and liver, which are target organs. In this study, the CI–isobologram method was used to evaluate the combined toxic effect of OTA and AA. The CI–isobologram method was developed by Chou and Talalay,47,48) and it allows the prediction of joint action at all levels of influence (fa) on combinations of components and is widely used to study drug interactions, including synergistic or antagonistic actions. This method has been used to study the interactions of environmental pollutants.48–50) In our study, the interaction between OTA and AA in the HK-2 and HepG2 cells resulted in synergistic toxicity in the kidney cells at 25–800 nM OTA and 0.25–8 mM AA and in the liver cells at higher than 125 nM OTA and 1.25 mM AA.
These synergistic toxic effects of OTA and AA led us to consider the process of metabolism when these two substances entered the body. When xenobiotics are introduced into the body, the liver and kidneys metabolize the compounds using phase I enzymes, such as CYP enzymes.51–53) Through the oxidation process, these CYP enzymes metabolize xenobiotic chemicals where more toxic metabolites and oxidative stress can be generated.51,52,54) The compounds metabolized by the CYP enzymes are converted into polar inclusion compounds by enzymes involved in the phase II reaction and released outside the body.55) However, some compounds, including aflatoxin, are activated by the phase I reaction and become more toxic.56) The metabolization of OTA and AA by CYP enzymes generates ROS.25,27) ROS-induced oxidative stress is an important factor that induces programmed cell death, such as apoptosis.57) ROS generation significantly increased in the combined treatment group. In addition, the GSH content was significantly reduced in the kidney cells of the combined treatment group, although no significant differences were observed between the liver cells of the AA treatment and combined treatment groups. These results suggest that the phase I reaction followed by ROS-induced oxidative stress can contribute to the synergistic toxicity of both OTA and AA.
In the present study, few significant differences in the levels of both CYP1A1 and CYP1A2, which play an important role in the metabolism of OTA,25) were observed in the cells after treatment with OTA or AA individually, but a significant increase was observed after the combined treatment. The overexpression of AhR mRNA and its target CYP1A1 and CYP1A2 mRNA in OTA-treated primary human hepatocytes was observed.58) Additionally, Sen et al.24) reported that CYP1A2 protein level and mRNA levels as well as its associated enzyme activity in HepG2 cells increased following 1.5 mM AA treatment. To date, there are no studies on the induction of aryl hydrocarbon receptor (AhR) mRNA expression as well as its target cytochrome CYP 1A1/1A2 mRNA with the AA treatment. Since AhR, a cytosol-based transcription factor, regulates the expression of the CYP1 family gene,59) it is conceivable that treatment with AA may increase the expression of AhR. Pushparajah and Ioannides59) reported that benzo[a]pyrene (B(a)P), a well-known AhR-mediated polycyclic aromatic hydrocarbons (PAHs) modulated synergistically and antagonistically CYPA1 activity by the presence of other PAHs in rat liver slices. They proposed that a PAH, which causes synergistic binding of B(a)P to the AhR receptor would effectively contribute to an increase in levels of AhR-battery controlled genes such as CYP1A, leading to higher protein expression of the target genes and enzyme activity. Whether the synergistic interaction between OTA and AA occurs during the liganding of both to the AhR remains of interest to investigate.
The production of excess oxidative stress causes apoptosis in cells, DNA damage, and mitochondrial dysfunction.60,61) Apoptosis occurs under various pathological conditions that can be induced by toxic chemicals, and it is a process characterized by cell shrinkage and DNA fragmentation.28,62) These features are caused by the activity of proteases, called caspases.63,64) In addition, destruction of mitochondrial structures can activate apoptosis through changes in genes such as Bax and caspase 9.65,66) Thus, to ensure that the synergy between OTA and AA is related to apoptosis, an experiment was conducted to confirm caspase activity and the expression of apoptosis-related factors. Caspase 3/7 activities increased in the combined treatment group when compared with the OTA or AA treatment groups, and protein and mRNA expression of apoptosis-related factors Bax and caspase 3 was significantly increased.
In conclusion, the results of present study suggest that combined treatment of OTA and AA increased the expression of CYP enzymes due to the synergistic effects compared with a single treatment of OTA and AA. The expression of enzymes further amplifies the production of oxidative stress in xenobiotic metabolism, resulting in apoptosis and further damage to kidney and liver cells. However, combined treatment at the concentrations of OTA and AA (HK-2 cell OTA 100 nM + AA 1 mM, HepG2 cell OTA 125 nM + AA 1 mM) at which the increased expression of CYP1A1/1A2 did not significantly promote cell death. Based on these results, the expression changes of the CYP1A enzymes and apoptosis-related molecules may not directly affect cell death. Alternatively, this can contribute to inflammatory response or epithelial–mesenchymal transition through activation of the CYP enzymes to induce death.67,68) Therefore, further study on the molecular mechanisms of CYP1A1, 1A2, and apoptosis-related molecules for cell death seems to be needed. And the in vivo synergistic nephrotoxicity and hepatotoxicity of the two toxins also needs further investigation. These results suggest the possibilities of toxic reactions by the interaction between toxic substances present in food and toxic substances generated during processing.
This research was supported by the International Joint R&D Program (Q1624243) of the Agency for Korean National Food Cluster, Korea University Grant (K1910641), and School of Life Sciences & Biotechnology of Korea University for BK21PLUS. The authors thank the Institute of Biomedical Science & Food Safety, CJ-Korea University Food Safety Hall (Seoul, Republic of Korea), for providing the equipment and facilities.
The authors declare no conflict of interest.
The online version of this article contains supplementary materials.