Abstract
The purpose of this study was to clarify the variability of serum concentrations of caffeine (CAF) in preterm infants, and to deliberate on a better explanation for developmental changes of systemic clearance during the neonatal period. Forty-nine serum samples were obtained from 23 preterm neonates (age, 34.1 ± 18.8 d), and additive blood sampling was conducted periodically for 10 of the 23 patients after discontinuation of CAF treatment. The concentrations of CAF and its major metabolites were determined by liquid chromatography-tandem mass spectrometory. The serum concentrations of CAF were within therapeutic levels (5–25 µg/mL) in 37 samples and exceeded 25 µg/mL in the rest of the 12 samples, although no sample was in the toxic range (> 50 µg/mL). The inter- and intra-individual variability of the concentration to dose (C/D) ratio corrected for body surface area (BSA) was more negatively associated with postmenstrual age (PMA) rather than postnatal age (PNA). The serum concentrations of major metabolites were much smaller than those of CAF throughout the study, suggesting that the contribution of hepatic metabolism to drug elimination was small in the preterm infants under 241 d of PMA. The mean values for elimination half-life and oral clearance estimated in the 10 patients were 124.6 ± 44.6 h and 2.26 ± 0.73 mL/min/1.73 m2, respectively. Consequently, we confirmed that the exposure to CAF was considerably variable and provided additive insight that the C/D ratio corrected for patient’s BSA and PMA are promising for describing and understanding the developmental change of clearance in preterm infants.
INTRODUCTION
Caffeine (CAF) is a methylxanthine that is safe to use as a treatment for apnea of prematurity and it is one of the most prescribed drugs in the neonatal intensive care units (NICU).1–3) However, a more recent cohort study including 109 preterm infants revealed that CAF therapy was a risk factor for osteopenia.4) The cumulative dose and duration of CAF therapy were associated with osteopenia of prematurity as well as steroids, leading the author to conclude that a sparing dose of CAF to treat apnea of prematurity should be determined.4) In addition, we previously reported CAF-induced rhabdomyolysis in a preterm female neonate born at 28 weeks of gestation.5) Her serum creatinine kinase levels increased from 83 units/L on day 6 to 659 units/L on day 17; urine myoglobin concentration on day 18 was 81.1 ng/mL; and serum concentration of CAF was 32.59 µg/mL which exceeded therapeutic levels (5–25 µg/mL).1,5) These reports suggest that it is necessary to clarify the pharmacokinetic variability of CAF in routinely treated preterm infants.
In adults, CAF is mainly metabolized to paraxanthine (PX), theophylline (TP) and theobromine (TB) in the liver by CYP 1A2, and only less than 2% of a dose is eliminated unchanged in urine.6) In contrast to adults, CAF is largely excreted in urine unchanged in both preterm and full-term newborns because of the absence of hepatic expressions of CYP1A2.7,8) Although the elimination of CAF is exceedingly slow in infants, the elimination half-life of CAF gradually decreases as CAF treatment is prolonged.7,8) Koch et al.9) recently simulated dosing strategies to ensure stable CAF concentrations in preterm neonates despite changing of CAF clearance during the first 8 weeks of life. The simulation results showed a shortened elimination half-life (t1/2) of CAF at postnatal age (PNA) = 28 d (86 h) compared with that at PNA = 7 d (112 h), and they proposed that the maintenance dose of CAF citrate needs to be increased by 1 mg/kg every 1–2 weeks.9) The point we should note is that their simulations were performed for only a typical preterm male neonate with a birth weight of 1150 g and gestational age of 28 weeks receiving CAF treatment immediately after birth (PNA of 0). In general, the category of preterm infants is not a homogeneous group of patients, and PNA and/or body weight are often used for describing developmental change during childhood. However, especially in premature and low birth weight infants, the t1/2 value of CAF may be dependent on some index of early development such as gestational age.10) Therefore, for a better understanding of the shortened half-life of CAF, especially during the neonatal period, we proposed that postmenstrual age (PMA), which is gestational age plus PNA, should be taken into consideration.
The primary purpose of the present study was to clarify variability of the serum concentrations of CAF and three of its major metabolites in preterm newborn infants. We also aimed to assess the impact of both PMA and PNA on the inter- and intraindividual variability of CAF pharmacokinetics.
MATERIALS AND METHODS
MaterialsCAF and TP were purchased from FUIJIFILM Wako Pure Chemical Corporation (Osaka, Japan). CAF-d9 and phenacetine were purchased from Nacalai Tesque (Kyoto, Japan). PX was purchased from Sigma-Aldrich (St. Louis, MI, U.S.A.). TB was purchased from Tokyo Chemical Industries (Tokyo, Japan).
Patients and Blood SamplingPreterm infants born and admitted to the NICU of Toyama university hospital were eligible for this study if they were having apnea of prematurity and met indications for CAF treatment, but cases with severe congenital abnormality and significant liver impairment (serum alanine aminotransferase (ALT) greater than 3 times the upper limit of the normal range) were excluded from the study. Apnea of prematurity was defined as cessation of breathing that lasts for more than 20 s and is accompanied by hypoxia or bradycardia without any other apparent cause of apnea. The patients were routinely treated with CAF, and dose of the drug was based solely on clinical grounds. The usual practice in our NICU is to give a 10 mg/kg loading dose of CAF base (20 mg/kg of CAF citrate) intravenously, followed by a maintenance dose of 2.5 to 5 mg/kg/d (5–10 mg/kg/d of CAF citrate) administered either intravenously or orally. To minimize burden of blood sampling, testing in this study was done using residual serum samples (from the day 7 of CAF therapy), used after biochemical tests including ALT, aspartate aminotransferase (AST), cystatin C (Cys-C) and creatinine levels. Thus, although the time between administration and taking blood is not constant in each measurement, the serum concentration of CAF could be relatively stable throughout the day due to its long half-life in neonates. Finally, additional periodic blood sampling for the pharmacokinetic analysis was performed if the dose or schedule parameters had been unchanged for more than 2 weeks at the discontinuation of CAF treatment. The parents gave written informed consent to participate in the present study, which was approved by the ethics committee of the University of Toyama (#RIN28-168). This study was conducted from July 2016 to July 2017.
Assay of Caffeine and MethylxanthinesSerum concentrations of CAF, PX, TP and TB were determined by using a Thermo Fisher Accela LC system (Thermo Fisher Scientific, Yokohama, Japan) coupled to an LTQ-Orbitrap XL ETS system (Thermo Fisher Scientific). Sample preparation was performed by solid-phase extraction with an Oasis® HLB cartridge (Waters, Milford, MA, U.S.A.) as reported by Kuwayama et al.11) with minor modifications. Fifty-five microliters of serum samples were mixed with 990 µL of distilled water and 55 µL of CAF-d9 (0.05 µg/mL), then loaded onto an Oasis® HLB cartridge. Then, analytes were eluted with 2.5 mL acetonitrile and evaporated to dryness at 45 °C with a SpeedVac® system (Savant, Farmingdale, NY, U.S.A.). The dried analytes were reconstituted with 200 µL of mobile phase containing CAF-d9 and phenacetin as internal standards. The 15 µL of sample was injected into an Inertsil® HPLC Column (4.6 × 150 mm i.d.; Ph-35 µm particle size; GL Sciences, Tokyo, Japan). The mobile phase was 0.1% formic acid and methanol with 2% of tetrahydrofuran (30 : 70 (v/v)). The flow rate was 800 µL/min and the total run time was 5.5 min with a column temperature of 40 °C. CAF, PX, TP, and TB were detected by MS/MS with an electrospray ionization (ESI). The positive selected reaction monitoring (SRM) was based on the transition of m/z 195.2 > 138.2 for CAF, 181.1 > 124.2 for PX and TP, 181.1 > 163.17 for TB, 204.2 > 144.1 for CAF-d9, and 180.2 > 110.1 for phenacetin.11,12) The peak areas were calculated using Qualbrowser® software (Thermo Fisher Scientific). Since the assay was linear between 0 and 40 µg/mL, samples were diluted appropriately to keep the drug concentration within the range.
Pharmacokinetic AnalysisThe concentration to dose (C/D) ratio of CAF was calculated in two ways; the first is by simply dividing the values of the CAF concentrations by the daily dose per body weight, and the second is by dividing the values of the CAF concentrations by daily dose per body surface area (BSA, in 1.73 m2) as follows:
where DD is maintenance daily dose (mg), BW is body weight (kg). BSA was calculated based on the Dubois formula13):
where HT is height measurements (cm), respectively.
In the present study, the apparent clearance (CL/F, where F is bioavailability) was expressed in mL/min per 1.73 m2 of BSA. The CL/F value of CAF in individual patients was numerically approximated by the following equation:
where τ is the dosing interval (h), and Css is the serum CAF concentration (µg/mL) assuming steady state distribution just before the final administration of the drug.
The elimination rate constant (kel) in individual was calculated from the mean slope angle of the concentration–time profile after last dose of CAF. The t1/2 was calculated using 0.693/kel.
Calculation of Estimated Glomerular Filtration Rate (eGFR)Because serum Cys-C level mirrors maturation of the kidney better than other markers such as serum creatinine,14,15) the eGFR value was calculated using the formula reported by Uemura et al.15):
To evaluate renal function in infants, we compared the eGFR value with the reference value of age-appropriate standards.14) Serum Cys-C was analyzed by BML Inc. (Toyama, Japan).
Statistical AnalysisThe regression analysis was performed with the Analysis Toolpak in Microsoft Excel 2008, whilst checking the p-value of the regression analysis to ensure it was valid. A value of p < 0.01 was considered to be significant. Data are expressed as the mean ± standard deviation (S.D.).
RESULTS
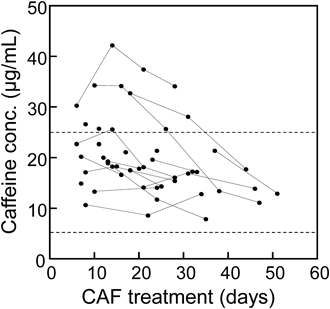
In the present study, 49 serum samples were obtained from 23 preterm neonates (age 34.1 ± 18.8 d). No patient had clinically significant kidney or liver impairment throughout the study. As shown in Fig. 1, inter- and intraindividual variability of CAF exposure was relatively large and was biased towards higher levels as compared to its therapeutic range (5–25 µg/mL). That is, the observed serum CAF concentrations were within therapeutic levels in 37 samples and exceeded 25 µg/mL in the remaining 12 samples, although no sample was in the toxic range (> 50 µg/mL). Although the standard maintenance dose of CAF citrate is 5 mg/kg, it was adjusted slightly based solely on clinical and physiologic grounds in some patients.
To visualize the developmental change of the CAF clearance, we evaluated the relationship between the C/D ratio of the drug and patients’ age in the 23 neonates (Fig. 2). The C/D ratiobw which daily dose was corrected by body weight showed a modest negative correlation with both PMA or PNA (Figs. 2A, B). On the other hand, the C/D ratiobsa which daily dose was corrected by BSA (per 1.73 m2) substantially decreased with increasing PMA (Fig. 2C), while that with PNA showed comparable variance but less systematic changes (Fig. 2D). The correlation coefficient values between the C/D ratio and patients’ age in Fig. 2C was 0.582 which is the best we examined. The p-values of the regression analysis for Figs. 2C and D were 0.000, 0.005, respectively which were significant at 1 percent level of significance (Fig. 2).
Figure 3 shows the molar fraction of CAF and its metabolites in the serum sample. The fraction was indicated as the sum of xanthines in molar concentrations and ordered by corresponding PMA. If systemic clearance by the hepatic CYP1A2 activity was gradually increased during the study, the fraction of CAF metabolites were also likely to be increased; however, the serum concentrations of the three major metabolites (TB, PX, and TP) were much smaller than those of CAF and were about the same throughout the period investigated.
The elimination of CAF after final administration were shown in Fig. 4. Consequently, the additional blood sampling was available for 10 out of the 23 patients (Fig. 4). The characteristics of the 10 preterm infants at the last CAF dose and pharmacokinetic parameters were summarized in Table 1. Gestational age and PNA were 190.9 ± 23.6 and 40.5 ± 21.5 d, respectively. The mean body weight and BSA were 1190 ± 493 g and 0.101 ± 0.014 m2, respectively. The mean eGFR value was 59.7 ± 3.9 mL/min/1.73 m2, which were age-appropriate and none of them had renal impairment. The mean values for CL/F and t1/2 calculated were 2.26 ± 0.73 mL/min/1.73 m2 and 124.6 ± 44.6 h, respectively (Table 1).
Table 1. Characteristics and Pharmacokinetic Properties of the 10 Patients Included in the Pharmacokinetic Analysis
| Patient | Gestational age (days) | Postnatal age (days) | Body weight (g) | BSA (m2) | eGFR (mL/min/1.73 m2) | CL/F (mL/min/1.73 m2) | t1/2 (h) |
|---|
| #1 | 160 | 46 | 865 | 0.105 | ND* | 1.54 | 159.1 |
| #2 | 224 | 14 | 1955 | 0.126 | 64.0 | 1.92 | 114.0 |
| #3 | 190 | 57 | 1575 | 0.108 | 64.0 | 3.47 | 77.7 |
| #4 | 165 | 70 | 1398 | 0.098 | 63.0 | 3.55 | 96.3 |
| #5 | 197 | 25 | 1252 | 0.115 | 53.8 | 2.57 | 111.2 |
| #6 | 162 | 67 | 1094 | 0.090 | 57.7 | 1.91 | 141.7 |
| #7 | 182 | 57 | 1147 | 0.087 | 55.3 | 2.27 | 128.0 |
| #8 | 223 | 13 | 1019 | 0.076 | 61.6 | 1.50 | 230.5 |
| #9 | 203 | 28 | 1451 | 0.106 | 56.5 | 2.13 | 96.7 |
| #10 | 203 | 28 | 1335 | 0.100 | 61.6 | 1.77 | 91.0 |
| Mean ± S.D. | 190.9 ± 23.6 | 40.5 ± 21.5 | 1190 ± 493 | 0.101 ± 0.014 | 59.7 ± 3.9 | 2.26 ± 0.73 | 124.6 ± 44.6 |
The individual data at the day of discontinuation of CAF treatment (day 0) were summarized. No patient had clinically significant kidney or liver impairment. *ND: not determined BSA: body surface area; eGFR: estimated glomerular filtration rate; CL/F: apparent clearance; t1/2: elimination half-life.
DISCUSSION
The purpose of the present study was to clarify the variability of serum concentrations of CAF in preterm infants, and to deliberate on a better explanation for the developmental change of systemic clearance during the neonatal period. Consequently, we confirmed that the exposure to CAF was considerably variable in clinical settings (Fig. 1) and found that CAF concentrations divided by daily dose per BSA were fairly correlated with PMA of patient (Fig. 2). Furthermore, the serum concentrations of the three major metabolites (TB, PX, and TP) were much smaller than those of CAF throughout the period investigated (Fig. 3). In conjunction with that orally administered CAF is almost completely absorbed from the gastrointestinal tract, it was speculated that the contribution of hepatic metabolism to the drug elimination remains small in preterm infants until at least 241 d of PMA (Fig. 3). Therefore, inter- and intraindividual variability of the CAF exposure in preterm infants was likely because the renal function was gradually developed during therapy. Taken together, PMA is promising in describing and understanding the developmental change of CAF clearance.
Recently, there are two studies documenting the effect of PMA on the pharmacokinetics of CAF in premature infants with apnea of prematurity.10,16) Dobson et al.16) demonstrated the population pharmacokinetic analysis based on a three-compartment recirculation model using NONMEM. In their analysis, however, current body weight, birth weight, gestational age, PMA and PNA were not significantly correlated with any PK parameter. As a basis for disagreement with our results, Dobson et al.16) recruited 29 preterm infants with PMA ranged from 231 to 258 d, suggesting that the age ranges over which they analyzed were too narrow to detect any significant developmental changes of the CAF clearance. On the other hand, Gao et al.10) reported the CAF dosing regimen for the Chinese population using modelling and simulation approach. Pharmacokinetic samples were collected from 99 Chinese newborns with PMA ranged from 185 to 266 d (224 ± 15 d). They demonstrated that body weight-implemented allometric scaling (size), PMA and serum creatinine concentration (renal function) markedly affected CAF clearance,10) which are substantially in accordance with our present results. However, it should be noted that Johnson et al.17) revealed that accuracy of the physiologically based model incorporated BSA was superior to that of simple allometry, especially in children < 2 years old. They also proposed that GFR can be approximated by equation incorporated with BSA.17) This may explain that the correlation between the C/D ratio and PMA was greatly improved by incorporation of patients’ BSA but not by body weight (Figs. 2A, C). In this regard, the present analysis provides additional information suggesting that BSA can be used to describe the CAF clearance in preterm infants. Further study will be warranted to improve the simulation performance in the future.
Aldridge et al.7) examined urine samples from infants during treatment with CAF and found that the amount of CAF excreted in urine was about 62% and 54% at the age of 1–2 months and 2–3 months, respectively, which was considerably higher than that of 3–4 months (23%).7) The change could reflect increasing metabolite production, but the contribution of CYP1A2 to the systemic clearance of CAF may be open to discussion and dispute especially in the early neonatal period because most newborns treated with CAF are born premature (gestation < 37 completed weeks). Another fact we should note is that very preterm neonates have a slower increase in glomerular filtration rate (GFR) during their first weeks of life than full term neonates.18) In addition, several studies have demonstrated that PMA is useful to describe renal maturation than PNA.19–22) For example, Rhodin et al.19) reported that PMA rather than PNA was a better descriptor of maturational changes in GFR in premature neonates. They mentioned that the use of PNA as a descriptor of maturation was unsatisfactory because of the large variability in weight and gestation possible at birth.19) These results may partly support our results that PMA is effective means for describing and understanding developmental change in preterm infants.
Finally, the question we need to mention is whether the systemic clearance of CAF can be described with formula incorporated with eGFR because the CAF clearance is largely dependent on renal elimination during the neonatal period. As shown in Table 1, however, the CL/F values of CAF were much smaller than the individual eGFR values. In conjunction with the fact that the plasma protein binding of CAF in newborn infants is only 31% in average,23) it is suggested that reabsorption of the drug in tubular segments is extensive and tubular reabsorption capacity is the key mechanism responsible for the interindividual variability of the drug disposition in preterm infants. Moreover, the eGFR values of the 10 neonates are in the narrow ranges from 53.8 to 64.0 mL/min/1.73 m2, which cannot fully explain the 2.37-fold variability of the CL/F values (Table 1). Not surprisingly, therefore, there is no correlation between the CL/F values and eGFR values in the present study (data not shown).
In conclusion, the exposure to CAF was considerably variable in preterm infants because the systemic clearance of the drug gradually increased during therapy. We propose that the C/D ratio corrected for patient’s BSA and PMA are promising for describing and understanding this developmental change in preterm newborn infants. The present work provides supportive insight not only into the clinical management of CAF therapy but also a general interpretation for ontogenetic growth and its effect on neonatal pharmacokinetics.
Acknowledgments
This work was supported in part by the Japanese Society for the Promotion of Sciences (JSPS KAKENHI Grant No. 18K06780).
Conflict of Interest
The authors declare no conflict of interest.
REFERENCES
- 1) Moschino L, Zivanovic S, Hartley C, Trevisanuto D, Baraldi E, Roehr CC. Caffeine in preterm infants: where are we in 2020? ERJ Open Res., 6, 00330-2019 (2020).
- 2) Aranda JV, Gorman W, Bergsteinsson H, Gunn T. Efficacy of caffeine in treatment of apnea in the low-birth-weight infant. J. Pediatr., 90, 467–472 (1977).
- 3) Skouroliakou M, Bacopoulou F, Markantonis SL. Caffeine versus theophylline for apnea of prematurity: a randomised controlled trial. J. Paediatr. Child Health, 45, 587–592 (2009).
- 4) Ali E, Rockman-Greenberg C, Moffatt M, Narvey M, Reed M, Jiang D. Caffeine is a risk factor for osteopenia of prematurity in preterm infants: a cohort study. BMC Pediatr., 18, 9 (2018).
- 5) Nakaoka S, Kawasaki Y, Inomata S, Makimoto M, Yoshida T. Caffeine toxicity in a preterm neonate. Pediatr. Neonatol., 58, 380–381 (2017).
- 6) Tang-Liu DD, Williams RL, Riegelman S. Disposition of caffeine and its metabolites in man. J. Pharmacol. Exp. Ther., 224, 180–185 (1983).
- 7) Aldridge A, Aranda JV, Neims AH. Caffeine metabolism in the newborn. Clin. Pharmacol. Ther., 25, 447–453 (1979).
- 8) Aranda JV, Collinge JM, Zinman R, Watters G. Maturation of caffeine elimination in infancy. Arch. Dis. Child., 54, 946–949 (1979).
- 9) Koch G, Datta AN, Jost K, Schulzke SM, van den Anker J, Pfister M. Caffeine citrate dosing adjustments to assure stable caffeine concentrations in preterm neonates. J. Pediatr., 191, 50–56.e1 (2017).
- 10) Gao XB, Zheng Y, Yang F, Wang CH, Jiang ZH, Wu YE, Jacqz-Aigrain E, Ni SQ, Zhao W. Developmental population pharmacokinetics of caffeine in Chinese premature infants with apnoea of prematurity: a post-marketing study to support paediatric labelling in China. Br. J. Clin. Pharmacol., 2020, 1–10 (2020).
- 11) Kuwayama K, Tsujikawa K, Miyaguchi H, Kanamori T, Iwata YT, Inoue H. Time-course measurements of caffeine and its metabolites extracted from fingertips after coffee intake: a preliminary study for the detection of drugs from fingerprints. Anal. Bioanal. Chem., 405, 3945–3952 (2013).
- 12) Babu AR, Thippeswamy B, Vinod AB, Ramakishore EG, Anand S, Senthil D. Determination of theophylline in rabbit plasma by triple quadrupole LC/MS. Pharm. Methods, 2, 211–217 (2011).
- 13) Dubois D, Dubois EF. A formula to estimate the approximate surface area if height and weight be known. Nutrition, 5, 303–311, discussion, 312–313 (1989).
- 14) Nakashima T, Inoue H, Fujiyoshi J, Matsumoto N. Longitudinal analysis of serum cystatin C for estimating the glomerular filtration rate in preterm infants. Pediatr. Nephrol., 31, 983–989 (2016).
- 15) Uemura O, Nagai T, Ishikura K, Ito S, Hataya H, Gotoh Y, Fujita N, Akioka Y, Kaneko T, Honda M. Cystatin C-based equation for estimating glomerular filtration rate in Japanese children and adolescents. Clin. Exp. Nephrol., 18, 718–725 (2014).
- 16) Dobson NR, Liu X, Rhein LM, Darnall RA, Corwin MJ, McEntire BL, Ward RM, James LP, Sherwin CM, Heeren TC, Hunt CE. Salivary caffeine concentrations are comparable to plasma concentrations in preterm infants receiving extended caffeine therapy. Br. J. Clin. Pharmacol., 82, 754–761 (2016).
- 17) Johnson TN, Rostami-Hodjegan A, Tucker GT. Prediction of the clearance of eleven drugs and associated variability in neonates, infants and children. Clin. Pharmacokinet., 45, 931–956 (2006).
- 18) Aperia A, Broberger O, Elinder G, Herin P, Zetterström R. Postnatal development of renal function in pre-term and full-term infants. Acta Paediatr. Scand., 70, 183–187 (1981).
- 19) Rhodin MM, Anderson BJ, Peters AM, Coulthard MG, Wilkins B, Cole M, Chatelut E, Grubb A, Veal GJ, Keir MJ, Holford NHG. Human renal function maturation: a quantitative description using weight and postmenstrual age. Pediatr. Nephrol., 24, 67–76 (2009).
- 20) Arant BS Jr. Developmental patterns of renal functional maturation compared in the human neonate. J. Pediatr., 92, 705–712 (1978).
- 21) Coulthard MG. Maturation of glomerular filtration in preterm and mature babies. Early Hum. Dev., 11, 281–292 (1985).
- 22) Mihatsch WA, Muche R, Pohlandt F. The renal phosphate threshold decreases with increasing postmenstrual age in very low birth weight infants. Pediatr. Res., 40, 300–303 (1996).
- 23) de Wildt SN, Kerkvliet KT, Wezenberg MG, Ottink S, Hop WC, Vulto AG, van Den Anker JN. Use of saliva in therapeutic drug monitoring of caffeine in preterm infants. Ther. Drug Monit., 23, 250–254 (2001).