Abstract
Hepatocellular carcinoma (HCC) is the most common malignant liver disease in the world. Existing screening and early diagnosis methods are not highly sensitive for HCC, and patients are likely to develop the disease to the middle and advanced stages before being diagnosed. Therefore, finding new and efficient diagnosis and treatment methods has become an urgent problem. We aimed at finding and verifying new liver cancer markers by combining informatics analysis with experimental exploration to provide new ideas and methods for the diagnosis and treatment of clinical liver cancer. We used two different bioinformatic pipelines to analyze sequencing data of clinical liver cancer samples and identify differentially expressed genes and key variants after combining them with The Cancer Genome Atlas sequencing data. Then, we explored the functions and mechanisms of the key variants to identify potential liver cancer markers. Through bioinformatic analysis of sequencing data, 139 differentially expressed genes were found, including 53 upregulated genes and 86 downregulated genes. Through enrichment and alternative splicing event analysis of sequencing data, we found nine key variants with exon skipping events. Metallothionein 1E (MT1E)-203 was found to be a key variant that influenced cell proliferation through the p53 cell cycle pathway through cell viability and proliferation assays, and MT1E-203 lost the ability to bind two zinc ions due to exon skipping according to the structure prediction of MT1E-203. MT1E-203 is a potential biomarker for HCC and may play an important role in the diagnosis and treatment of HCC.
INTRODUCTION
Hepatocellular carcinoma (HCC) is the most common type of liver cancer and the third most frequent cause of cancer worldwide.1) The patient survival rate of HCC is extremely poor, which is mainly due to the asymptomatic progression of HCC at the early stage and its high metastasis potential at the late stage.2) Conventional chemotherapies have no significant impact on overall survival, and only a small fraction of HCC patients at the early stage are eligible for curative surgical resection.3) Therefore, the discovery of accurate and efficient biomarkers is of great significance for the early diagnosis and treatment of HCC. In recent years, to solve the problems faced by HCC screening, some biomarkers have been discovered, including Alpha-fetoprotein (AFP), Des-gamma-carboxy prothrombin (DCP), Glypican-3 (GPC-3), Insulin-like growth factor-2 (IGF-2), etc. Conventional biomarkers have the disadvantages of low sensitivity and low specificity, which restricts the detection rate of HCC. The discovery of new biomarkers is expected to change the status of early diagnosis and treatment of liver cancer.
In addition, carcinogenesis of hepatocytes is accompanied by mutations in genes and changes in posttranscriptional processing. Alternative splicing (AS), as a posttranscriptional modification mechanism, is widely found in eukaryotes. More than 95% of human multiexonic protein-encoding genes have AS events. Five basic modes of AS are exon skipping, mutually exclusive exons, alternative 5′ donor sites, alternative 3′ acceptor sites, and intron retention. AS is regarded as a major mechanism for increasing the functional complexity and diversity of proteins in the human genome.4) AS of mRNA is closely related to the occurrence and development of many diseases. However, studies of the relationship between AS and HCC are rare.
In addition, the main method used to study AS in the past was RT-PCR technology. However, this technology has low throughput and includes a large amount of noise, which is limits that allow RT-PCR to only be able to characterize known splicing events.5) With the continuous innovation of technology and instruments, second-generation sequencing technology has become a powerful tool for cancer and AS research due to its high throughput and high accuracy. RNA-sequence (seq), which is based on Illumina’s high-output and short-read sequencing platform, enables the detection of the overall transcriptional activity of any species at the single nucleotide level and can accurately recognize AS sites and provide comprehensive transcriptome information.
High-throughput RNA-seq produces a large quantity of reads data that requires proper analysis to enable meaningful integration. A number of analytical tools have been developed to assemble and quantify differential data.6) Currently, a common protocol used for RNA-seq data analysis includes TopHat7) -Cufflinks8) -Cuffdiff, which are free open source software programs developed for the assembly and integration of RNA-seq data, including the identification of new genes and splicing variants.8) HISAT9) -StringTie10) -Ballgown11) is an emerging pipeline that is faster and more memory efficient than TopHat-Cufflinks-Cuffdiff. Furthermore, a number of computational methods for identifying AS events have been developed, such as DEXSeq, rMATs, and MISO.12) rMATs is a new type of AS event analysis method that can handle different types of data with high accuracy.13)
In this study, the calculating method we used combined two different bioinformatic analysis pipelines having the advantages of the each methods. After analyzing the RNA-seq data from the liver cancer tissues and paracancerous tissues, we found differentially expressed genes and transcripts, and combined the analysis results of alternative splicing to find the key variant Metallothionein 1E (MT1E)-203. Afterwards, we verified the results and explore its mechanism of action. These findings will contribute to the discovery of new HCC detection markers and therapeutic targets.
MATERIALS AND METHODS
Data Collection and Identification of Differential Expressed TranscriptsThe RNA-seq data of HCC samples used in this study was obtained from the previous research in our laboratory. The RNA-seq data was from 6 HCC patients in China–Japan Union Hospital of Jilin University, including HCC tissue and adjacent liver tissue, which is in line with the Helsinki Declaration. The other HCC specimen’s data were obtained from TCGA database (https://portal.gdc.cancer.gov/).
Survival Analysis of Differential Expressed GenesThe Kaplan–Meier Plotter online database (http://kmplot.com/) was used to perform the survival analysis of selected differentially expressed genes. Calculate the hazard ratio (HR) with a 90% confidence interval and log rank p-value and display it in the upper right corner of the graph.
Cell CultureThe human hepatocellular carcinoma cell line HepG2, Huh7 and the human liver cell line L02 stocked in this laboratory were used in this study, which were cultured in 1640 medium containing 10% fetal bovine serum at 37 °C under 5% CO2 containing humidified atmosphere.
RT-PCR and Real Time RT-PCRThe mRNA of HepG2 and L02 cells were isolated and reversely transcribed using Trizol method and served as templates for real time PCR using the SYBR Kit. Real time PCR used the Applied Biosystems 7300 system. The experiment was performed in 3 replicates independently. The primer pairs were used to sequentially amplify the chosen transcripts (Supplementary Table S2). Primers were synthesized by GENEWIZ company (https://www.genewiz.com.cn/).
Vector Construction and Over-Expression of TranscriptsIn order to verify the calculation results of the sequencing data, we selected a high expression transcript MT1E-203 to construct over-expression and knockdown vector, and constructed MT1E-203 over-expressing HepG2 cell and MT1E-203 knock-down L02 cell by lipofection. We cloned the cDNA of MT1E-203 and small interfering RNA (siRNA) (Supplementary Table S2) into the pEGFP-N1 plasmid respectively, transfected HepG2 cells and L02 cells with Lipofectamine 2000 transfection reagent, used HepG2 cells and L02 cells transfected into empty vector as a negative control, and screened for stable clones with G418 resistance using G418 eukaryotic screening markers.
3-(4, 5-Dimethylthiazol-2-yl)-2,5-diphenyltetrazolium Bromide (MTT) AssayThree groups of HepG2 cells which were not transfected, transferred into empty vectors, and transferred into the sequence of interest were inoculated into 96-well plates at a density of 6 × 10³/well, and three replicate wells were set for each cell. After culturing for 48 h, we added 5 mg/mL MTT (20 µL/well) to the wells for 4 h, then added 200 µL of dimethyl sulfoxide (DMSO) to the treated cells and detected optical density (OD) at 490 nm using a microplate reader.
Cell Cycle and Apoptosis AnalysisWe use Cell Cycle and Apoptosis Analysis Kit (Beyotime Biotechnology Inc., Shanghai, China). According to the instructions, we first collected untreated, transferred empty vector and transferred into the target gene three groups of cells, washed twice with cold phosphate buffered saline (PBS), fixed with cold 70% ethanol for 12 h. After washing twice with cold PBS, we used ribonuclease (RNase)A, Propidium iodide staining solution and staining buffer to be a staining solution. Then 500 µL of staining solution was added to each tube of cells and incubated at 37 °C for 30 min in the dark. Finally, the sample was determined by flow cytometry.
Bromodeoxyuridine-Enzyme-Linked Immunosorbent Assay (ELISA)By measuring 5-bromo-2-deoxyUridine (BrdU) incorporation, the DNA synthesis in proliferating cells was determined. After transfected with pEGFP-N1 or pEGFP-N1-MT1E-203, HepG2 cells were seeded in 96-well culture plates at a density of 6 × 10³cells/well, cultured for 4 h, then incubated with a final concentration of 10 μM BrdU labeling solution for 24 h according to Cell Proliferation ELISA, BrdU(colorimetric) Kit (Roche Inc., Switzerland). When the incubation period ended, the medium was removed, the cells were fixed for 30 min at FixDenat, washed three times with 1 × washing buffer, incubated with Anti-BrdU-POD working solution for 90 min, then washed three times with 1 × washing buffer again, incubated with substrate solution for 30 min in the dark, then add 25 µL/well 1M/L H2SO4, 1 min on the shaker at 300 rpm. Finally, measure the absorbance of the samples in the ELISA reader at 450 nm.
Colony Formation AssayThe transfected cells (MT1E-203 and Negative control (NC)) were maintained for 5 d at 37 °C. On day 6, the cells were washed using PBS, added 4% paraformaldehyde and fixed 30 min at room temperature. Finally, the colonies were stained with crystal violet and photographed.
Western Blot and Kyoto Encyclopedia of Genes and Genomes (KEGG) Pathway AnalysisWhole cell lysates from cells or homogenized tissues were prepared. The primary antibody was incubated at 4 °C for 12 h, and the secondary antibody was incubated at room temperature for 2 h. Glyceraldehyde-3-phosphate dehydrogenase (GAPDH) was used as controls. Protein action pathways refer to the data in KEGG database. KEGG (Kyoto Encyclopedia of Genes and Genomes) (https://www.kegg.jp/).
AntibodiesAntibodies used in the study are listed as follows: anti-Cyclin A (sc-751, 1 : 1000), anti-Cyclin D (sc-450, 1 : 1000), anti-Cyclin E (sc-198, 1 : 1000) were purchased from Santa Cruz Biotechnology (DE, U.S.A.); anti-CDK4 (66950-1-immunoglobulin (Ig), 1 : 1000), anti-CDK2 (60312-1-Ig, 1 : 1000), anti-P53 (60283-2-Ig, 1 : 1000), anti-P-P53 (28961-1-AP, 1 : 1000), anti-P21 (60214-1-Ig, 1 : 1000), and anti-GAPDH (60004-1-Ig, 1 : 1000) were purchased from Protein-tech Group (Wuhan, China).
Protein Structure PredictionI-TASSER and SWISS-MODEL were used to predict the structure of the protein translated from MT1E-203.14,15) PYMOL software was used to synthesize protein structures and look for metal ion binding sites.
Data AvailabilityThe datasets generated during and analysed during the current study are available in the Gene Expression Omnibus (GEO) repository. https://www.ncbi.nlm.nih.gov/gds GEO ID of sequencing raw data is GSE136846. The Cancer Genome Atlas (TCGA) liver cancer sequencing data was downloaded in https://portal.gdc.cancer.gov/ using SangerBox (http://sangerbox.com/).
Ethics Approval and Consent to ParticipateThe study was done after agreement from the local ethics committee and with the patients’ informed consent and the process was line with declaration of Helsinki. Our institution’s committee on human research gave approval for this study, and all participants gave informed consent. The full name of committee is Ethics Committee of China–Japan Union Hospital of Jilin University.
Statistical AnalysisThe data were processed using one-way ANOVA with SPSS software (SPSS Inc., Chicago, IL, U.S.A.), and all data shown are presented as the mean ± standard error (S.E.) of at least three independent experiments. *** p < 0.001, ** p < 0.01, and * p < 0.05 were considered statistically significant.
RESULTS
Identification of Differentially Expressed Genes in HCCFastQC was used to perform quality checks of fasta files (Supplementary Fig. S1). Based on the fastQC results, we removed low-quality reads and retained high-quality reads for further research. Then, we used the TopHat-Cufflinks-Cuffdiff (TCC) and Hisat-Stringtie-Ballgown (HSB) pipelines to analyze the sequencing data of 6 pairs of liver cancer tissues and paracancerous tissues from patients, used Perl (version 5.10.1) and python (version 2.7.11) to correct and normalize the data, and finally, used R (version 3.4.2) to screen and integrate the results, with the cutoff criteria of an adjusted p < 0.05 and log > 1. High-quality reads were mapped to the Homo sapiens genomes hg19 and GRCh37. After assembly and annotation, we found 547 differentially expressed transcripts through the TCC pipeline and 1396 differential transcripts through the HSB pipeline. A total of 157 differentially expressed transcripts were found through both pipelines (Supplementary Table S1). Then, we compared the results with RNA-seq data downloaded from the TCGA database and identified 139 differentially expressed genes, which contained 53 upregulated genes and 86 downregulated genes (Table 1 and Fig. 1A). Figure 1B shows a flow chart of the bioinformatics analysis in this study, and Fig. 1C shows the expression of 139 genes in the three different data sets, which were used for further screening.
Table 1. A Total of 139 Differential Expressed Genes (DEGs) Were Obtained by Bioinformatic Analysis of RNA-Seq Data
| Gene Name | Gene ID | Fold change (TCC) | Fold change (HSB) | Fold change (TCGA) | Control |
|---|
| SLC6A19 | ENSG00000174358 | −6.67122 | −10.51334 | −13.0619 | 1 |
| GMNN | ENSG00000112312 | 2.23918 | 10.08574 | 3.027 | 1 |
| HMMR | ENSG00000072571 | 3.75434 | 3.20226 | 3.3939 | 1 |
| MT1E | ENSG00000169715 | −4.6642 | −4.88026 | −3.28382 | 1 |
| KRT19 | ENSG00000171345 | −7.83913 | −0.08243 | −4.88346 | 1 |
| PCP4 | ENSG00000183036 | 5.81902 | 6.25473 | 11.70128 | 1 |
| PRKDC | ENSG00000253729 | 1.66017 | 3.23843 | 3.03546 | 1 |
| ECT2 | ENSG00000114346 | 3.70911 | 3.9173 | 3.83929 | 1 |
| GPC3 | ENSG00000147257 | 6.69558 | 48.20131 | 5.73207 | 1 |
| NEK2 | ENSG00000117650 | 4.59389 | 4.92142 | 4.42022 | 1 |
| IGF2BP3 | ENSG00000136231 | 4.17574 | 4.41326 | 10.92255 | 1 |
| TOP2A | ENSG00000131747 | 3.78932 | 7.87384 | 5.88399 | 1 |
| LINC01296 | ENSG00000225210 | 3.74067 | 2.18693 | 4.50733 | 1 |
| CDKN3 | ENSG00000100526 | 3.56619 | 7.41384 | 3.76503 | 1 |
| KIFC1 | ENSG00000237649 | 3.55141 | 6.40478 | 4.62818 | 1 |
| CDC6 | ENSG00000094804 | 3.50848 | 4.25098 | 6.85057 | 1 |
| RRM2 | ENSG00000171848 | 3.46461 | 5.98463 | 5.28157 | 1 |
| NPTX2 | ENSG00000106236 | 3.45686 | 6.67847 | 7.41823 | 1 |
| E2F1 | ENSG00000101412 | 3.27154 | 2.54069 | 3.71732 | 1 |
| SPC24 | ENSG00000161888 | 3.24549 | 3.33069 | 3.30792 | 1 |
| NDC80 | ENSG00000080986 | 3.1731 | 4.25659 | 4.86635 | 1 |
| CCNB1 | ENSG00000134057 | 3.14867 | 3.77213 | 3.75835 | 1 |
| CAP2 | ENSG00000112186 | 3.09344 | 4.42927 | 3.03771 | 1 |
| ILDR2 | ENSG00000143195 | 2.95727 | 3.09174 | 5.07959 | 1 |
| CDCA5 | ENSG00000146670 | 2.74062 | 2.87947 | 4.88485 | 1 |
| SPC25 | ENSG00000152253 | 2.72275 | 3.7479 | 3.91746 | 1 |
| WNK4 | ENSG00000126562 | 2.68608 | 2.81443 | 7.44544 | 1 |
| DSCC1 | ENSG00000136982 | 2.54195 | 2.35281 | 5.17976 | 1 |
| TPX2 | ENSG00000088325 | 2.35767 | 3.50718 | 4.146 | 1 |
| MCM4 | ENSG00000104738 | 2.26396 | 13.56839 | 3.96324 | 1 |
| STMN1 | ENSG00000117632 | 2.24212 | 4.70595 | 3.27588 | 1 |
| RAB11FIP4 | ENSG00000131242 | 2.22493 | 4.63095 | 4.70989 | 1 |
| ATAD2 | ENSG00000156802 | 2.199 | 5.32576 | 3.90413 | 1 |
| LINC00890 | ENSG00000260802 | 2.19088 | 4.82653 | 3.9521 | 1 |
| LRRC1 | ENSG00000137269 | 2.01442 | 2.283 | 3.9815 | 1 |
| TMCO3 | ENSG00000150403 | 1.92578 | 4.78402 | 2.39177 | 1 |
| RNASEH2A | ENSG00000104889 | 1.81653 | 3.00351 | 2.33324 | 1 |
| KPNA2 | ENSG00000182481 | 1.81336 | 4.90223 | 4.04555 | 1 |
| NCAPG2 | ENSG00000146918 | 1.73858 | 3.13567 | 2.10937 | 1 |
| MCM6 | ENSG00000076003 | 1.69396 | 2.12253 | 3.77962 | 1 |
| MPP7 | ENSG00000150054 | 1.68242 | 2.0019 | 1.74641 | 1 |
| RAP2A | ENSG00000125249 | 1.65774 | 2.06046 | 2.33929 | 1 |
| FEN1 | ENSG00000168496 | 1.60373 | 2.97668 | 2.23066 | 1 |
| DNAJB11 | ENSG00000090520 | 1.49283 | 3.11831 | 1.63619 | 1 |
| CHAF1A | ENSG00000167670 | 1.48165 | 2.66128 | 2.62469 | 1 |
| GMFB | ENSG00000197045 | 1.44324 | 2.03542 | 1.86856 | 1 |
| XPO5 | ENSG00000124571 | 1.3182 | 2.39874 | 1.77466 | 1 |
| MCM5 | ENSG00000100297 | 1.30787 | 2.69499 | 2.59817 | 1 |
| CCT3 | ENSG00000163468 | 1.30636 | 1.86452 | 2.12215 | 1 |
| C8orf33 | ENSG00000182307 | 1.2652 | 3.01654 | 2.37593 | 1 |
| TOPBP1 | ENSG00000163781 | 1.24664 | 1.65037 | 2.22828 | 1 |
| AP3B1 | ENSG00000132842 | 1.24314 | 1.36209 | 2.36565 | 1 |
| ZNF318 | ENSG00000171467 | 1.22969 | 2.17895 | 1.3713 | 1 |
| NRAS | ENSG00000213281 | 1.1944 | 1.90377 | 2.19385 | 1 |
| IMPAD1 | ENSG00000104331 | 1.1827 | 2.65503 | 1.26094 | 1 |
| CASC3 | ENSG00000108349 | 1.16172 | 2.04818 | 2.13726 | 1 |
| PLIN2 | ENSG00000147872 | −1.57993 | −9.02079 | −0.96221 | 1 |
| SLC9B2 | ENSG00000164038 | −1.58984 | −3.84617 | −1.85914 | 1 |
| APOC3 | ENSG00000110245 | −1.6752 | −2.03541 | −1.88496 | 1 |
| C1RL | ENSG00000139178 | −1.72071 | −3.09084 | −1.13558 | 1 |
| APOA5 | ENSG00000110243 | −1.87453 | −6.04383 | −0.68727 | 1 |
| DUSP1 | ENSG00000120129 | −1.95823 | −1.38867 | −1.26048 | 1 |
| ELFN1 | ENSG00000225968 | −1.96331 | −1.96993 | −3.0736 | 1 |
| CPED1 | ENSG00000106034 | −2.1205 | −4.57252 | −3.03567 | 1 |
| HAO2 | ENSG00000116882 | −2.15061 | −3.1158 | −6.90745 | 1 |
| CD4 | ENSG00000010610 | −2.2155 | −3.21416 | −1.98748 | 1 |
| SIK1 | ENSG00000142178 | −2.27454 | −1.80335 | −1.92151 | 1 |
| JUN | ENSG00000177606 | −2.28904 | −2.72961 | −2.90138 | 1 |
| GLYATL1 | ENSG00000166840 | −2.30506 | −3.70031 | −6.67388 | 1 |
| RNF125 | ENSG00000101695 | −2.35564 | −4.72963 | −2.57557 | 1 |
| ZFP36 | ENSG00000128016 | −2.38677 | −2.51381 | −1.17723 | 1 |
| SLC25A25 | ENSG00000148339 | −2.39061 | −2.11789 | −1.76758 | 1 |
| GHR | ENSG00000112964 | −2.39418 | −3.19779 | −2.12169 | 1 |
| FNDC5 | ENSG00000160097 | −2.40277 | −1.06861 | −0.41524 | 1 |
| TUBE1 | ENSG00000074935 | −2.44288 | −1.83835 | −2.34443 | 1 |
| BASP1 | ENSG00000176788 | −2.4948 | −3.00603 | −1.48037 | 1 |
| AXL | ENSG00000167601 | −2.54167 | −3.08151 | −2.85617 | 1 |
| SIGLEC9 | ENSG00000129450 | −2.57102 | −4.86738 | −0.75731 | 1 |
| SOD3 | ENSG00000109610 | −2.58894 | −3.18319 | −1.66614 | 1 |
| ITGA9 | ENSG00000144668 | −2.58901 | −3.32054 | −0.0628 | 1 |
| LTBP4 | ENSG00000090006 | −2.60075 | −1.22862 | −0.41992 | 1 |
| SCD5 | ENSG00000145284 | −2.62197 | −2.56407 | −2.11132 | 1 |
| SLCO1B3 | ENSG00000111700 | −2.6842 | −2.69802 | −5.58764 | 1 |
| FMOD | ENSG00000122176 | −2.77173 | −2.79249 | −1.15235 | 1 |
| CCDC8 | ENSG00000169515 | −2.77829 | −3.85332 | −0.45075 | 1 |
| ZG16 | ENSG00000174992 | −2.84472 | −3.94831 | −6.66402 | 1 |
| CYR61 | ENSG00000142871 | −2.88197 | −1.55566 | −1.58764 | 1 |
| ATOH8 | ENSG00000168874 | −2.93244 | −2.67086 | −0.46223 | 1 |
| NAPSB | ENSG00000131401 | −2.93861 | −2.66964 | −0.63814 | 1 |
| EPHA3 | ENSG00000044524 | −2.97377 | −3.25992 | −0.52222 | 1 |
| LIFR | ENSG00000113594 | −2.98691 | −3.08581 | −2.16499 | 1 |
| SPINT2 | ENSG00000167642 | −3.00095 | −1.64562 | −0.55595 | 1 |
| CBFA2T3 | ENSG00000129993 | −3.00888 | −3.77525 | −1.86623 | 1 |
| LRAT | ENSG00000121207 | −3.05516 | −2.1515 | −0.27735 | 1 |
| HK3 | ENSG00000160883 | −3.09838 | −4.88762 | −1.22705 | 1 |
| CCDC3 | ENSG00000151468 | −3.13399 | −1.3851 | −0.36563 | 1 |
| CLEC11A | ENSG00000105472 | −3.16525 | −2.90822 | −0.35132 | 1 |
| LUM | ENSG00000139329 | −3.27485 | −7.87725 | −2.1099 | 1 |
| BGN | ENSG00000182492 | −3.29078 | −1.26777 | −0.2382 | 1 |
| PDGFRA | ENSG00000134853 | −3.33398 | −2.44174 | −1.62291 | 1 |
| FLRT2 | ENSG00000185070 | −3.33691 | −3.07343 | −0.08757 | 1 |
| DNASE1L3 | ENSG00000163687 | −3.34188 | −2.87391 | −0.61433 | 1 |
| MUC6 | ENSG00000184956 | −3.36666 | −3.1778 | −4.55444 | 1 |
| F3 | ENSG00000117525 | −3.55746 | −1.52165 | −0.24152 | 1 |
| EMILIN1 | ENSG00000138080 | −3.57648 | −2.06645 | −0.09991 | 1 |
| NPY1R | ENSG00000164128 | −3.5873 | −1.80612 | −3.00335 | 1 |
| CFD | ENSG00000197766 | −3.64701 | −2.44716 | −0.41218 | 1 |
| LINC01093 | ENSG00000249173 | −3.66018 | −2.4372 | −10.6732 | 1 |
| MT1L | ENSG00000260549 | −3.71369 | −2.74345 | −0.5047 | 1 |
| CETP | ENSG00000087237 | −3.71383 | −2.38768 | −2.83555 | 1 |
| ID1 | ENSG00000125968 | −3.74935 | −2.1337 | −0.19721 | 1 |
| BBOX1 | ENSG00000129151 | −3.93893 | −1.66785 | −6.66724 | 1 |
| FOSB | ENSG00000125740 | −3.99534 | −1.09388 | −7.07272 | 1 |
| OLFML3 | ENSG00000116774 | −4.00913 | −1.05727 | −1.12012 | 1 |
| COLEC11 | ENSG00000118004 | −4.0223 | −1.19888 | −2.11079 | 1 |
| LY6E | ENSG00000160932 | −4.10135 | −5.33369 | −3.08455 | 1 |
| CYP1A2 | ENSG00000140505 | −4.20516 | −9.26267 | −15.89338 | 1 |
| NAT2 | ENSG00000156006 | −4.23592 | −7.93172 | −1.64186 | 1 |
| PTGDS | ENSG00000107317 | −4.24983 | −4.1844 | −0.11055 | 1 |
| JCHAIN | ENSG00000132465 | −4.27411 | −3.62121 | −0.81434 | 1 |
| HGFAC | ENSG00000109758 | −4.3641 | −1.2476 | −4.71711 | 1 |
| FOS | ENSG00000170345 | −4.5662 | −3.03939 | −4.97304 | 1 |
| CXCL12 | ENSG00000107562 | −4.67191 | −7.73448 | −3.31656 | 1 |
| MT1F | ENSG00000198417 | −4.81179 | −1.43756 | −1.49158 | 1 |
| EGR1 | ENSG00000120738 | −4.90293 | −5.01988 | −4.21103 | 1 |
| ECM1 | ENSG00000143369 | −4.97399 | −1.05713 | −2.02828 | 1 |
| CCL21 | ENSG00000137077 | −4.98326 | −5.45316 | −2.61253 | 1 |
| KRT7 | ENSG00000135480 | −4.98511 | −8.73022 | −3.0366 | 1 |
| DCN | ENSG00000011465 | −5.04744 | −6.68938 | −1.20006 | 1 |
| C7 | ENSG00000112936 | −5.04798 | −4.11697 | −1.90933 | 1 |
| NGFR | ENSG00000064300 | −5.08919 | −12.36062 | −1.63363 | 1 |
| MT1G | ENSG00000125144 | −5.57737 | −2.62115 | −5.13394 | 1 |
| STAB2 | ENSG00000136011 | −6.01684 | −2.33873 | −4.56877 | 1 |
| DPT | ENSG00000143196 | −6.18095 | −2.84831 | −3.6496 | 1 |
| SMIM24 | ENSG00000095932 | −6.25947 | −6.88606 | −5.05538 | 1 |
| COLEC10 | ENSG00000184374 | −6.27785 | −6.38766 | −3.99517 | 1 |
| CRHBP | ENSG00000145708 | −6.28137 | −3.74193 | −6.63638 | 1 |
| IGF2 | ENSG00000167244 | −6.74572 | −2.80769 | −7.81102 | 1 |
| MARCO | ENSG00000019169 | −8.38192 | −2.64823 | −6.31754 | 1 |
Gene ontology (GO) enrichment analysis based on the R package “ggplot” was used to explore the function of the DEGs (Fig. 1D). The DEGs were mainly enriched in 3 functional groups: extracellular structure organization, mitotic nuclear division and sister chromatid segregation. The R package “ggplot” was also used to perform pathway enrichment analysis of the DEGs (Fig. 1E). The main enriched pathways of the DEGs included diseases associated with glycosaminoglycan metabolism, initial triggering of complement and the mitotic G1-G2/S phases. To explore the interaction level of crucial genes associated with HCC, the online STRING and Cytoscape software were used to derive protein protein interaction (PPI) information and plot the results (Fig. 1F and Supplementary Fig. S3). In the STRING results, a total of 133 nodes and 409 edges were obtained. We found that genes such as GMNN, ECT2, PRKDC, MT1E, HMMR, and KRT19 were located in the center of the network, and determination of their functions deserves further study.
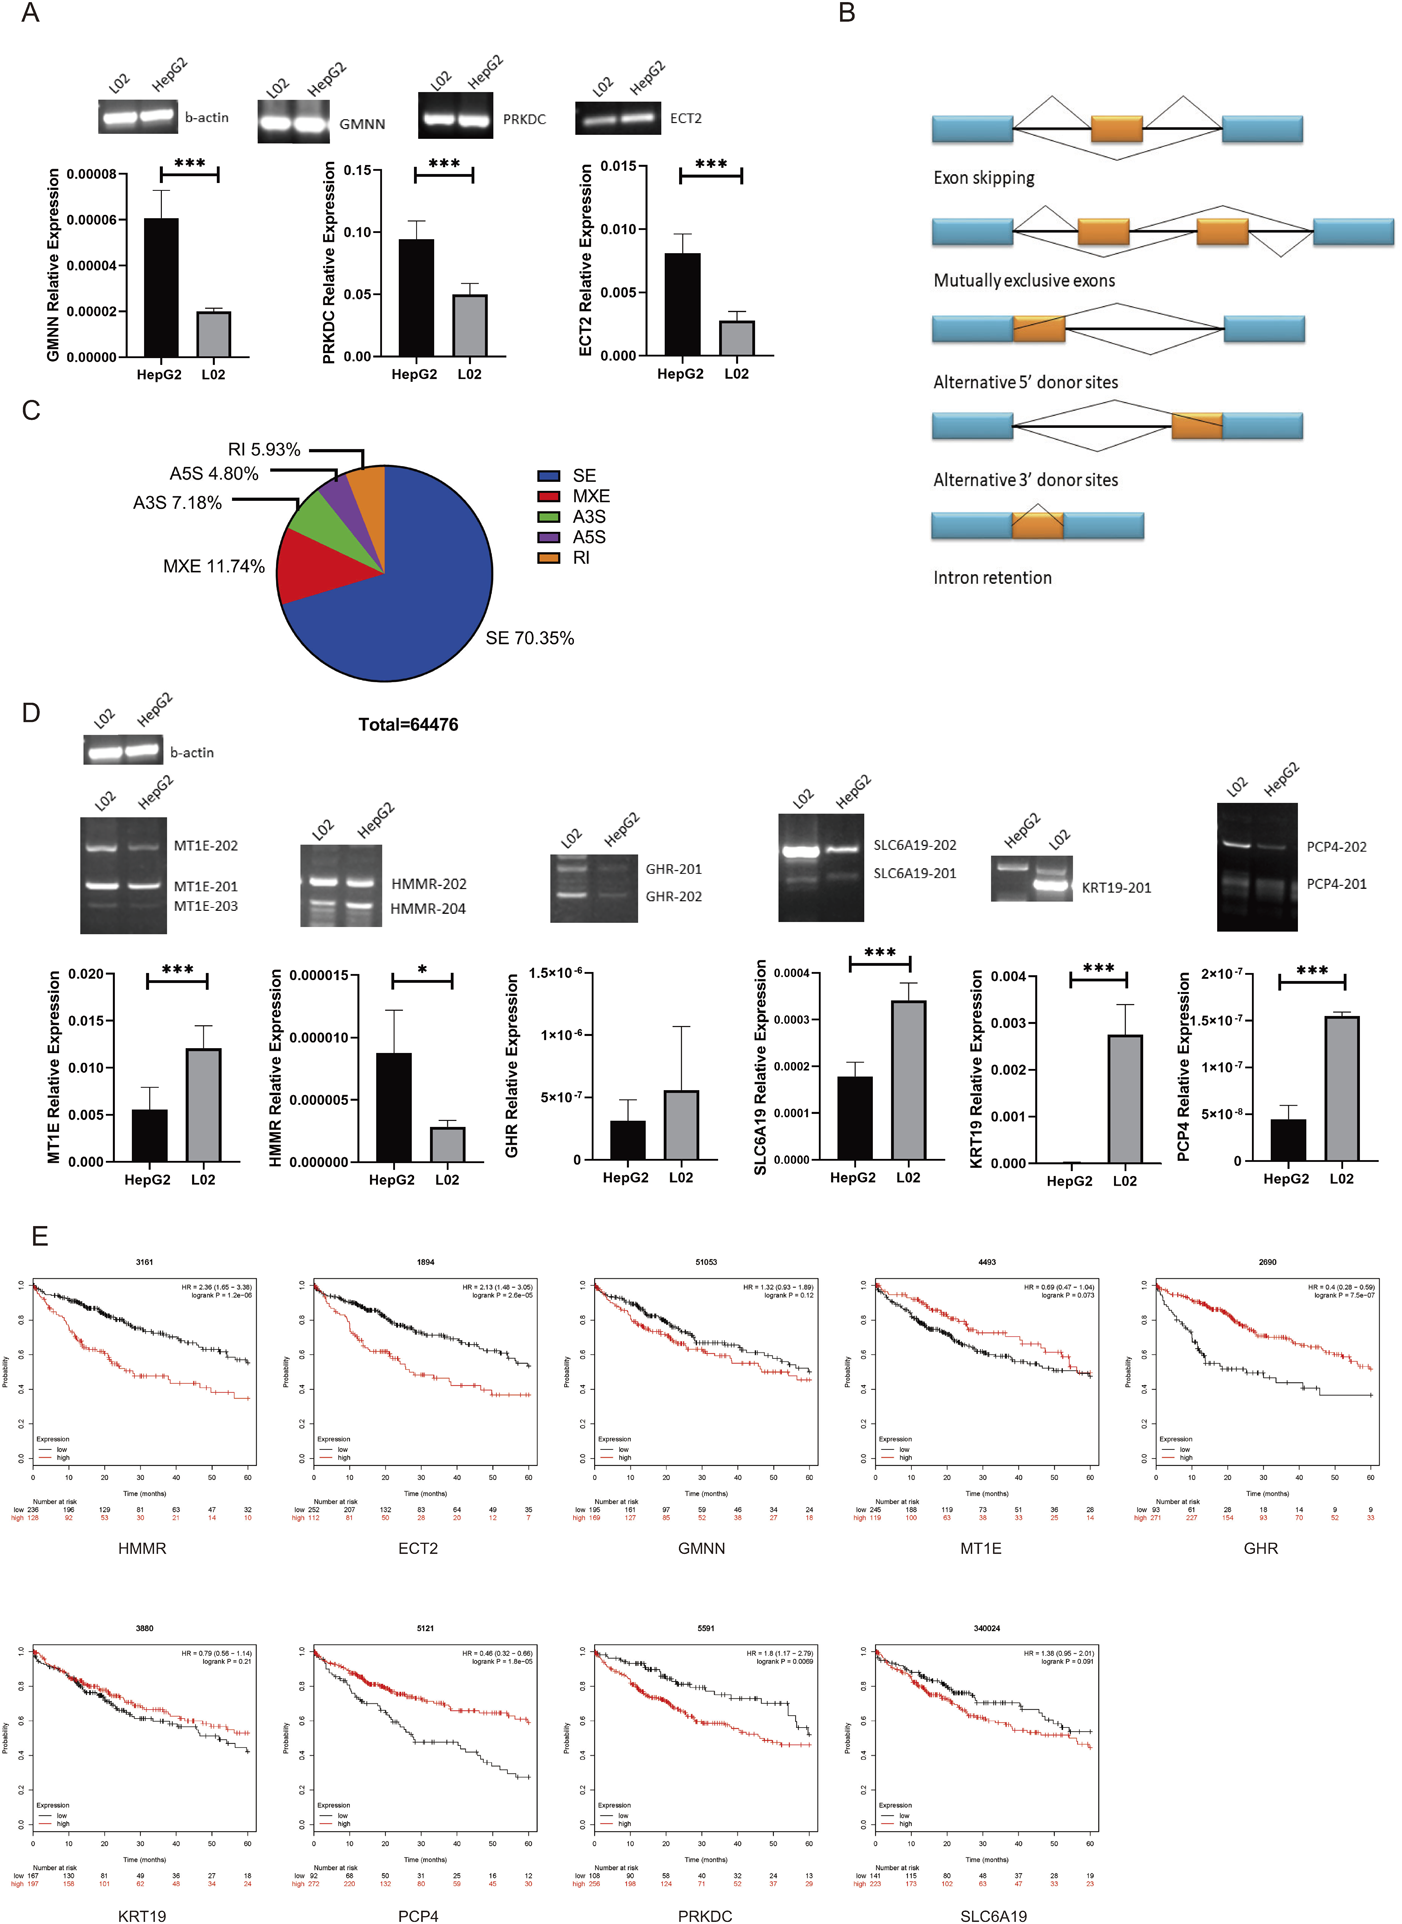
Identification and Analysis of AS Events of Key GenesBased on the gene expression and PPI results, we found 3 DEGs, namely, GMNN, PRKDC, and ECT2. The expression of these genes in the HepG2 cell line (human hepatocellular carcinoma cell line) and L02 cell line (human normal liver cell line) was measured by RT-PCR and quantitative (q)RT-PCR. We found that GMNN, PRKDC, and ECT2 were upregulated in the HepG2 cell line, which was consistent with the bioinformatics analysis results of the RNA-seq data (Fig. 2A). Furthermore, GPC3 and AFP are proven markers of liver cancer, and both were upregulated in our RNA-seq results. From this point of view, the analysis results obtained from the calculation methods in this study are credible and can be used in follow-up experiments.
To identify alternative splicing events at the transcript level, we performed alternative splicing analysis on 12 sequencing files. A total of 64476 alternative splicing events were found using rMATs software. Five types of AS events were found in the RNA-seq samples. The most frequent AS type found in the annotated isoforms was skipped exons (SEs), which accounted for more than two-thirds of the variants, followed by mutually exclusive exons (MXE) and alternative 3′ and 5′ splice sites (A3S and A5S), which accounted for 24%. Retained introns (RIs) only contributed 6% of the AS events (Fig. 2B). Figure 2C shows 5 different AS events. Referring to the results of the rMAT analysis, we selected 6 key variants from the DEGs with skipping exon events for further study: SLC6A19-201, HMMR-204, GHR-202, MT1E-203, PCP4-201, KRT19-201 (Supplementary Fig. S2 and Supplementary Table S3). Among them, four variants, SLC6A19-201, GHR-202, MT1E-203 and KRT19-201, were downregulated in tumor tissues, and HMMR-204 and PCP4-201 were upregulated in tumor tissues. To verify this result, we examined the expression of these 6 variants in the HepG2 and L02 cell lines, and the experimental results were consistent with the calculated results (Fig. 2D). We found that the expression levels of MT1E-203 in the HepG2 and L02 cell lines were significantly different, and the number of MT1E gene variants was relatively small, so we chose this variant for subsequent experiments and exploration.
So far, 9 genes have been successfully verified. To explore the correlation among these genes and liver cancer, we analyzed the correlation between the expression of these 9 genes and the survival time of patients. Prognostic data of the key genes were obtained from the Kaplan–Meier Plotter online database (http://kmplot.com/analysis/). Abnormal expression of the key genes resulted in a poor prognosis of HCC (Fig. 2E). The three most influential genes were HMMR (HR = 2.36 [1.65–3.38], p = 1.2e-06), ECT2 (HR = 2.13 [1.48–3.05], p = 2.6e-05) and GMNN (HR = 1.32 [0.93–1.89], p = 0.12). According to the results, these 9 differentially expressed genes may be important in HCC. The specific mechanisms of these genes deserve further study
From the results of RT-PCR and qRT-PCR, we found that the analytical pipelines used in this study had high credibility and accuracy. In searching for possible therapeutic targets for liver cancer, we selected MT1E-203, which had the fewest isoforms of the six variants and played an important role in PPIs and pathways, for further study.
Function Exploration of MT1E-203To investigate the role of MT1E-203 in HCC, we explored the function of MT1E-203. First, we constructed the overexpression vector pEGFP-N1-MT1E-203 for MT1E-203 and the empty vector pEGFP-N1 and transfected the overexpression vector and the empty vector into the HCC cell line HepG2 and Huh7, respectively. Supplementary Fig. S4 shows the vector pEGFP-N1-MT1E-203 and restriction sites. Then, two pairs stably transfected cell lines were constructed through G418 pressure screening, namely HepG2-MT1E-203 (recombinant vector) group and HepG2-NC (empty vector) group, Huh7-MT1E-203 group and Huh7-NC group. In addition, we constructed MT1E-203 knockdown cell lines L02-MT1E-203 and L02-NC using RNA interference (RNAi).
Next, we explored the relationship between the expression of MT1E-203 and proliferation of HCC cells and normal liver cells. According to the MTT and BrdU-ELISA results, the viability and proliferation ability of the overexpression group (HepG2-MT1E-203 and Huh7-MT1E-203) cells decreased significantly with time compared with those of the NC group (HepG2-NC and Huh7-NC) (Figs. 3A, B). The viability and proliferation ability of the knockdown group (L02-MT1E-203) cells increased with time compared with the NC group (L02-NC) (Fig. 3C). According to the results of the colony formation assay, the number of clones in the overexpression group was significantly lower than that in the NC group (Figs. 3D, E). On the contrary, knockdown of MT1E-203 in L02 cells significantly increased the number and size of clones, indicating that knockdown of MT1E-203 could promote cell proliferation (Fig. 3F). Overexpression of MT1E-203 increased cell apoptosis and caused cell cycle arrest in the S phase. Western blot analysis was performed to evaluate the change in expression of cell proliferation-related proteins caused by overexpression of MT1E-203 (Figs. 3G, H). The results showed that, compared with the NC group, the expression levels of p53 and p21 proteins were upregulated in the overexpression group, and the expression levels of cyclin A, cyclin E, cyclin D, CDK2, and CDK4 downregulated. In addition, we found that the overexpression of MT1E-203 significantly enhanced the phosphorylation of P53 protein, which improved the stability and activity of P53. It is inferred that MT1E-203 affects cell proliferation through p53 cell cycle-related pathways, which arrests the cell cycle in the G1 and S phases (Fig. 3K). In addition, flow cytometry was used to detect apoptosis markers and cell cycle markers in the NC group and the overexpression group (Fig. 3I). According to the results, the number of early and late apoptotic cells increased, the number of G2 phase cells decreased and the number of S phase cells increased in the overexpression group compared with the NC group (Fig. 3J).
Changes in the MT1E-203 Protein Structure Due to AS EventsTo explore whether alternative splicing events can cause changes in protein structure, we downloaded the translated protein sequences of MT1E-201 and MT1E-203 that did not undergo alternative splicing in the Protein Data Bank (PDB) database, and their names were P04732 and H3BU80, respectively, and then, we used the protein structure prediction software I-TASSER and the SWISS-MODEL model (Fig. 4A). It was found that due to the occurrence of exon skipping events, the H3BU80 protein expressed by MT1E-203 lacked the key sequence from cysteine 13 to cysteine 34, thereby losing the ability to bind one sulfide ion and two zinc ions. In addition, we used Ligplus software to analyze the binding sites of zinc ions and sulfide ions and found that the loss of binding ability was caused by the deletion of the sequence near the binding site (Fig. 4B).
DISCUSSION
Although there is much basic and clinical research on the molecular origin and related pathways of liver cancer, research progress on gene expression caused by AS has been slow, mainly because the traditional method used to discover AS events is affected by gene expression, gene length and difficult primer design. These constraints lead to lower efficiency and accuracy of experiments. AS discovery methods based on RNA-seq data analysis take advantage of the high throughput and high accuracy of RNA-seq, greatly improving the efficiency of identifying AS events.
In this study, the combination of clinical liver cancer and paracancerous sample sequencing data and TCGA data resulted in the identification of 139 differentially expressed genes. Among these genes, GPC3 and AFP are frequently reported genes that are related to HCC. Studies have found that GPC3 is normally expressed in the placenta, mammary gland, mesothelium, lung, and kidney.16) In addition, a study has found that in normal liver cells, GPC3 is hardly expressed and is highly expressed in liver cancer cells, so GPC3 has become a liver cancer biomarker for the screening and diagnosis of liver cancer.17) AFP is the most commonly used biomarker for HCC diagnosis in clinical practice, and it is also used for recurrence and prognosis of HCC.18) Based on the results of the GO analysis, we identified 9 core genes. RT-PCR and qRT-PCR confirmed that GMNN, SLC6A19, HMMR, MT1E, GHR, KRT19, PCP4, PRKDC, and ECT2 were differentially expressed in liver cancer and normal liver cells. After combining all the variable splicing events obtained by rMAT analysis, we found 6 candidate transcripts, SLC6A19-201, HMMR-204, GHR-202, MT1E-203, PCP4-201, and KRT19-201, for subsequent experiments and selected the transcript MT1E-203 to construct an overexpression vector, which had the highest level of expression of the candidate transcripts. Overexpression of MT1E-203 was found to result in cell cycle arrest and cell apoptosis according to the MTT and flow cytometry results. Subsequently, WB experiments showed that some proteins related to apoptosis and proliferation changed in expression due to overexpression of MT1E-203. Metallothionein 1E (MT1E) is the name of a family of low-molecular weight intracellular metalloproteins with a high affinity for heavy metal ions, such as zinc, cadmium, copper, mercury, and platinum.19) We used protein structure prediction software to simulate the protein structure of the MT1E gene variant referring to the structure of the MT1E gene in the PDB (Protein Data Bank) database. MT1E lost its binding site due to SE events. The ability of to bind zinc ions may have an effect on cell metabolism and proliferation. Shen et al.20) analyzed gene expression in 606 tumors and 550 nontumor samples from GEO. From these samples, 173 DEGs were identified, and through GO analysis and PPI analysis, the final 10 core genes were identified. However, the SHEN study only carried out bioinformatics analysis and did not involve validation by biological experiments. Therefore, our research is undoubtedly more convincing. In addition, Luo et al.21) used RNA-seq to analyze 20 clinical samples and explored SRSF2-regulated AS events without adequate bioinformatics analysis. For expression analysis of a single gene, the traditional RNA-seq analysis method is still credible, but for comparison and screening of multiple genes and multiple transcripts, a single analysis method has drawbacks. For example, the research of Yang et al.22) directly uses the SAM file downloaded from the GEO database for analysis. The mapping process of the sequencing data is not considered, and some important information may be lost. Various calculation and analysis methods meet the needs of different studies. In this study, analysis methods of two kinds of sequencing data were combined to avoid errors caused by a single method. Among the analysis methods used, the HSB pipeline takes less time and saves disk space, but the TCC pipeline produces more result files and obtains more comprehensive sequence information. TopHat maps reads on a genome and then assembles the reads into full-length transcripts. Cufflinks quantifies the expression level of each transcript. Then, Cuffdiff integrates differentially expressed transcripts and their differential expression ratios. In the HSB pipeline, HISAT aligns the RNA-seq reads to a genome and finds cleavage sites. Stringtie integrates the results from the previous step and estimates the level of gene expression. Ballgown used rigorous statistical methods for differential expression analysis of genes and variants.23) This research innovatively used two calculation pipelines to make the results more closely resembled the reference value. By combining complete DEG analysis and AS analysis, the entire bioinformatics process was fast and accurate. Finally, the key variant MT1E-203, which is a potential liver cancer marker, was verified through biological experiments.
In summary, the combination of the two sequencing data analysis methods used in this study are reported for the first time, and the prediction of the structure and binding site of the splice variant is the highlight of this study. Numerous studies have shown that changes in shear may cause a variety of diseases, including cancer. This study analyzed differential expression between gene variants. The high accuracy of sequencing technology facilitates the discovery of more significant shear variants through the study of their pathways and functions leading to cancer. The use of molecular targets or molecular markers can lead to the early diagnosis of cancer and can improve the treatment and cure rate of liver cancer.
CONCLUSION
In summary, we identified 139 DEGs by bioinformatics analysis of clinical sequencing samples and TCGA database samples. Then, 6 key variants were identified by alternative splicing analysis, and we found that the variant MT1E-203 was expressed at low levels in liver cancer tissues and cell lines. Overexpression of MT1E-203 reduced the viability and proliferation of liver cancer cells and blocked the cell cycle by affecting the P53 gene pathway. In addition, the protein structure of MT1E-203 might have been changed due to exon skipping, leading to the loss of sites for binding zinc ions. MT1E-203 is a potential liver cancer marker and therapeutic target.
It is inferred that the bioinformatic analysis methods used in this study are credible. This study provides a meaningful method for screening differential genes and analyzing alternative splicing. The analysis process is expected to be extended to research on other diseases.
Acknowledgments
We are grateful to the patients who contributed the clinical samples to this study, and we thank all the teachers and students of the National Engineering Laboratory for Druggable Gene and Protein Screening, Northeast Normal University for their support and assistance in this research. This work was supported by the Natural Science Foundation of Jilin Province, P. R. China [Grant No. 20180101242JC], National Natural Science Foundation of China [Grant No. 81700709], Science and Technology Development Research Foundation of Jilin Province [Grant No. 20180520105JH], and Systems Biology Research on Genome and Transcriptome of Stem Cells [Grant No. 2017030] of Jilin Province Sunbird Regenerative Medical Engineering Co., Ltd.
Author Contributions
Yanxin Huang and Yuxin Li: conceiving and designing the research. Mengqi Cui: the major contributor in writing the manuscript, performing the research. Miao Bai: performing Western blot experiment and protein structure prediction. Zhenxiang Yu, Lihua Zheng, Yongli Bao, Luguo Sun, Chunlei Yu, Ying Sun, Zhenbo Song and Guannan Wang: providing technical and material assistance for this article. All authors reviewed the manuscript.
Conflict of Interest
The authors declare no conflict of interest.
Supplementary Materials
The online version of this article contains supplementary materials.
REFERENCES
- 1) Li Y, Dong Y, Huang Z, Kuang Q, Wu Y, Li Y, Li M. Computational identifying and characterizing circular RNAs and their associated genes in hepatocellular carcinoma. PLOS ONE, 12, e0174436 (2017).
- 2) Sturm JW, Keese M. Multimodal treatment of hepatocellular carcinoma (HCC). Onkologie, 27, 294–303 (2004).
- 3) Wei L, Chiu DK, Tsang FH, Law DC, Cheng CL, Au SL, Lee JM, Wong CC, Ng IO, Wong CM. Histone methyltransferase G9a promotes liver cancer development by epigenetic silencing of tumor suppressor gene RARRES3. J. Hepatol., 67, 758–769 (2017).
- 4) Feng H, Qin Z, Zhang X. Opportunities and methods for studying alternative splicing in cancer with RNA-Seq. Cancer Lett., 340, 179–191 (2013).
- 5) Zhao S. Alternative splicing, RNA-seq and drug discovery. Drug Discov. Today, 24, 1258–1267 (2019).
- 6) Ghosh S, Chan C-KK. Analysis of RNA-Seq data using TopHat and Cufflinks. Plant Bioinformatics. Springer, New York, pp. 339–361 (2016).
- 7) Trapnell C, Williams BA, Pertea G, Mortazavi A, Kwan G, Van Baren MJ, Salzberg SL, Wold BJ, Pachter L. Transcript assembly and quantification by RNA-Seq reveals unannotated transcripts and isoform switching during cell differentiation. Nat. Biotechnol., 28, 511–515 (2010).
- 8) Trapnell C, Roberts A, Goff L, Pertea G, Kim D, Kelley DR, Pimentel H, Salzberg SL, Rinn JL, Pachter L. Differential gene and transcript expression analysis of RNA-seq experiments with TopHat and Cufflinks. Nat. Protoc., 7, 562–578 (2012).
- 9) Kim D, Langmead B, Salzberg SL. HISAT: a fast spliced aligner with low memory requirements. Nat. Methods, 12, 357–360 (2015).
- 10) Pertea M, Pertea GM, Antonescu CM, Chang T-C, Mendell JT, Salzberg SL. StringTie enables improved reconstruction of a transcriptome from RNA-seq reads. Nat. Biotechnol., 33, 290–295 (2015).
- 11) Frazee AC, Pertea G, Jaffe AE, Langmead B, Salzberg SL, Leek JT. Ballgown bridges the gap between transcriptome assembly and expression analysis. Nat. Biotechnol., 33, 243–246 (2015).
- 12) Alamancos GP, Agirre E, Eyras E. Methods to study splicing from high-throughput RNA sequencing data. Methods Mol. Biol., 1126, 357–397 (2014).
- 13) Shihao S, Juw Won P, Zhi-Xiang L, Lan L, Henry MD, Ying Nian W, Qing Z, Yi X. rMATS: robust and flexible detection of differential alternative splicing from replicate RNA-Seq data. Proc. Natl. Acad. Sci. U.S.A., 111, E5593–E5601 (2014).
- 14) Zhang Y. I-TASSER server for protein 3D structure prediction. BMC Bioinformatics, 9, 40 (2008).
- 15) Biasini M, Bienert S, Waterhouse A, Arnold K, Studer G, Schmidt T, Kiefer F, Cassarino TG, Bertoni M, Bordoli L, Schwede T. SWISS-MODEL: modelling protein tertiary and quaternary structure using evolutionary information. Nucleic Acids Res., 42 (W1), W252–W258 (2014).
- 16) Iglesias BV, Centeno G, Pascuccelli H, Ward F, Peters MG, Filmus J, Puricelli L, de Kier Joffé EB. Expression pattern of glypican-3 (GPC3) during human embryonic and fetal development. Histol. Histopathol., 23, 1333–1340 (2008).
- 17) Zhou F, Shang W, Yu X, Tian J. Glypican-3: A promising biomarker for hepatocellular carcinoma diagnosis and treatment. Med. Res. Rev., 38, 741–767 (2018).
- 18) Chaiteerakij R, Addissie BD, Roberts LR. Update on biomarkers of hepatocellular carcinoma. Clin. Gastroenterol. Hepatol., 13, 237–245 (2015).
- 19) Ryu H-H, Jung S, Jung T-Y, Moon K-S, Kim I-Y, Jeong Y, Jin S-G, Pei J, Wen M, Jang W-Y. Role of metallothionein IE in the migration and invasion of human glioma cell lines. Int. J. Oncol., 41, 1305–1313 (2012).
- 20) Shen S, Kong J, Qiu Y, Yang X, Wang W, Yan L. Identification of core genes and outcomes in hepatocellular carcinoma by bioinformatics analysis. J. Cell. Biochem., 120, 10069–10081 (2019).
- 21) Luo C, Cheng Y, Liu Y, Chen L, Liu L, Wei N, Xie Z, Wu W, Feng Y. SRSF2 regulates alternative splicing to drive hepatocellular carcinoma development. Cancer Res., 77, 1168–1178 (2017).
- 22) Yang MR, Zhang Y, Wu XX, Chen W. Critical genes of hepatocellular carcinoma revealed by network and module analysis of RNA-seq data. Eur. Rev. Med. Pharmacol. Sci., 20, 4248–4256 (2016).
- 23) Pertea M, Kim D, Pertea GM, Leek JT, Salzberg SL. Transcript-level expression analysis of RNA-seq experiments with HISAT, StringTie and Ballgown. Nat. Protoc., 11, 1650–1667 (2016).