Regular Articles
The Ethyl Acetate Subfraction of Polygonum cuspidatum Root Containing Emodin Affect EBV Gene Expression and Induce EBV-Positive Cells Apoptosis
2021 年 44 巻 12 号 p. 1837-1842

詳細
2021 年 44 巻 12 号 p. 1837-1842
Epstein-Barr virus (EBV), a human herpesvirus, is several human lymphoid malignancies-associated. Our earlier study found the effect of Polygonum cuspidatum root on promoting EBV-positive apoptosis. Therefore, this study investigated the effects of the Polygonum cuspidatum ethyl acetate subfraction containing emodin on EBV gene expression and anti-EBV tumor cells. Resultantly, the the Polygonum cuspidatum ethyl acetate subfraction containing emodin (F3a) promoted Raji cell death (50% cytotoxic concentration, CC50: 12.08 µg/mL); the 12.5 µg/mL F3a effect transcribed BRLF1 and BNLF1 and increased latent membrane protein 1 (LMP1), which may reduce the intracellular phospho-extracellular signal-regulated kinase (ERK) and phospho-inhibitor of Nuclear factor kappa B α (IκBα). Meanwhile, the Raji cells increased the intracellular reactive-oxygen species (ROS), activated the apoptosis-related proteins, cleaved caspase 3 and poly(ADP-ribose)polymerase (PARP), and increased the apoptosis percentage. Therefore, the Polygonum cuspidatum ethyl acetate subfraction containing emodin could be a therapeutic drug for EBV-related tumors.
Epstein-Barr virus (EBV) infects lymphocytes and epithelial cells1) and leads to infectious mononucleosis2) and various malignant diseases including: Burkitt’s lymphoma3); T-cell lymphoma4); Hodgkin’s disease5); gastric cancer6); nasopharyngeal carcinoma.7) The virus enters the latent period after infection with B lymphocytes,8) but when exposed to external factors including UV,9) 12-O-tetradecanoylphorbol-13-acetate (TPA),10) or sodium butyrate (SB),11) it will enter the lytic cycle to proliferate and then infect other cells. It importantly correlates the EBV-related malignant diseases. During the lytic cycle, the virus will express two earlier-early genes, BRLF1 and BZLF1, which can express the transcription factors, Rta and Zta,12) respectively. These two transcription factors can interact with each other or alone to activate others lytic genes, including BMRF1 and BALF5, encoded diffused early antigen (EA-D) and DNA polymerase,13) respectively. The EBV-BNLF1 encoded latent membrane protein 1 (LMP1), is an oncogene that directly induce Nuclear factor kappa B (NF-κB) activation or by stimulating phosphorylation of extracellular signal-regulated kinase (ERK) to activate NF-κB, it has the functions of anti-apoptosis, promoting cell proliferation and immortality.14) The BNLF1 gene expression, are positive-regulated by EBNA1, EBNA2 and lytic protein, Rta.15–17) The EBV infecting B lymphocytes induce reactive oxygen species (ROS) via the LMP1. However, when LMP1 was overexpressed, it induced ROS and regulated the related signal transduction mechanism, including down-regulating NF-κB and inducing cell necrosis or apoptosis.18)
Polygonum cuspidatum, herbal, is common for treating atherosclerosis, as well as others including: cancers; asthma; hypertension; cough.19,20) The root ethanol extract contains anthraglycoside B, physcion, piceid, emodin and resveratrol.21,22) The previous studies found the extract effect on EBV tumor cell death,23) and as a antivral source, inhibiting EBV lytic cycle induced by sodium butyrate,24–26) hepatitis B virus replication.27) and dengue virus entry.28) Therefore, this study was to explore the ethyl acetate subfraction of Polygonum cuspidatum root containing emodin (F3a) effects on EBV gene expression and apoptosis of EBV-positive tumor cell.
Taiwan Pingtung County San-Dei-Men P. cuspidatum in the Taiwan Tainan National Cheng Kung University herbarium was Prof. C. S. Kuoh-verified.
Sample PreparationThe 10-g dried P. cuspidatum root powder was extracted 3 times in 100 mL ethanol by refluxing at 85 °C for 2 h. After each extraction, the ethanol fractions were filtration-collected and hexane and water (10 : 10 : 1)-partitioned twice. The aqueous fractions were collected and concentrated under reduced pressure: PcE(H). The 1 g dried PcE(H) was 100 mL distilled water-dissolved and equal volume ethyl acetate (EtOAc)-partitioned. The EtOAc fractions were collected and concentrated under reduced pressure: PcE(H)E. The PcE(H)E soluble fraction was subjected to semi-preparative HPLC using HYPERPREP C18 (150 × 10 mm i.d., 8 µm) column (Thermo Fisher, MA, U.S.A.), and the peak eluted at 30.48 min using the mobile phase by: (A) water; (B) methanol. Gradient eluting was: 30–50% B in 0–15 min; 50–90% B in 15–35 min; 95% B in 35–45 min. An ethylacetate subfraction F3a and the 0.044% were collected. The resulting residues were finally dimethyl sulfoxide (DMSO)-dissolved.
HPLC AnalysisThe F3a components were HPLC-analyzed using a LiChrospher 100 RP-18e (250 × 4.6 mm i.d., 5 µm) column (Merck, Darmstadt, Germany). The mobile phase consisted of: (A) water; (B) methanol. Gradient eluting was: 30–50% B in 0–15 min; 50–90% B in 15–35 min; 95% B in 35–45 min. The flow rate was at 1 mL/min. The effluent from 210 to 500 nm was a diode array detector-monitored.
F3a Identification1H-NMR (200 MHz) and 13C-NMR (50 MHz) were the Bruker Advance 200 spectrometer-recorded. The F3a was identified as emodin by comparing the emodin NMR spectral data with those in the literatures.20)
F3a was, 1H-NMR (200 MHz, DMSO) δ: 12.17 (1H, each, s, OH); 7.45 (1H, s, H-4); 7.13 (1H, s, H-5); 7.03 (1H, s, H-2); 6.45 9 (1H, s, H-7); 2.39 (3H, s, CH3). 13C-NMR (50 MHz, DMSO) δ: 147.91 (C-3); 124.45 (C-4); 182.31 (C-10); 133.28 (C-4a); 114.06 (C-9a); 135.29 (C-10a); 21.91 (–CH3).
Cell Culture and F3a TreatmentThe Burkitt’s lymphoma-derived Raji cells, EBV-positive cells (latency III, LMP+); Akata (+) cell, EBV-positive cells (Latency I, LMP−); Akata (−) cells, EBV-negative cells, were maintained in the RPMI 1640 medium contained-10% fetal calf serum (Biological Industries, Israel). The Chang-Gung University Prof. S. T. Liu-obtained cells (6 × 10⁵/mL), were the 24 h F3a different concentrations-treated. The viable cell number was determined by trypan blue dye exclusion. The result was as a percentage, relative to vehicle-treated control incubations, and the CC50 values were the non-linear regression analysis (percent survival versus concentration)-calculated.
RNA Extraction and cDNA SynthesisConventional Trizol-chloroform (Invitrogen, Carlsbad, CA, U.S.A.)-extracted RNA was from the 3 × 10⁶ cells. DNA removing was by ribonuclease (RNase)-Free deoxyribonuclease (DNase) (Promega, Madison, WI, U.S.A.)). Total RNA was added to high capacity cDNA reverse transcription (Applied Biosystems) to produce cDNA. Briefly, the 10 µL of treated RNA (2 µg) was 0.8 µL 25× deoxyribonucleotide triphosphate (dNTP) (100 mM) and 2 µL 10 × RT Random Primers-mixed before the 2 µL 10 × RT buffer, 4.2 µL 0.1% diethyl pyrocarbonate (DEPC) water, and 1 µL MultiScribe™ Reverse Transcriptase (50 U/µL) added. The tube-contained components were mixed gently and incubated for: 10 min at 25 °C; 120 min at 37 °C; 5 min at 85 °C.
Real-Time Quantitative PCRFor mRNA analyzing, Quantitative PCR (qPCR) was with the SYBR green (Applied Biosystems). All reactions were in triplicate. The Mean cycle threshold (CT) value of the EB viral mRNA, including BZLF1, BRLF1, EBNA1, EBNA2, and BNLF1 mRNA, was subtracted from β-actin CT values to obtain the normalized CT (ΔCT) value. ΔCT: CT (BZLF1, BRLF1, EBNA1, EBNA2 or BNLF1)-CT (β-actin). The ΔCT value treated with F3a subtracted by untreated F3a to obtain the ΔΔCT value. ΔΔCT: CT (F3a)-CT (0). Relative EB viral mRNA performance was calculated by 2−ΔΔCT method. The primers for mRNA analysis included: BRLF1 forward (5′-TCA CTA CAC AAA CAG ACG CAG CCA-3′) and reverse (5′-AAT CTC CAC ACT CCC GGC TGT AA-3′); BZLF1 forward (5′-AGA AGC ACC TCA ACC TGG AGA CAA-3′) and reverse (5′-CAG CGA TTC TGG CTG TTG TGG TTT-3′); BNLF1 forward (5′-ACA CAC TGC CCT GAG GAT GG-3′) and reverse (5′-ATA CCT AAG ACA AGT AAG CA-3′); EBNA1 forward (5′-GAG CGG GGA GAT AAT GTA CA-3′) and reverse (5′-TAA AAG ATG GCC GGA CAA GG-3′); EBNA2 forward (5′-AGG GAT GCC TGG ACA CAA GA-3′) and reverse (5′-TTG TGA CAG AGG TGA CAA AA-3′); β-actin forward (5′-CGT CTT CCC CTC CAT CG-3′) and reverse (5′-CTC GTT AAT GTC ACG CAC-3′).
Immunoblot AnalysisCell lysate was prepared to perform sodium dodecyl sulfate (SDS)-polyacrylamide gel electrophoresis and immunoblot analysis.23) The protein expression was detected using anti-LMP1, anti-caspase, anti-phospho-ERK, anti-ERK, anti-inhibitor of Nuclear factor kappa B (IκB)α, anti-phospho-IκBα and anti-poly(ADP-ribose)polymerase (PARP) antibodies, which were purchased from Thermo Scientific (CA, U.S.A.) and Cell Signaling (Danvers, MA, U.S.A.), respectively. The band intensities were scanning densitometry-quantitated.
Raji Cell ROS EvaluatingTo determine the Raji cell ROS generation, the 2′-7′dichlorofluorescin diacetate (DCFH-DA) was used when it penetrated the cell membranes and was intracellular esterase-hydrolyzed to form DCFH. Subsequently, the DCFH reacted with the intracellular ROS to produce highly fluorescent DCF. The 6 × 10⁵ Raji cells were DCFH-DA (50 µM)-pretreated for 30 min before the F3a went into the medium. After incubated at 37 °C for 24 h, the intracellular stress-produced ROS was detected by a Bio-Tek FLx800 microplate fluorescence reader (Winooski, VT, U.S.A.) with excitation and emission wavelengths of 485 and 528 nm, respectively.
Flow Cytometry-Analyzed ApoptosisThe flow cytometry was to quantitatively detect the apoptosis rate. Briefly, the Raji cells (6 × 10⁵/mL) were the 24 h F3a various concentration-treated, harvested and washed in ice-cold phosphate buffered saline, and resuspended in Annexin V-fluorescein isothiocyanate (FITC) and propidium iodide (PI) binding buffer for 15 min. They were the flow cytometry-analyzed; viable cells, with negative Annexin V-FITC and PI staining; apoptosis, with positive Annexin V-FITC and negative PI staining.
Subfraction F3a was obtained from ethanolic extract of Polygonum cuspidatum through partition with hexane and ethyl acetate and separation by semi-prepared high pressure LC. Its components were analyzed by high liquid pressure chromatography and the identification of target compounds in F3a was based on retention time, UV spectrum (Fig. 1), 1H-NMR and 13C-NMR. We found that the peak eluting at 30.48 min was ascribed to emodin. The amount of emodin in F3a was 70.6%.

Mobile phase: methanol–water (methanol: 0–15 min, 30–50%; 15–35 min, 50–90%; 35–45 min, 95%); Flow rate: 1.0 mL/min; detection wavelength: 280 nm.
For the ethyl acetate subfraction of Polygonum cuspidatum Root containing emodin (F3a) effect on growing Raji cells, EBV-positive cells (latency III, LMP+); Akata (+) cells, EBV-positive cells (Latency I, LMP−) and Akata (−) cells, EBV-negative cells, the F3a went into Akata (−), Akata (+) and Raji cells (6 × 10⁵/mL). After 24 h treatment, the cell viabilities were trypan blue-measured. The results showed that F3a did not affect the growth of Akata (−) and Akata (+) cell, but observed the decreased survival rate (69.7 ± 8.5%) after the 9.4 µg/mL F3a treated Raji cells; the increased concentration (12.5 µg/mL) for decreasing the cell viability (48.8 ± 9.6%). The regression equation analysis showed the F3a dose effect on the Raji cell survival rate. The F3a concentration (CC50) which killed 50% of the cells was 12.08 µg/mL (Fig. 2).

The cell viabilities of Akata (−) (A), Akata (+) (B) and Raji cells were presented by mean ± standard deviation (S.D.) in three independent experiments (*p < 0.05 vs. 0: control).
The EBV LMP1, an oncogene, will lead to cell proliferation, anti-apoptosis, immortalization, and eventually forming tumors, and making the tumor cells invade and metastasize, but the LMP1 overexpression or inhibition will make B cell apoptotic. Therefore, we further investigated the F3a effect on the Raji cell EBV-encoded LMP1 protein. The Raji cells (6 × 10⁵ cells/mL) were treated with F3a (1.6–12.5 µg/mL) or EBV lytic inducer, SB (3 mM sodium butyrate) for 24 h, and the LMP1 was immunoblotting analysis-determined. The results showed the LMP1 protein-promoted cells with 12.5 µg/mL F3a or SB treatment (Fig. 3).
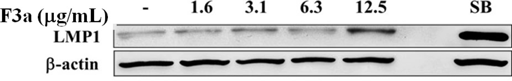
The Raji cells (6 × 10⁵ cells/mL) were 24 h F3a and SB-treated. The immunoblotting assay was using anti-LMP1 and β-actin monoclonal antibodies.
To observe the F3a effect on Raji cell EBV genes, Raji cells were treated with different concentrations of F3a or EBV lytic inducer, SB for 24 h. Total RNA was isolated from Raji cells and cDNA generated by reverse transcription. The mean cycle threshold (CT) values of EBV latent genes (EBNA1, EBNA2 and BNLF1), lytic genes (BZLF1 and BRLF1) and housekeeping gene (β-actin) mRNA expression quantified by Real time PCR assay. Further, a normalized CT (ΔCT) value was by subtracting the CT value of β-actin from EBV latent/lytic gene expression CT values. The relative gene expression by the 2−ΔΔCT method was analyzed. The results exhibited no F3a significant effects on BZLF1, EBNA1 and EBNA2 mRNA expression. The 12.5 µg/mL F3a promoted the BRLF1 mRNA expression by fifteen fold; the 6.3–12.5 µg/mL F3a, the relative BNLF1 gene expression by six and five-fold, respectively; the SB, the BNLF1 expression by 23-fold (Fig. 4).

The F3a (1.6–12.5 µg/mL) or SB (3 mM)-treated Raji cells (6 × 10⁵ cells/mL) were 24 h. The real time PCR determined the normalized CT values. Relative mRNA level was determined by 2−ΔΔCT method. The data were mean ± S.D. in the triplicate independent experiments (* p < 0.05 vs. 0).
The F3a induced the Raji cell EBV encoded LMP1 expression. The previous literatures showed the EBV LMP1 and lytic cycle activation effect on the intracellular reactive ROS production. Therefore, the Raji cells were 24 h F3a-treated; DCFH (dichlorofluorescin)-DA was to determine whether F3a increased the Raji cell ROS production. Resultantly, with the 3.1 and 6.3 µg/mL F3a-treated Raji cells, ROS compared with the cells untreated with F3a increased by 2.7 and 4 fold, respectively. The Raji cells exposed to higher concentration (12.5 µg/mL) increased at the ROS level, and was 2.8 fold compared with the control group (Fig. 5).

The cells were 24 h F3a-treated, and ROS production was DCFH-DA-measured (* p < 0.05 vs. 0: control).
The previous literatures indicated that EB-encoded LMP1 stimulated ERK phosphorylation and activated NF-κB entering to the nucleus, and thus the cells proliferate. The cytoplasmic NF-κB-combined I-κBα inactivated the NF-κB functions. The signal-induced I-κBα phosphorylated in the cytoplasm would promote the I-κBα degradation. As a result, the NF-κB translocated to the nucleus allowed the NF-κB to transcriptionally activate several genes, including: cell survival; proliferation; anti-apoptosis. Our result showed that F3a promoted the EBV-encoded LMP1 expression. Further, the F3a effect on the expression of phosphorylated ERK, non-phosphorylated ERK, phosphorylated I-κBα and non-phosphorylated I-κBα was investigated. The Raji cells were 24 h F3a or EBV lytic inducer, SB-treated. The phosphorylated ERK/non-phosphorylated ERK and phosphorylated I-κBα/non-phosphorylated I-κBα were immunoblotting-extracted and detected. Resultantly, the 6.3 and 12.5 µg/mL F3a-treated phosphorylated ERK/non-phosphorylated ERK (Fig. 6A) and phosphorylated I-κBα/ non-phosphorylated I-κBα profiles (Fig. 6B) significantly decreased in Raji cells. The phosphorylated ERK/non-phosphorylated ERK ratio decreased; phosphorylated I-κBα/non-phosphorylated I-κBα profiles increased in Raji cells with EBV lytic inducer, SB (Figs. 6A, B).

After the 24 h incubation, the cell lysates were Western blotting-analyzed with antibodies against ERK, phospho-ERK, IκBα, phospho-IκBα, and β-actin.
Our F3a induced the EBV LMP1 expression and inhibited the EBNA1 gene and ERK and IκBα intracellular phosphorylation. In addition, the F3a promoted the Raji cell ROS performance. Therefore, whether the F3a induced cell death, caspase-3 and PARP expression, apoptosis hallmark was further analyzed. The PARP and caspase-3 expression was immunoblotting-determined. Resultantly, the 12.5 µg/mL F3a significantly increased the cleaved caspase-3 and PARP expression (Fig. 7).

The F3a (1.6–12.5 µg/mL) and SB-treated Raji cells were 24 h. The immunoblotting assay was using the anti-caspase-3 (A), anti-PARP (B) and β-actin monoclonal antibodies.
The 24 h F3a effect on Raji cell apoptosis was investigated. Moreover, the Raji cells were stained with Annexin V and PI, and flow cytometry-observed. Resultantly, the 6.3 µg/mL F3a-treated early apoptotic cells increased from 7.18 to 17.74% (2.47 fold); the 12.5 µg/mL F3a-treated Raj cells, early apoptotic cells from 7.18 to 30.64% (4.27 fold): F3a-promoted Raji cell apoptosis (Fig. 8).

The Raji cells were 24 h F3a-treated and Annexin V-FITC and PI-stained. Note that most the intact cells were categorized into the double-negative group (lower left quadrant). The early apoptosis group was at a high percentage of Annexin V-positive and PI-negative staining (lower right quadrant); late apoptosis group, with a dead population categorized in the double-positive group (upper right quadrant).
The previous literatures showed that LMP1 directly activated the NF-κB by phosphorylating ERK and promoted the cell proliferation and immortality with the anti-apoptosis. The phosphorylated ERK also activated AP-1 or LMP to directly activate STAT3 and made tumor cells invade and metastasize.14) However, many studies have shown cytotoxic LMP1: Hammerschmidt et al. found that cells-expressed LMP1 (a large amount) poisoned the cells.29) Nitta et al. also stated that the LMP1 poisoned cells and was related to inhibiting NF-κB activity and promoting apoptosis, which both were also in other cells, such as lymphoblasts, monocytes, and epithelial cells.30) Brocqueville et al. found that LMP1 in Madin-Darby canine kidney (MDCK) renal epithelial cells increased with the apoptosis.31) Therefore, our F3a affected the Raji cell NF-κB pathway by LMP1 (a large amount) because it reduced the cell p-IκB/IκB ratio and created the apoptosis with the nucleus without the intracellular NF-κB. Moreover, the ERK protein proliferated-cells were also observed. With the decreased p-ERK/ERK, the LMP1 could not phosphorylate ERK which decreased with the suppressed cell proliferation.
The 24 h F3a-treated Raji cells, the EBV lysis and latency-related genes were observed. The 12.5 µg/mL F3a promoted the BRLF1 mRNA by about 15-fold. Chang et al. pointed that the Rta protein in the EBV lytic stage activated LMP,32) so it was speculated that the F3a likely promoted the Rta protein by increasing BRLF1 mRNA before increasing the BNLF1 mRNA and the LMP1. Cerimele et al. pointed LMP1, a ROS inducer in EBV latent type III.18) Also in ours, the F3a-treated Raji cell ROS increased with increasing the F3a concentration. After 3.1 and 6.3 µg/mL F3a-treated, the intracellular ROS increased by 2.7 and 4 times, respectively. Many studies have also pointed that the accumulated cellular ROS directly activated JNK and JNK/p38 MAPK signaling mechanism through FasL and induced apoptosis.33) Therefore, the F3a promoted a large number of LMP1 and also greatly increased intracellular ROS, which triggered apoptosis.
The Polygonum cuspidatum ethylacetate subfraction containing emodin increased the Raji cell BRLF1 and BNLF1 mRNA relative expression, the latency-related LMP1 proteins, and the ROS expression, and decreased the p-IκBα/IκBα and p-ERK/ERK ratio. Resultantly, the cleaved caspase and PARP were produced, thereby inhibiting cell proliferation and causing apoptosis.
The Taiwan science and technology ministry, and Taiwan Liouying Chi Mei Medical Center-supported research grants, respectively, were: NSC100-2320-B-041-004-MY3 and MOST 103-2320-B-041-002; CLFHR10332 and CLFHR10408.
The authors declare no conflict of interest.