Notes
Effect of Dietary Fiber on the Level of Free Hypoglycemic Agents in Vitro
2022 年 45 巻 11 号 p. 1716-1719
詳細
2022 年 45 巻 11 号 p. 1716-1719
We studied the effect of dietary fibers (DFs) on the levels of free hypoglycemic agents in vitro, i.e., glimepiride and the biguanides buformin and metformin. The levels of free buformin and free metformin were not affected by mixtures of DFs, i.e., cellulose, chitosan, pectin (PE), and glucomannan (GM), in fluids of pH 1.2 and 6.8 (similar to the pH of the stomach and intestines, respectively). However, the free biguanide level was significantly reduced by mixing with PE or sodium alginate (AL), in water. The free glimepiride level was reduced in the mixture of AL, PE, and GM (in a solution with a pH of 6.8). The changes in aqueous AL solution pH seemed to reflect the free metformin levels. Therefore, the effects of DFs on free drug levels were dependent on drug type, hypoglycemic agent, and mixing solution. In this study, the oral regimen concentrations of the drug and DFs were used. Based on these results, it is important to consider the interactions between hypoglycemic agents and DFs.
In Japan, sulfonylureas, biguanides, alpha-glucosidase inhibitors, dipeptidyl peptidase-4 (DPP-4) inhibitors, and glucose cotransporter 2 inhibitors are the main oral hypoglycemic agents used to treat type 2 diabetes. The American Diabetes Association and European Association for the Study of Diabetes1) have recommended metformin, which is a biguanide, as the first-line treatment of type 2 diabetes since 2006. Bouchi et al.2) evaluated trends of first-line antidiabetic medication prescriptions in Japan, and reported that biguanides were the most commonly prescribed first-line medication for those aged of 20–39 years, and the second most commonly prescribed medication after DPP-4 inhibitors in all age groups.
Dietary fibers (DFs) have received increasing attention due to their potential health benefits, and are frequently added to dietary supplements. DFs reduce the risk of health problems such as obesity,3) hypertension,4) constipation,5) type 2 diabetes,5,6) and hyperlipidemia.5,7) Some DFs are used as food ingredients to achieve certain health benefits. In Japan, 34% of individuals who ingest health foods concomitantly take prescription drugs, 46% of which are for obesity, lifestyle-related diseases, and allergies.8) Although DFs have several beneficial health effects, they also decrease the bioavailability of certain minerals, nutrients, and drugs.5) Therefore, we evaluated the interactions between simultaneously used drugs and DF-rich supplements.
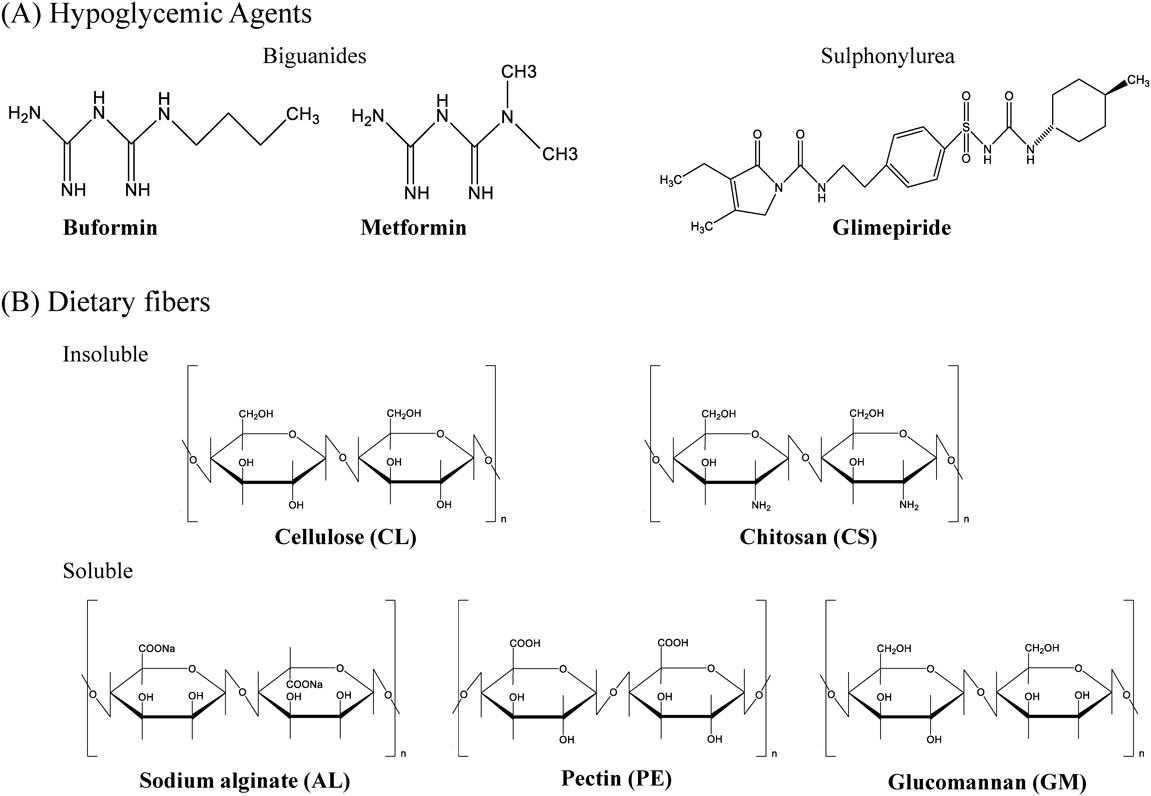
We explored the interactions between hypoglycemic agents and DFs by measuring free drug levels in mixtures of hypoglycemic drugs and DFs. The tested drugs included the water-soluble hypoglycemic agent metformin, buformin, and glimepiride. The tested DFs included cellulose (CL), chitosan (CS), pectin (PE), sodium alginate (AL), and glucomannan (GM) (Fig. 1).
Glimepiride was purchased from LKT Laboratories, Inc. (St. Paul, MN, U.S.A.), CL was purchased from Sigma-Aldrich (St. Louis, MO, U.S.A.), and buformin, metformin, CS 100, GM (from konjac), PE (from apples), and AL 80–120 were purchased from FUJIFILM Wako Pure Chemical Corporation (Osaka, Japan). The DFs used in this study were standardized polysaccharide preparations of ≤90% (wt%; GM) and ≤100% (wt%; all others) purity. The viscosities of the fluid of the 5 g/L CS and 10 g/L AL at 20 °C were 20–200 and 80–120 mPa‧S, respectively.
The Centricut Mini V-50 (molecular weight (MW): 50000) ultrafiltration membrane was purchased from Kurabo Industries, Ltd. (Osaka, Japan). The pH was measured using a compact pH meter (Twin pH; Horiba Ltd., Kyoto, Japan).
DFs and buformin or metformin were dissolved or suspended in the first (pH: 1.2; HCl/NaCl) or second (pH: 6.8; KH2PO4/NaOH) fluid; these fluids (or water) were used for disintegration tests performed according to the Japanese Pharmacopoeia Seventeenth Edition. Glimepiride was dissolved in a small volume of N,N-dimethylformamide and diluted with the second (pH: 6.8) fluid, because dilutions with the other solutions became turbid. The pH was measured for each solution of hypoglycemic agents, with or without the DF (1 : 1, v/v). The final concentrations of the DFs were as follows: 2.0% CL, 0.3% CS, 0.8% AL, 0.2% PE, and 0.5% GM. The final concentrations of the hypoglycemic agents were as follows: 3.02 mM metformin, 0.52 mM buformin, and 0.024 mM glimepiride. These concentrations were based on the recommended single doses of DFs and hypoglycemic agents in Japan. The solutions were incubated at 37 °C with shaking for 30 min. After incubation, the mixed solutions were centrifuged using the Centricut Mini V-50 device (3000 × g; 15 min). The solution was passed through the membrane and subjected to HPLC.
A Shimadzu HPLC system (LC-10AVP Solution System; Kyoto, Japan) operating at 35 °C was used, along with a column (Inertsil ODS-2, 150 × 4.6 mm i.d., S 5 µm) from GL Sciences, Inc. (Tokyo, Japan). The mobile phase for buformin and metformin was a mixture of 0.23 M sodium perchlorate: acetonitrile (7 : 1, v/v). And phosphate buffer (pH 7.0): acetonitrile: tetrahydrofuran (63 : 27 : 10, v/v) was used for glimepiride. The flow rate was set at 1.0 mL/min. Detection was performed at 233 nm for buformin and metformin, and 228 nm for glimepiride, using a UV detector.
CalculationsThe percentage of free drug was calculated using the following formula: free drug (%) = (peak area of filtrated solution/peak area of control) × 100.
The drug solution alone, instead of DF, was considered the control. Free drug was defined as the quantity of drug present in the solution that has passed through the membrane.
Statistical AnalysisAll experiments were carried out in triplicate. The regression analysis was performed using Microsoft™ Excel™ 2019.
The DFs had similar effects on the levels of free buformin (Fig. 2A) and metformin (Fig. 2B). In the first and the second fluids, the levels of free buformin and metformin exceeded 90% for each DF except AL. However, in water, the free drug level was the lowest in AL, and the free buformin and metformin levels were 14.3 and 24.5%, respectively. When biguanides were mixed with PE, the levels of free buformin and free metformin were 62.3 and 78.5%, respectively. When mixed with CS or GM, the free buformin and metformin levels exceeded 90%.

DFs and buformin or metformin were mixed in different fluids and incubated at 37 °C for 30 min. The columns represent mean ± standard deviation (S.D.) (n = 3).
The free glimepiride levels (Fig. 3) were 83.5 and 88.2% in solutions containing CL and CS, respectively. In comparison, the free glimepiride level was reduced by 51.9, 19.7, and 5.4% in solutions containing PE, AL, and GM, respectively.

DF and glimepiride were mixed in the second fluid (pH 6.8) and incubated at 37 °C for 30 min. Each column represents the mean with S.D. (n = 3–6).
The pH of the mixture of DF and buformin was comparable to that of metformin and DF (Table 1). The pH was higher for CS and AL (7.2–7.3), and lower for PE (3.2) and GM (5.8), compared to that of biguanide alone. The pH was lower than that of the DF-only solution after the addition of the drug. The pH remained unchanged after adding the drug and DF to the first (pH: 1.2) and second (pH: 6.8) fluids, i.e., the pH remained at 1.2 and 6.8, respectively (data not shown).
| Drug | DF | |||||
|---|---|---|---|---|---|---|
| None | CL | CS | AL | PE | GM | |
| None | 6.3 | 6.4 | 7.3 | 7.5 | 3.3 | 6.0 |
| Buformin | 6.5 | 6.1 | 7.2 | 7.3 | 3.2 | 5.8 |
| Metformin | 6.7 | 6.0 | 7.2 | 7.2 | 3.2 | 5.8 |
DF and buformin or metformin were mixed in water and incubated at 37 °C for 30 min.
The free metformin level (Fig. 4A) and the proportion of the ionic form (Fig. 4B) were graphed according to the AL concentration. The proportion of the ionic form was derived from the measured pH and the pKa of metformin. The free metformin level seemed to depend on the level of the ionic form (Fig. 4C).

The ratio was calculated using the pH of the mixture and the pKa of metformin (12.4).
In the present study, we found that certain DFs decreased the level of free hypoglycemic agents, and this decrease varied depending on the DFs, hypoglycemic agents, and solvents.
We studied water-soluble hypoglycemic agents, thus biguanides and glimepiride. In the first fluid (pH: 1.2), which had a similar pH to the stomach, the levels of free buformin and free metformin were not affected by the addition of DF. In the second fluid (pH: 6.8), which had a similar pH to the intestines, the free biguanide level was not affected by the addition of any DF except AL. Thus, in the stomach and intestines, the free biguanide level was not expected to be significantly altered by the presence of CL, CS, PE, or GM. In the glycine buffer (pH 1.2), the free drug levels were similar to those in the first fluid (data not shown), suggesting that the buffer composition was irrelevant. On the other hand, the free biguanide drug level was significantly reduced, by <80% and <30% by the addition of PE and AL to the water, respectively. Therefore, the addition of biguanide drugs to PE or AL in water may cause significant pharmacokinetic interactions that alter the free drug level. When the experiment was repeated using the same concentration (1 mM) of biguanides, the decrease in free biguanide level was similar between buformin and metformin (data not shown). This result suggests that the biguanide compound skeleton may be involved in the interactions with AL or PE. The levels of free biguanide and glimepiride did not vary during the 90-min incubation (data not shown), suggesting that the free drug levels fell immediately after mixing with DF, and that these reduced levels were maintained.
The pH of each mixture of buformin and metformin with DF in water was 7.2–7.3 for AL and 3.2 for PE. In the mixture, the charges on metformin (pKa: 12.4) and buformin (pKa1: 2.92; pKa2: 11.28) were estimated to be positive. We assumed that the lower free biguanide level after mixing with AL was due to the interaction of the positively charged biguanide drug and negatively charged AL; the negative charge on AL is caused by dissociation of the carboxyl group. The free biguanide level was decreased by mixing with PE, which had carboxyl groups, and was not affected by mixing with CL or GM (which did not have a negative charge). CS is positively charged due to its amino group and may not interact with biguanides. The AL-induced decrease in the free metformin level may reflect the proportion of the ionic form, suggesting that metformin dissociation is triggered by a slight increase in pH. The pH of the mixture of AL and biguanide was lower than that of DF alone, suggesting that the pH change affected DF and drug behaviors. At pH 6.8, the free biguanide level was low only in the AL system; thus, the pH probably explains the changes in the interaction between metformin and AL. Kay5) studied AL and PE, and reported that uronic acid groups affect the adsorption of minerals, such as iron and calcium. They explained that such interactions were due to the cation and anion exchange of DFs. These properties of DFs may influence the interaction with minerals and drugs, which can exist in ionic or molecular form depending on the solvent condition. Glimepiride was added to only the second fluid (pH 6.8) because it was soluble in only that fluid. The free glimepiride level decreased after mixing with AL, PE, or GM, although the pHs of the glimepiride solution and the mixture of glimepiride and DF remained at 6.8. This may indicate that the interactions between hypoglycemic agents and DFs vary by the drug type and are affected by factors other than the pH.
High viscosity is a characteristic of soluble DFs.5) Hashimoto et al.9) suggested that this viscosity may allow DFs to adsorb drugs, thereby affecting free drug levels. Naumann et al.10) showed that the viscosity of DF affected its interaction with bile acids. At neutral pH, the viscosity of GM is stable and only minimally affected by the salt concentration.11) We observed that the levels of free biguanide and glimepiride differed in a GM solution of pH 6.8. These differences may be attributable to the differences in drug concentrations. In this experiment, the oral preparation concentrations of drugs and DFs were used; at least in these ranges, CL and CS exert minimal effects on the levels of free hypoglycemic agents, unlike AL, PE, and GM. These results are similar to those obtained when an angiotensin II receptor blocker was mixed with CL and CS in water.12) We plan to further investigate how the viscosity, pH, drugs, and concentrations of drugs and DF modify the interactions between free drugs and dietary fiber.
In conclusion, DFs and hypoglycemic agents interacted to affect free drug levels in vitro. The interaction between AL and metformin may reflect a pH-induced decrease in the level of the ionic form of metformin. The free metformin level did not vary in the CS solution, although the pH of the mixture was almost the same as that of the AL mixture. Thus, the interactions between free drugs and DFs may be not only pH dependent but also affected by the DF type and concentration. Although the mechanisms by which the other DFs affect free drug levels are unclear, it is important to pay attention to the interaction between hypoglycemic agents and DFs. Our experiments suggest that if hypoglycemic agents, biguanides or glimepiride are taken with supplements rich in AL, a functionalized ingredient of food for specified health uses, free drug levels may decrease. The decrement in free drug level might indicate altered bioavailability, as well as pharmacological effects of the hypoglycemic agents. Therefore, we plan to conduct an in vivo study to evaluate the influence of DFs on the pharmacokinetics of hypoglycemic agents.
This work was supported by JSPS KAKENHI Grant No. JP19K11681. We thank M. Nakagawa for technical assistance.
The authors declare no conflict of interest.