Abstract
Inflammation is part of the pathophysiology of diabetic nephropathy (DN), and mast cells (MCs) appear to increase in number within the kidney of humans and animals with diabetes. Disodium cromoglycate (CG) not only inhibits the degranulation of MCs but also has several secondary effects that may improve inflammation. However, little is known about the effects of CG treatment on kidney collagen deposition and myofibroblast population in animals with type I diabetes (DM1). Data presented here suggest that the increases in the density and activity of MCs within the kidney in the early stages of DN contribute to tubulointerstitial collagen deposition, even in the absence of alterations in the renal myofibroblast population. Moreover, CG treatment showed renoprotective effects in rats with DM1, which appear to be linked to its mast cell stabilizing property and its ability to avoid some detrimental morphofunctional alterations.
INTRODUCTION
Disodium cromoglycate (CG) is known for its ability to inhibit the degranulation of mast cells (MCs).1) In addition to its classical effect on the activity of MCs, CG has been shown to reduce the migration and/or activation of immune cells, the expression of adhesion molecules, and the release of some inflammatory mediators.1) Inflammation is crucial to the onset and course of diabetic nephropathy (DN), and immune cells infiltrate renal tissue exposed to the hyperglycemic environment.2) In this respect, the number and activity of MCs were increased in the renal tissue of humans with DN,3,4) and more MCs were observed in the kidneys of rats with experimental diabetes than in the nondiabetic animals.5–8) Moreover, MCs have a fibrogenic role in animal models of kidney diseases,8–10) and they were linked to renal fibrosis in rats with type II diabetes.8)
Despite some data regarding the effects of CG on the renal tissue of rats with type I diabetes (DM1) having been reported,6) little is known about the repercussion of this treatment on kidney collagen deposition and myofibroblast population in animals with DM1. A myofibroblast is a fibroblast phenotype that expresses α-smooth muscle actin (α-SMA) related to extracellular matrix deposition in tubulointerstitial fibrosis.11) Moreover, myofibroblast differentiation and function can be regulated by MCs.12) Thus, we hypothesized that CG treatment can decrease renal type I and type III collagen deposition in the early stage of DN, and that this effect will be associated with decreases in the number and/or activity of MCs, as well as in the renal myofibroblast population. General morphofunctional parameters were also examined to better explore the potential use of CG in treating DN complications.
MATERIALS AND METHODS
AnimalsThis study was approved by the Ethics Committee on Animal Use of the Federal University of Uberlândia (protocol 073/18). Male Wistar rats (200–300 g) were kept in the animal housing facility in climatized chambers, at a temperature of 22 °C, and on a 12 h light–dark cycle.
DM1 Induction and Experimental GroupsDM1 was induced by intravenous administration (penile vein puncture) of alloxan (50 mg/kg) (Sigma-Aldrich, St. Louis, MO, U.S.A.). Capillary blood glucose was measured 24 h and 97 d after DM1 induction, using a glucometer (Accu Check Active, Roche, Basel, Switzerland). Animals with blood glucose greater than 200 mg/dL were considered diabetic. The animals were randomly distributed into four groups: 1) Control (C)–without DM1; 2) Diabetic (D)–DM1 treated with vehicle; 3) Disodium cromoglycate (CG)–without DM1 and treated with CG (50 mg/kg/d10); Sigma-Aldrich); 4) Diabetic treated with CG (DCG). CG treatment was started 7 d after diabetes induction (or its simulation) and was conducted for 95 d (until the end of the experiments). Diabetic animals were treated every other day with 1 IU of NPH insulin (Humulin N®, Eli Lilly and Company, IN, U.S.A.) to maintain hyperglycemic levels and avoid death.
After 90 d of CG treatment, animals were placed in metabolic cages for 24 h for urine collection and, later, blood collection for biochemical analysis. One day after the collection of biological material for laboratory tests, the systolic blood pressure (SBP) was measured for 4 consecutive days by tail-cuff plethysmography (PowerLab/LabChart 7 Pro; ADInstruments, Australia), and the average of the measurements was determined for each animal. Thus, after 95 d of CG treatment (i.e., 102 d after DM1 induction), rats were anesthetized with halothane (Cristália, Brazil), and their kidneys were removed for morphological analysis. Kidney weight to body weight (KW/BW) was also determined.
Functional StudiesCreatinine clearance (CCr) and urinary albumin excretion (UAE) were determined by colorimetry (Labtest Diagnostica, Brazil).
Histochemical and Immunohistochemical AnalysisHistological sections of 5 µm thickness were obtained from kidney embedded in paraffin and subjected to I) toluidine blue staining for identification of MCs, which are characterized by their purple color; II) Picrosirius red: a method used for demonstrating the presence of collagen fibers in the tissue (collagen types I and III). Picrosirius red-stained sections were also used to determine the areas of renal corpuscles and glomerular tufts. To verify the percentage of cortical collagen, sections were observed under a microscope equipped with a polarization filter. The determination of collagen deposition (in %) and the histomorphometric analyses were performed using Image J software (version 1.53).
Immunohistochemical analyses were conducted as we previously reported.10) Briefly, immunohistochemistry for α-SMA was assessed as the percentage of labeled glomerulus or renal cortex. A score from 0 to 4 was assigned: score 0 = 0–5% of the field scored; score 1 = 6–25%; score 2 = 26–50%; score 3 = 51–75%; and score 4 = 76–100%. The proliferating cell nuclear antigen (PCNA) reaction was analyzed by counting positive cells in each glomerulus or cortical interstitial grid field in all renal cortex samples, and the mean counts were calculated for each kidney.
Statistical AnalysisWhen appropriate, data are reported as mean ± standard error of the mean (S.E.M.) or median with 25th and 75th percentiles. Comparisons were made by one way-ANOVA, followed by the Tukey’s test in the case of normally distributed variables, or by the Kruskall–Wallis test with Dunn’s post-test for non-normally distributed variables. The data were statistically significant when p < 0.05.
RESULTS
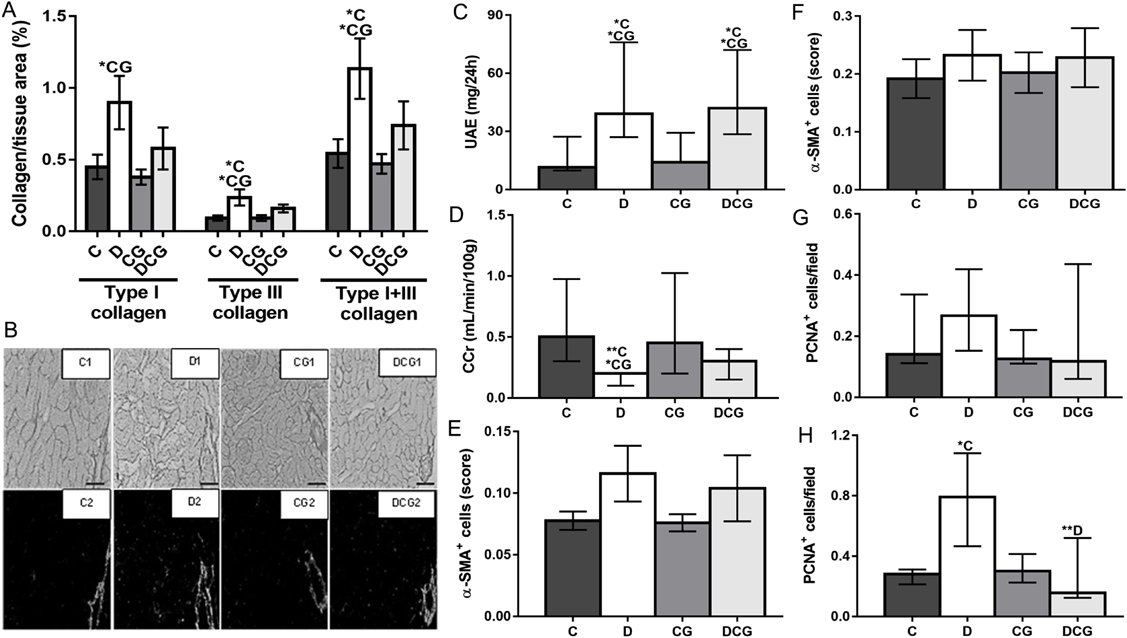
Alloxan administration induced hyperglycemia and weight loss, and increased both the urinary output (not shown) and the KW/BW ratio (Figs. 1A–C). All these alterations were partially prevented by CG treatment (Figs. 1A–C), excepted for urinary output, which was unchanged (not shown). The density of intact and degranulated MCs within the kidney of diabetic rats was increased, but this was partially prevented by CG treatment (Fig. 1D). The area of renal corpuscles and glomerular tufts was increased by diabetes, but this was partially prevented or avoided, respectively, by CG treatment (Figs. 1E, F). Diabetic animals showed increased cortical collagen (type III and the sum of type I and type III), which was partially decreased by CG treatment (Figs. 2A, B). UAE was increased by diabetes, and CG treatment did not alter this parameter (Fig. 2C). CCr was decreased by diabetes, and CG treatment partially altered this impairment in the renal function (Fig. 2D). Neither tubulointerstitial nor glomerular α-SMA expression was significantly changed by diabetes or CG treatment, despite a tendency to increase in the glomerulus of diabetic animals (Figs. 2E, F). Tubulointerstitial, but not glomerular, PCNA expression was increased by diabetes, and CG treatment avoided this alteration (Figs. 2G, H). Neither diabetes nor CG treatment altered SBP (C: 127.3 ± 5.1 mmHg; D: 115.1 ± 6.6 mmHg; CG: 129.9 ± 3.1 mmHg; DCG: 122.0 ± 7.3 mmHg; p > 0.05).
DISCUSSION
Alloxan is a diabetogenic drug that causes pancreatic beta-cell death13); indeed, it induced a DM1 state in rats, characterized by hyperglycemia, weight loss, polyuria (not shown), and polydipsia (not shown). The maximum toxic effect of alloxan appears to depend on MCs, as suggested by CG treatment. The contribution of MCs to the pancreatic toxicity of streptozotocin, another diabetic agent, has already been reported in the literature.14) Despite CG treatment reducing hyperglycemia, the blood glucose level was still extremely high (479.6 mg/dL, on average). Such a glycemic level has been proven sufficient to induce the kidney alterations described in the present study.7) Therefore, it is unlikely that any renal effect induced by CG is due to its action on the glycaemia.
The microalbuminuria and the absence of SBP alterations in rats treated with alloxan indicate that they were in an early stage of DN development, which was related to increases not only in the density and activity of MCs within the kidney but also to tubulointerstitial collagen deposition. MCs have anti-fibrotic and fibrogenic activities, and the latter appears to be expressed when tissue injury is chronic or repeated,15) as is the case during DN development. Whilst other effects cannot be ruled out, the observation that CG treatment reduced tubulointerstitial collagen deposition and the density and activity of MCs suggest that these cells indeed play a fibrogenic role in the early stages of kidney remodeling associated with DM1. Many MC mediators can stimulate the proliferation and activity of fibroblasts, as well as their differentiation to myofibroblasts (α-SMA expression).15) Moreover, despite some controversies concerning the time course of the appearance of myofibroblasts in the renal tissue of rats with DM1,16,17) myofibroblasts are considered to be the major cell type contributing to fibrosis in the diseased kidney.18) However, the renal α-SMA expression was not altered by either alloxan or CG treatments, suggesting that the initial increases in the kidney collagen deposition induced by DM1 in our experimental condition (102 d after induction) were due to rises in the activity and/or proliferation of fibroblasts and/or protomyofibroblasts (an immature myofibroblast phenotype that does not yet express α-SMA).19) In agreement with our observation concerning cortical collagen deposition and α-SMA expression in the kidney of diabetic rats, Young et al. reported an increased type IV glomerular collagen immunostaining in the absence of mesangial cell phenotype alteration (i.e., without rises in glomerular α-SMA expression), 30 d after DM1 induction.16) Also, MCs appear to partially modulate the alterations in collagen deposition observed in our study, and the effects of CG treatment in the renal PCNA expression support the motion that MCs could stimulate kidney fibroblast proliferation. It is important to mention that one study failed to find a correlation between the interstitial tryptase-positive MCs and glomerular and tubulointerstitial α-SMA expression in humans with immunoglobulin A (IgA) nephropathy.20) Since the appearance of myofibroblasts in the renal tissue of diabetic animals is time-dependent,21) their contribution to kidney collagen deposition in our experimental condition is presumed to happen in later phases of DN and cannot be ruled out.
Initial diabetic renal injury was also evidenced by the decreased CCr. Alteration in CCr is time-dependent and, despite a decrease in this parameter having been shown as early as 1 month after diabetes induction,22) hyperfiltration is reported by the most of the studies that have dealt with the initial stages of experimental diabetes.23–25) However, impairments in the CCr are expected as the disease progresses, and CCr was reduced 97 d after diabetic induction in the present study. This data not only corroborates our previous observation,7) but also agrees with that reported by Slaughter et al.,26) who found a reduced CCr 12 weeks after diabetes induction. It is worth highlighting that the time course of renal function alterations observed in experimental diabetes appears to depend on many factors, such as the animal strain and the glycemic level, among others.
The early stage of DN observed in the present study was also associated with kidney hypertrophy (i.e., increased KW/BW ratio) and glomerular hypertrophy (increases in the renal corpuscular and glomerular tuft area). It could be suggested that MCs take part in the renal and glomerular hypertrophy induced by diabetes, since CG treatment partially prevented or almost avoided these alterations, respectively. Nevertheless, work from our group has shown that aliskiren, a renin inhibitor, decreased the number and activity of MCs in the kidney of diabetic rats without consistently altering the area of both renal corpuscle and glomerular tuft.7) Therefore, the effects of CG, unrelated to its ability to prevent the degranulation of MCs, may account for its renoprotection concerning glomerular morphological changes. From the mechanistic point of view, CG appears to inhibit the release of some inflammatory mediators and to reduce immune cell migrations and or/activation1); these effects could explain the aforementioned renoprotective actions of CG. However, this important question is still to be resolved. Contrary to that reported,6) CG treatment did not reduce the incidence of proteinuria in diabetic rats, despite it partially preventing the detrimental impacts of diabetes in the CCr. Our results corroborate the suggestion made by Silva et al.20) concerning IgA nephropathy, that kidney MCs do not affect proteinuria but do result in increased serum creatinine levels. Thus, in the early stages of DN, MCs seem to contribute to alterations linked to CCr impairment, such as the renal hemodynamic imbalance, but they do not appear to participate in the events that lead to glomerular filtration barrier damage.
CONCLUSION
The increases in the density and activity of MCs within the kidney in the early stages of DN contribute to tubulointerstitial collagen deposition, even in the absence of alterations in renal α-SMA expression. CG treatment showed renoprotective effects in diabetic rats, which appears to be related not only to its MC stabilizing property but also to its ability to prevent some detrimental morphofunctional alterations.
Acknowledgments
We are grateful to the Rede de Biotérios de Roedores from Federal University of Uberlândia (REBIR/UFU). We also thank MSc. Vitor P. Couto Muniz for helping in the treatment of the animals.
This study was financed in part by the Coordenação de Aperfeiçoamento de Pessoal de Nível Superior-Brasil (CAPES)-Finance Code 001.
Conflict of Interest
The authors declare no conflict of interest.
REFERENCES
- 1) Sinniah A, Yazid S, Flower RJ. The anti-allergic cromones: past, present, and future. Front. Pharmacol., 8, 827 (2017).
- 2) Lim AK, Tesch GH. Inflammation in diabetic nephropathy. Mediators Inflamm., 2012, 146154 (2012).
- 3) Okoń K, Stachura J. Increased mast cell density in renal interstitium is correlated with relative interstitial volume, serum creatinine and urea especially in diabetic nephropathy but also in primary glomerulonephritis. Pol. J. Pathol., 58, 193–197 (2007).
- 4) Zheng JM, Yao GH, Cheng Z, Wang R, Liu ZH. Pathogenic role of mast cells in the development of diabetic nephropathy: a study of patients at different stages of the disease. Diabetologia, 55, 801–811 (2012).
- 5) Khurana H, Sharma S, Budhiraja RD. Effect of mast cell stabilizer, ketotifen on streptozotocin induced experimental diabetic nephropathy in rats. Int. J. Pharm. Sci. Res., 2, 2387–2393 (2011).
- 6) Medapati JR, Paparani MR, Budhiraja RD. The novel role of mast cell stabilizer in halting the development of nephropathy in diabetic rats: implication of resident renal mast cells, 22nd Int. Conference on Med. Biol. Pharmaceut. Sci., Singapore, 84–89 (2012).
- 7) de Morais RB, do Couto Muniz VP, Nunes Costa E, Filho SRF, Nakamura Hiraki KR, Bispo-da-Silva LB, Coelho Balbi AP. Mast cell population in the development of diabetic nephropathy: effects of renin angiotensin system inhibition. Biomed. Pharmacother., 107, 1115–1118 (2018).
- 8) Yin DD, Luo JH, Zhao ZY, Liao YJ, Li Y. Tranilast prevents renal interstitial fibrosis by blocking mast cell infiltration in a rat model of diabetic kidney disease. Mol. Med. Rep., 17, 7356–7364 (2018).
- 9) Summers SA, Gan PY, Dewage L, Ma FT, Ooi JD, O’Sullivan KM, Nikolic-Paterson DJ, Kitching AR, Holdsworth SR. Mast cell activation and degranulation promotes renal fibrosis in experimental unilateral ureteric obstruction. Kidney Int., 82, 676–685 (2012).
- 10) Oliveira-Silva GL, Morais IBM, Fortunato-Silva J, Alvarez MMP, França-Silva N, Galo JA, Hiraki KRN, Balbi APC, Bispo-da-Silva LB. Testosterone and mast cell interactions in the development of kidney fibrosis after unilateral ureteral obstruction in rats. Biol. Pharm. Bull., 41, 1164–1169 (2018).
- 11) Strutz F, Zeisberg M. Renal fibroblasts and myofibroblasts in chronic kidney disease. J. Am. Soc. Nephrol., 17, 2992–2998 (2006).
- 12) Gailit J, Marchese MJ, Kew RR, Gruber BL. The differentiation and function of myofibroblasts is regulated by mast cell mediators. J. Invest. Dermatol., 117, 1113–1119 (2001).
- 13) Lenzen S. The mechanisms of alloxan-and streptozotocin-induced diabetes. Diabetologia, 51, 216–226 (2008).
- 14) Martin S, Kolb-Bachofen V, Kiesel U, Kolb H. Pathogenesis of low dose streptozotocin induced diabetes in mice: requirement for alpha 1-adrenoceptor activation and vasoactive amine release. Diabetologia, 32, 140–142 (1989).
- 15) Bradding P, Pejler G. The controversial role of mast cells in fibrosis. Immunol. Rev., 282, 198–231 (2018).
- 16) Young BA, Johnson RJ, Alpers CE, Eng E, Gordon K, Floege J, Couser WG, Seidel K. Cellular events in the evolution of experimental diabetic nephropathy. Kidney Int., 47, 935–944 (1995).
- 17) Li H, Zhang Z, Wen HL, Ruan Y. Expression of alpha-smooth muscle actin in kidney of diabetic rats. Zhejiang Da Xue Xue Bao Yi Xue Ban, 34, 152–156 (2005).
- 18) Yuan Q, Tan RJ, Liu Y. Myofibroblast in kidney fibrosis: origin, activation, and regulation. Adv. Exp. Med. Biol., 1165, 253–283 (2019).
- 19) Falke LL, Gholizadeh S, Goldschmeding R, Kok RJ, Nguyen TQ. Diverse origins of the myofibroblast—implications for kidney fibrosis. Nat. Rev. Nephrol., 11, 233–244 (2015).
- 20) Silva GE, Costa RS, Ravinal RC, dos Reis MA, Dantas M, Coimbra TM. Mast cells, TGF-beta1 and alpha-SMA expression in IgA nephropathy. Dis. Markers, 24, 181–190 (2008).
- 21) Makino H, Kashihara N, Sugiyama H, Kanao K, Sekikawa T, Okamoto K, Maeshima Y, Ota Z, Nagai R. Phenotypic modulation of the mesangium reflected by contractile proteins in diabetes. Diabetes, 45, 488–495 (1996).
- 22) Kaikini AA, Dhodi D, Muke S, Peshattiwar V, Bagle S, Korde A, Sarnaik J, Kadwad V, Sachdev S, Sathaye S. Standardization of type 1 and type 2 diabetic nephropathy models in rats: assessment and characterization of metabolic features and renal injury. J. Pharm. Bioallied Sci., 12, 295–307 (2020).
- 23) Persson P, Fasching A, Teerlink T, Hansell P, Palm F. L-Citrulline, but not L-arginine, prevents diabetes mellitus-induced glomerular hyperfiltration and proteinuria in rat. Hypertension, 64, 323–329 (2014).
- 24) Al-Qattan KK, Thomson M, Jayasree D, Ali M. Garlic attenuates plasma and kidney ACE-1 and AngII modulations in early streptozotocin-induced diabetic rats: renal clearance and blood pressure implications. Evid. Based Complement. Alternat. Med., 2016, 8142394 (2016).
- 25) Malatiali S, Francis I, Barac-Nieto M. Insulin prevents hyperfiltration and proteinuria but not glomerular hypertrophy and increases mesangial matrix expansion in diabetic rats. Med. Princ. Pract., 26, 78–83 (2017).
- 26) Slaughter TN, Paige A, Spires D, Kojima N, Kyle PB, Garrett MR, Roman RJ, Williams JM. Characterization of the development of renal injury in Type-1 diabetic Dahl salt-sensitive rats. Am. J. Physiol. Regul. Integr. Comp. Physiol., 305, R727–R734 (2013).