Abstract
Lung cancer is the leading cause of cancer-related deaths worldwide. Troglitazone (TGZ), a peroxisome proliferator-activated receptor gamma (PPARγ) ligand, is a potential antitumor agent. However, the action mechanism of TGZ in lung adenocarcinoma cells has not been completely elucidated. To assess this mechanism and the anticancer effects of TGZ in human lung adenocarcinoma cell lines (A549 and H1975), we investigated the involvement of PPARγ, apoptosis, the mitogen-activated protein kinase (MAPK) pathway, protein kinase B (Akt)/mammalian target of rapamycin (mTOR) pathway, and autophagy. Cell viability was measured using fluorescence-based assays. Apoptotic cells were detected by Hoechst 33342 and Annexin V-fluorescein isothiocyanate (FITC)/propidium iodide (PI) double staining; protein expression was detected by Western blotting. TGZ inhibited cell proliferation in a dose-dependent manner in both cell lines, and the effect was not suppressed by a PPARγ inhibitor. Additionally, TGZ increased apoptotic cell number and upregulated p38 and c-Jun N-terminal kinase (JNK) phosphorylation; however, p38 and JNK inhibitors did not block TGZ-mediated inhibition of cell proliferation in either cell line. TGZ also upregulated extracellular signal-regulated kinase 1/2 (ERK1/2) phosphorylation, whereas an ERK1/2 inhibitor enhanced TGZ-mediated cytotoxicity in A549 cells. Additionally, TGZ increased LC3-II expression, and chloroquine (an autophagy inhibitor) attenuated TGZ-mediated inhibition of cell proliferation. These findings suggest that TGZ-induced inhibition of cell proliferation is PPARγ independent. TGZ-mediated inhibition of cell proliferation was accompanied by apoptosis and independent of the MAPK signaling pathway. These results suggest that TGZ inhibits cell proliferation through autophagy-induced cytotoxicity. This study demonstrated that chemotherapy using TGZ may be effective for lung adenocarcinoma.
INTRODUCTION
Lung cancer is the leading cause of cancer-related deaths worldwide (18.4% of the total cancer-related deaths), and it has the highest incidence (11.6% of the total cases) among all types of cancer.1) The CONCORD-3 study, a large international survey that analyzed survival of 37.5 million patients with cancer from 71 countries and territories, reported a high 5-year survival rate in Japan (32.9%); however, it was <20% in most other countries.2)
Approximately 85% of all lung cancers are classified as non-small cell lung carcinoma (NSCLC). NSCLC is further categorized into squamous-cell carcinoma, adenocarcinoma, and large-cell carcinoma. Adenocarcinoma is the most common form of lung cancer, accounting for approximately 40% of cases.3) Surgery is the standard treatment for NSCLCs; however, patients with advanced cancers are frequently treated with platinum-based chemotherapy, in combination with radiotherapy.
In recent years, epidermal growth factor receptor-targeted agents, anaplastic lymphoma kinase-targeted drugs, and immune checkpoint inhibitors have improved outcomes for patients with NSCLCs. However, the efficacy of these drugs is not high, and they have serious side effects.4–6) Thus, novel strategies with more effective and safer chemotherapeutic agents are required for the treatment of lung adenocarcinoma.
Peroxisome proliferator-activated receptor gamma (PPARγ) is a member of the nuclear hormone receptor superfamily, which is actively involved in glucose and lipid metabolism and inflammation.7) PPARγ is expressed in various normal and cancer cells,8,9) including lung cancer cells.10) Several PPARγ ligands, such as ciglitazone, rosiglitazone, pioglitazone (PGZ), and troglitazone (TGZ) affect the proliferation, growth, and progression of different cancer cell lines; however, the precise roles of PPARγ within tumors remains unresolved.11,12) Some PPARγ ligands are known to have similar effects on lung cancer.13) In addition, anti-diabetic drugs targeting PPARγ ligands reduce the risk of lung cancer.13) Accordingly, TGZ administration may prove to be a new therapeutic strategy for lung adenocarcinoma.
TGZ-induced antitumor effects are mediated by PPARγ-dependent14) and -independent12) mechanisms, or both.15) Although it has been proposed that the effects of TGZ involve multiple mechanisms,12,15) the molecular mechanisms involved in lung adenocarcinoma cell lines are largely unknown.
Therefore, the objective of this study was to investigate the antitumor effects of TGZ in lung adenocarcinoma cell lines and examine the mechanisms involved in its actions, with respect to PPARγ dependency, apoptosis, the mitogen-activated protein kinase (MAPK) pathway, and autophagy.
MATERIALS AND METHODS
Chemicals and AntibodiesTGZ and PGZ were obtained from LKT Laboratories (St. Paul, MN, U.S.A.) and dissolved in dimethyl sulfoxide (Nacalai Tesque, Kyoto, Japan). GW9662 (a PPARγ inhibitor), SB202190 (a p38 inhibitor), SP600125 (a c-Jun N-terminal kinase (JNK) inhibitor), and chloroquine (CQ) were purchased from Sigma-Aldrich (St. Louis, MO, U.S.A.). T0070907 (a PPARγ inhibitor), U0126 (a MAPK/extracellular signal-regulated kinase (ERK) kinase (MEK) inhibitor) and 3-methyladenine (3-MA, an autophagy inhibitor) were purchased from Merck (Darmstadt, Germany). Rabbit anti-human antibodies against PPARγ (81B8, Product No. 2243), phospho-stress-activated protein kinase (SAPK)/JNK (Thr183/Tyr185, Product No. 4668), SAPK/JNK (Product No. 9252), phospho-p38 MAPK (Thr180/Tyr182, D3F9, Product No. 4511), p38 MAPK (D13E1, Product No. 8690), phospho-ERK1/2 (Thr202/Tyr204; D13.14.4E, Product No. 4370), ERK1/2 (p44,42 MAPK, 137F5, Product No. 4695), LC3A/B (D3U4C, Product No. 12741), phospho-Akt (Ser473, D9E, Product No. 4060), Akt (C67E7, Product No. 4691), phospho-mammalian target of rapamycin (mTOR) (Ser2448, D9C2, Product No. 5536), mTOR (7C10, Product No. 2983), and β-Actin (13E5, Product No. 4970) were purchased from Cell Signaling Technology (Danvers, MA, U.S.A.).
Cell CultureA549 and H1975 human lung adenocarcinoma cell lines were obtained from RIKEN BRC (RCB0098, Ibaraki, Japan) and Summit Pharmaceuticals International (CRL5908, Tokyo, Japan), respectively. The A549 cells were maintained in Dulbecco’s modified Eagle’s medium (DMEM) (Wako Pure Chemical Corporation, Osaka, Japan), and the H1975 cells were cultured in RPMI1640 (Nacalai Tesque). Both culture media were supplemented with 10% heat-inactivated fetal bovine serum (FBS, Invitrogen, Thermo Fisher Scientific, Carlsbad, CA, U.S.A.) and 50 U/mL penicillin-50 µg/mL streptomycin (Nacalai Tesque). The cells were sub-cultured every 3–4 d and incubated at 37 °C in a humidified atmosphere containing 95% air and 5% CO2.
Cell ViabilityCell viability was measured as previously described.16) Briefly, the cells (1 × 10⁴/well) were plated into 96-well plates (Asahi Glass, Tokyo, Japan) and incubated at 37 °C for 24 h. The cells were then exposed to TGZ in the presence or absence of inhibitors (except for 3-MA) for 24 h in an FBS-free medium. In a separate 3-MA combination test, the cells were pretreated with 3-MA for 1 h before adding TGZ and incubating for 24 h. A Cell Quanti-Blue™ (BioAssay Systems, Hayward, CA, U.S.A.) Cell Viability Assay Kit was used for this assay, and the fluorescence was measured using a CytoFluor® Series 4000 Fluorescence Multi-Well Plate Reader (PerSeptive Biosystems, Framingham, MA, U.S.A.) at an excitation/emission wavelength of 530/580 nm. The IC50 for each cell line was defined as the concentration of TGZ that causes an inhibition of 50% growth, and it was calculated using the sigmoid maximum inhibitory effect model. The calculated IC50 of TGZ was used for each cell line in the co-exposure experiments.
Detection of Chromatin Condensation by Fluorescence MicroscopyChromatin condensation was detected using a previously described method.16) Briefly, the cells were exposed to TGZ at the IC50 concentrations for each cell line. After 24 h, the cells were stained with 80 µg/mL of Hoechst 33342 (Dojindo Molecular Technologies, Kumamoto, Japan) and observed under UV excitation using a fluorescence microscope (VANOX; Olympus, Tokyo, Japan). The images were obtained at 20× magnification. In addition, >100 cells were counted in each experiment, and the percentage of all cells was calculated.
Annexin V-Fluorescein Isothiocyanate/Propidium Iodide (FITC/PI) Double Staining AssayCells were treated with TGZ at approximately IC50 for 24 h. After the treatment, in line with the instructions of the Annexin V-FITC apoptosis detection kit (Nacalai Tesque), the cells were pre-processed and stained using Annexin V-FITC/PI. The fluorescence intensity was analyzed using FACS Calibur HG™ (BD Biosciences, Franklin Lakes, NJ, U.S.A.).
Western Blot AnalysisThe Western blot analyses were performed as previously described.16) Briefly, the cells were seeded in a 100-mm dish at a density of 1.75 × 10⁶ for 24 h, and A549 and H1975 cells were treated with 37.5 and 15 µM TGZ, respectively, for another 24 h. The cells were then sonicated to prepare them for protein extraction. The amount of protein in each sample was quantified using the bicinchoninic acid assay. A total of 10 µg of protein (per lane) was loaded onto 12.5% sodium dodecyl sulfate-polyacrylamide gel electrophoresis (SDS-PAGE) gels and electrophoresed. The protein samples were then transferred to a polyvinylidene difluoride membrane (GE Healthcare, IL, U.S.A.) and blocked with Tris-buffered saline, 0.1% Tween® 20 containing 2% ECL Advance™ Blocking Agent (GE Healthcare) for 1 h. The blocked membranes were incubated with primary antibodies (1 : 10000 dilution) at 4 °C overnight. The membranes were then incubated with the secondary antibody (1 : 25000 dilution) for 1 h at 20 °C. Chemiluminescence was detected using the Amersham ECL Select™ Western blotting detection reagent (GE Healthcare). The protein expression levels were quantified using Image J 1.49 software (CA, U.S.A.).
Statistical AnalysesThe statistical analyses were performed using the Student’s or Welch’s t-tests for comparisons of two groups and the non-repeated one-way ANOVA, followed by a Dunnett’s post-hoc test for multiple comparisons. The Student’s and Welch’s t-tests were performed using Microsoft Excel 97-2003; the ANOVA and Dunnett’s post-hoc test analyses were performed using GraphPad InStat Demo (GraphPad Software, CA, U.S.A.). A p value <0.05 was considered significant. The data are expressed as mean ± standard deviation.
RESULTS
Effects of TGZ and PGZ on Cell ViabilityTGZ inhibited proliferation in the A549 and H1975 cell lines in a dose-dependent manner; however, such effect was not observed with PGZ (Fig. 1). The TGZ IC50 values were 51.7 ± 0.54 and 21.4 ± 0.87 µM for the A549 and H1975 cells, respectively; in contrast, the IC50 values for PGZ for both cell lines were >100 µM.
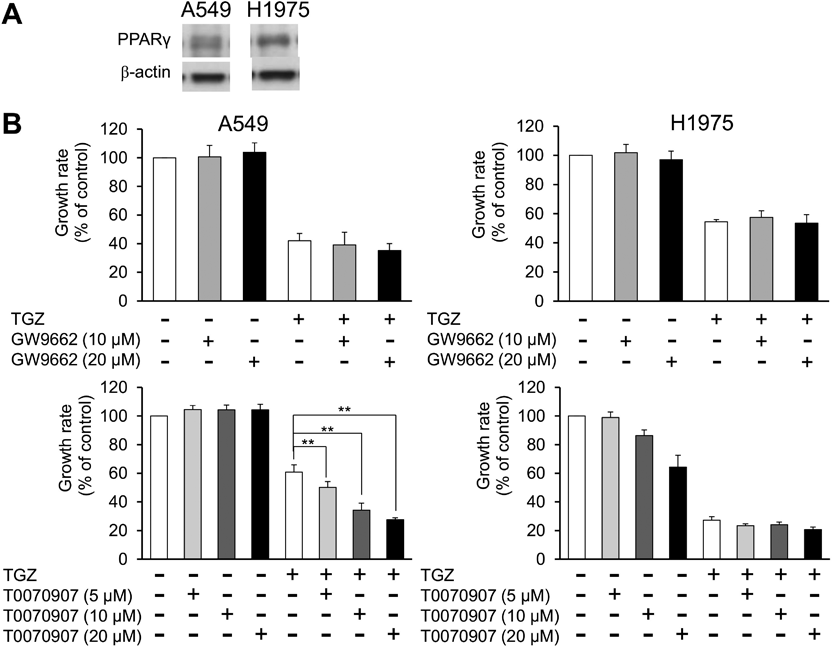
Involvement of PPARγ in the Inhibitory Effects of TGZ on Cell ProliferationPPARγ was expressed in A549 and H1975 cells (Fig. 2A). The effect of TGZ, in combination with GW9662 or T0070907 (PPARγ inhibitors), was examined to elucidate whether the stimulation of PPARγ by TGZ is involved in inhibition of cell proliferation. The viability of the TGZ-treated cells did not recover after co-treatment with either GW9662 or T0070907 (Fig. 2B), indicating that TGZ inhibits cell proliferation in a PPARγ-independent manner.
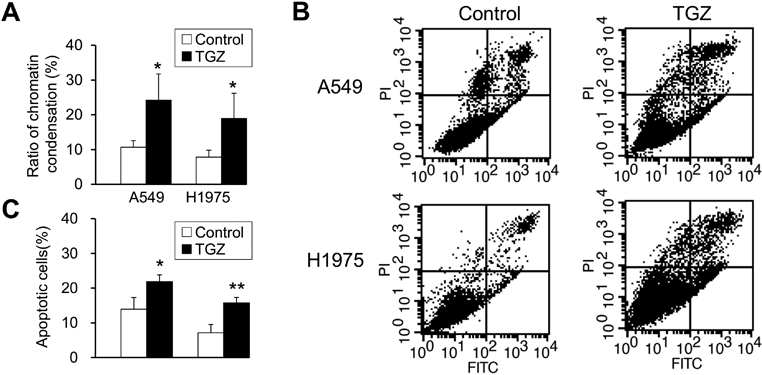
Involvement of Apoptosis in the Inhibitory Effects of TGZ on Cell ProliferationTo examine the effects of TGZ on nuclear morphology, we observed chromatin condensation after staining with Hoechst 33342 and identified apoptotic cells. TGZ significantly increased the percentage of cells with chromatin condensation from 11 to 24% in A549 cells and from 8 to 19% in H1975 cells (Fig. 3A). We also examined the percentage of apoptotic cells by Annexin V-FITC/PI double staining. TGZ significantly increased the percentage of apoptotic cells from 14 to 22% in A549 cells and from 7 to 16% in H1975 cells (Figs. 3B, C), indicating that TGZ inhibits cell proliferation through apoptosis.
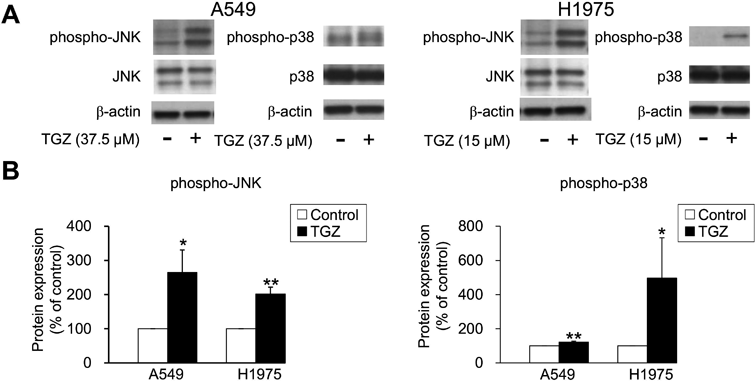
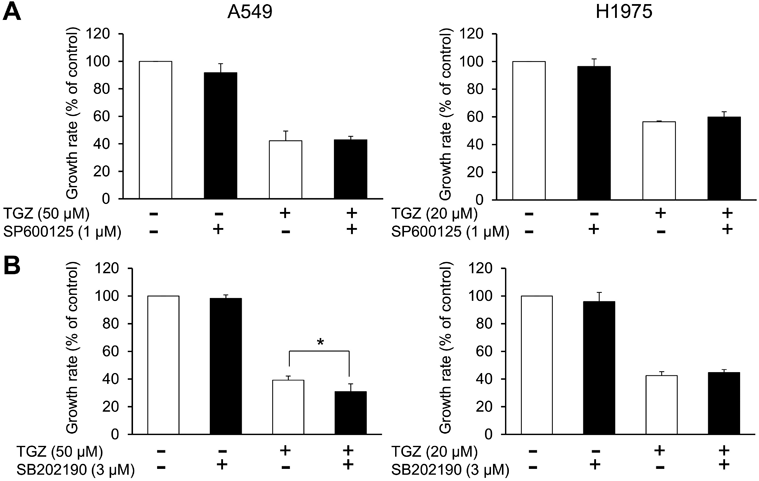
Involvement of MAPK Signaling in the Inhibitory Effects of TGZ on Cell ProliferationTo examine the involvement of the MAPK pathway, an intracellular signaling pathway that mediates cell proliferation, differentiation, and cell death, in the inhibition of cell proliferation by TGZ, we analyzed the expression patterns of JNK and p38, which are MAPK subfamily proteins that induce apoptosis. JNK and p38 phosphorylation was upregulated by TGZ in both A549 and H1975 cells (Fig. 4). In addition, we evaluated the effects of a combination of TGZ and JNK or p38 inhibitors. Cell viability was not rescued by the addition of SP600125 or SB202190 (Fig. 5).
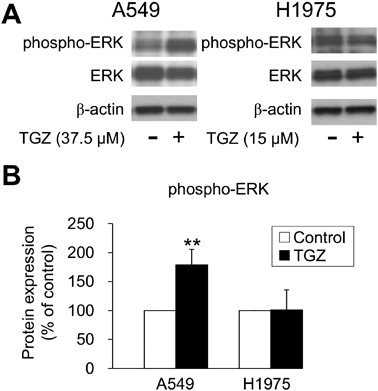
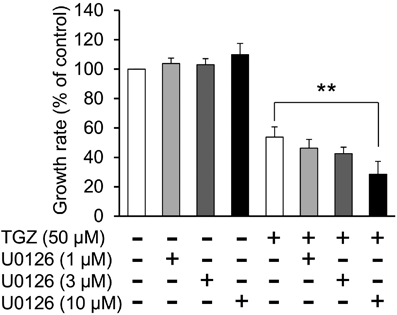
We also examined the expression of ERK1/2, another MAPK subfamily protein. TGZ upregulated ERK1/2 phosphorylation in A549 cells; however, it did not increase the levels of phospho-ERK1/2 in H1975 cells (Fig. 6). Furthermore, we investigated the effect of an ERK1/2 inhibitor on TGZ-mediated inhibition of proliferation of A549 cells. Co-exposure with U0126 (10 µM) significantly decreased the viability of the TGZ-treated A549 cells (p < 0.01, TGZ vs. TGZ + U0126) (Fig. 7). These results suggest that ERK1/2 may be upregulated by TGZ, although U0126 impeded cell proliferation via ERK1/2.
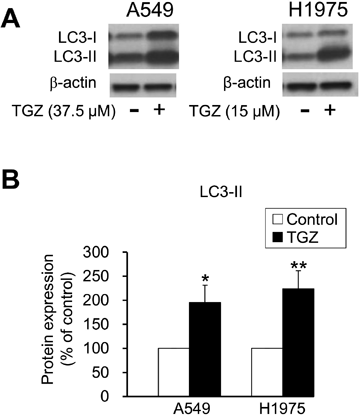
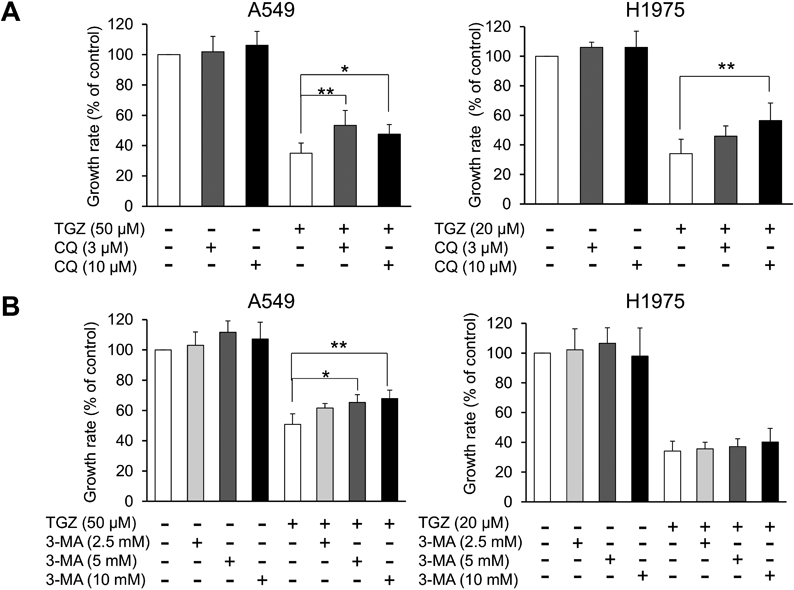
Involvement of Autophagy in the Inhibitory Effect of TGZ on Cell ProliferationTo evaluate the effect of TGZ on autophagy, we analyzed the expression of LC3, which is widely used as a reliable autophagy marker.17,18) The conversion of LC3-I to LC3-II is an indicator of autophagic activity, and TGZ considerably increased LC3-II expression in both A549 and the H1975 cells (Fig. 8). Figure 9A shows the effect of CQ, an autophagy inhibitor, on TGZ-mediated inhibition of cell proliferation. A significant increase in cell viability was observed in the TGZ-treated A549 and H1975 cells co-treated with CQ (p < 0.01; TGZ vs. TGZ + CQ). Another autophagy inhibitor, 3-MA, significantly recovered the viability of A549 cells (p < 0.01; TGZ vs. TGZ + 3-MA). However, it did not attenuate TGZ-mediated inhibition of proliferation of H1975 cells (Fig. 9B).
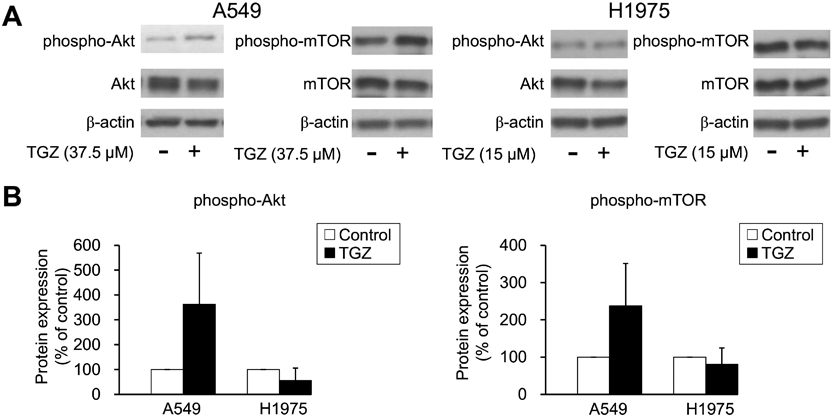
Involvement of the Akt/mTOR Pathway in the Inhibitory Effects of TGZ on Cell ProliferationTo investigate whether the Akt/mTOR pathway is involved in TGZ-mediated inhibition of cell proliferation, we examined the expression level of Akt and mTOR proteins. TGZ did not decrease the phosphorylation of Akt and mTOR in both A549 and H1975 cells (Fig. 10). These findings suggest that the Akt/mTOR pathway is not involved in the suppression of cell proliferation by TGZ.
DISCUSSION
Lung cancer is the most common cancer worldwide,1) and adenocarcinoma accounts for 40% of all lung cancers.3) There is a need for the development of new lung cancer treatments. New drugs are being tested frequently, albeit with insufficient outcomes thus far. However, PPARγ agonists have been reported to regulate the proliferation, growth, and progression of different cancer cell lines.12) In the present study, we analyzed the anticancer effects of TGZ and investigated its mechanism of action in lung adenocarcinoma cell lines.
The antiproliferative effect of TGZ was than that of PGZ in lung adenocarcinoma cells, with an IC50 value ranging from 21 to 52 µM. TGZ also exhibited dose-dependent inhibition of A549 and H1975 cell proliferation (Fig. 1). Studies have reported that TGZ has a higher antitumor effect than other thiazolidinediones,19–21) suggesting that it could be a novel anticancer drug candidate.
In this study, the involvement of PPARγ in the antiproliferative effect of TGZ was evaluated using GW9662, a PPARγ antagonist. We first confirmed PPARγ expression in A549 and H1975 cells (Fig. 2A), and Srivastava et al. reported that PPARγ is highly expressed in lung cancer cells.10) Furthermore, TGZ induces PPARγ expression in lung adenocarcinoma cells.22) However, GW9662 and T0070907 did not block cell proliferation inhibition by TGZ (Fig. 2B), suggesting that the antiproliferative activity of TGZ is PPARγ-independent.
As discussed in a previous study,16) the antitumor mechanisms of TGZ remain unclear, and several studies have reported PPARγ dependence or independence. The antitumor effect of TGZ is mediated in a PPARγ-dependent or independent manner, or both, in several cancers.12,14,15) For example, the antiproliferative effect of TGZ has been reported to be PPARγ-dependent in the lung adenocarcinoma cell lines NCI-H2323) and A549.24) These results are not consistent with our findings, and the PPARγ dependence may differ based on the cell type and culture conditions. Keshamouni et al. reported that TGZ induces growth suppression concomitant with PPARγ transcriptional activation in A549 cells, and therefore, its effect is PPARγ-dependent.24) However, the activation of PPARγ by TGZ may not be involved in the inhibition of cell proliferation. Further studies are warranted in this regard.
Although PPARγ is activated by TGZ, the PPARγ-dependence of TGZ-mediated suppression of cell proliferation might vary with the cell type; however, signaling may be independent of TGZ-mediated suppression of proliferation of A549 cells. Even though TGZ has an affinity for the human PPARγ receptor similar to PGZ, with an EC50 of approximately 0.55 µM,25) TGZ demonstrates a higher inhibition of cell proliferation than PGZ (Fig. 1). Thus, we conclude that TGZ-mediated inhibition of cell proliferation is PPARγ-independent in A549 and H1975 lung adenocarcinoma cells.
Here, the TGZ-mediated inhibition of cell proliferation was associated with chromatin condensation and percentage of apoptotic cells, as determined by Annexin V-FITC/PI double staining in A549 and H1975 cells (Fig. 3), suggesting that TGZ inhibits cell proliferation by inducing apoptosis. Despite treatment with concentrations approximately equal to IC50 (Fig. 1), the increase in chromatin condensation rate and percentage of apoptotic cells was small. Furthermore, the increase in the chromatin condensation rate in lung adenocarcinoma was lower than that observed in previous studies on renal and pancreatic cancers.16,26) Therefore, although TGZ inhibited cell proliferation via apoptosis, other forms of cell death, such as autophagy and necrosis, might be involved.
TGZ has been reported to upregulate, downregulate, or have no effect on the MAPK proteins JNK, p38, and ERK1/2 in cancer cells.27–30) In the present study, we investigated how TGZ affects the MAPK signaling pathway in lung carcinoma cells. We first examined whether JNK and p38, which mediate cell death signaling, are activated by TGZ. TGZ upregulated JNK and p38 phosphorylation in both A549 and H1975 cells (Fig. 4). Our previous studies confirmed that 1 µM SP600125 and 3 µM SB202190 completely block the phosphorylation of JNK16) and p38,26) respectively. However, they did not affect TGZ-mediated inhibition of cell proliferation, suggesting that while TGZ might be involved in JNK and p38 activation, their signaling is not related to TGZ-mediated inhibition of proliferation of A549 and H1975 cells (Fig. 5). Although ERK1/2 induces cell proliferation,31) TGZ caused activation of ERK1/2 in A549 cells (Fig. 6).
Interestingly, the combination of TGZ and U0126, the inhibitor of MEK upstream of ERK, U0126 strengthened the effect of TGZ in A549 cells (Fig. 7). This suggests that ERK1/2 may be activated to protect cells against TGZ-induced stress and U0126 blocks cell proliferation via ERK1/2. However, further studies are required to validate these findings.
Contrary to our results, some studies have demonstrated that TGZ inhibits cell proliferation by activating ERK1/2 in lung adenocarcinoma cells.23,24) ERK1/2 is activated by stresses such as oxidation and endoplasmic reticulum stresses,32) which could be caused by TGZ. Furthermore, TGZ induces apoptosis via a MAPK-independent pathway and activates ERK1/2 to protect against stress.33) Therefore, it is possible that ERK1/2 is not responsible for TGZ-mediated inhibition of cell proliferation, but rather is activated to protect against stress caused by TGZ, and the addition of U0126 blocks the proliferation of A549 cells via ERK1/2.
Autophagy has been reported to induce cell death, and various treatments for cancer, such as temsirolimus and everolimus, stimulate autophagy in cancer cells.34) Furthermore, TGZ has been demonstrated to induce autophagy.35–38) In the present study, TGZ upregulated LC3-II (an autophagy marker), and CQ attenuated TGZ-induced death in both cell lines (Figs. 8, 9A). Although 3-MA did not affect TGZ-mediated inhibition of proliferation of H1975 cells, it did recover the viability of the A549 cells, suggesting that autophagy is partially involved in TGZ-mediated inhibition of cell proliferation (Fig. 9B). Autophagy plays a complex role in cancer and appears to be involved in both promoting and suppressing tumor growth. Furthermore, its function appears to depend on certain conditions, such as the tumor type and nutritional status of cells.39,40) Excessive autophagy induction in cancer cells causes cell death40); thus, we propose that TGZ induces cell death by activating autophagy and exhibits antiproliferative effects in A549 cells.
In the present study, we demonstrated that TGZ induced apoptosis (Fig. 3) and autophagy (Figs. 8, 9). We used CQ and Z-VAD (a pan-caspase inhibitor) to simultaneously inhibit the apoptotic and autophagic pathways, but they did not affect cell viability (data not shown), suggesting that TGZ induced caspase-independent apoptosis.
We then evaluated the involvement of the Akt/mTOR pathway, which is associated with cell proliferation and autophagy. Although the inactivation of Akt and mTOR is known to promote autophagy, TGZ did not decrease Akt and mTOR phosphorylation (Fig. 10). This suggests that the Akt/mTOR pathway is not involved in TGZ-induced-autophagy.
Autophagy is mainly induced by starvation; however, it is also caused by a variety of stresses, such as energy stress, hypoxia, redox stress, and mitochondrial damage.41,42) Therefore, TGZ might induce a form of stress, which subsequently stimulates autophagy and cell death. It has been reported that autophagy is regulated by other pathways such as those involving death-associated protein kinase, BNIP3, and HSpin1,43) and these pathways might be involved in TGZ-induced autophagy.
Our results suggest that autophagy may contribute to the TGZ-induced antitumor effect in lung adenocarcinoma cells; however, the detailed mechanism remains unclear. Further research is required to determine the involvement of autophagy in TGZ-mediated inhibition of cell proliferation. However, it is unclear whether 3-MA affected the TGZ-mediated inhibition of proliferation of H1975 cells. Furthermore, 3-MA has been reported to both promote and inhibit autophagy44); therefore, the inhibitory effects of 3-MA on H1975 cells might change depending on the experimental conditions.
In conclusion, TGZ showed PPARγ-independent antiproliferation effect in two lung adenocarcinoma cell lines. TGZ inhibited cell proliferation, accompanied by chromatin condensation and TGZ-mediated inhibition of cell proliferation, and it was independent of the MAPK signaling pathway and may exhibit antiproliferation effects via autophagy. Therefore, although the detailed mechanisms of apoptosis and autophagy need to be examined further, our results show that TGZ may be effective in the treatment of lung adenocarcinoma.
Conflict of Interest
The authors declare no conflict of interest.
REFERENCES
- 1) Bray F, Ferlay J, Soerjomataram I, Siegel RL, Torre LA, Jemal A. Global cancer statistics 2018: GLOBOCAN estimates of incidence and mortality worldwide for 36 cancers in 185 countries. CA Cancer J. Clin., 68, 394–424 (2018).
- 2) Allemani C, Matsuda T, Di Carlo V, et al. Global surveillance of trends in cancer survival 2000-14 (CONCORD-3): analysis of individual records for 37 513 025 patients diagnosed with one of 18 cancers from 322 population-based registries in 71 countries. Lancet, 391, 1023–1075 (2018).
- 3) Denisenko TV, Budkevich IN, Zhivotovsky B. Cell death-based treatment of lung adenocarcinoma. Cell Death Dis., 9, 117 (2018).
- 4) Borghaei H, Paz-Ares L, Horn L, et al. Nivolumab versus docetaxel in advanced nonsquamous non-small-cell lung cancer. N. Engl. J. Med., 373, 1627–1639 (2015).
- 5) Solomon BJ, Mok T, Kim DW, Wu YL, Nakagawa K, Mekhail T, Felip E, Cappuzzo F, Paolini J, Usari T, Iyer S, Reisman A, Wilner KD, Tursi J, Blackhall F. First-line crizotinib versus chemotherapy in ALK-positive lung cancer. N. Engl. J. Med., 371, 2167–2177 (2014).
- 6) Zhou CC, Wu YL, Chen GY, et al. Erlotinib versus chemotherapy as first-line treatment for patients with advanced EGFR mutation-positive non-small-cell lung cancer (OPTIMAL, CTONG-0802): a multicentre, open-label, randomised, phase 3 study. Lancet Oncol., 12, 735–742 (2011).
- 7) de Carvalho MV, Goncalves-de-Albuquerque CF, Silva AR. PPAR gamma: from definition to molecular targets and therapy of lung diseases. Int. J. Mol. Sci., 22, 20 (2021).
- 8) Laganà AS, Vitale SG, Nigro A, Sofo V, Salmeri FM, Rossetti P, Rapisarda AMC, La Vignera S, Condorelli RA, Rizzo G, Buscema M. Pleiotropic actions of peroxisome proliferator-activated receptors (PPARs) in dysregulated metabolic homeostasis, inflammation and cancer: current evidence and future perspectives. Int. J. Mol. Sci., 17, 999 (2016).
- 9) Vallée A, Lecarpentier Y. Crosstalk between peroxisome proliferator-activated receptor gamma and the canonical WNT/beta-catenin pathway in chronic inflammation and oxidative stress during carcinogenesis. Front. Immunol., 9, 745 (2018).
- 10) Srivastava N, Kollipara RK, Singh DK, Sudderth J, Hu ZP, Nguyen H, Wang S, Humphries CG, Carstens R, Huffman KE, DeBerardinis RJ, Kittler R. Inhibition of cancer cell proliferation by PPAR gamma is mediated by a metabolic switch that increases reactive oxygen species levels. Cell Metab., 20, 650–661 (2014).
- 11) Gou Q, Gong X, Jin JH, Shi JJ, Hou YZ. Peroxisome proliferator-activated receptors (PPARs) are potential drug targets for cancer therapy. Oncotarget, 8, 60704–60709 (2017).
- 12) Fröhlich E, Wahl R. Chemotherapy and chemoprevention by thiazolidinediones. Biomed. Res. Int., 2015, 845340 (2015).
- 13) Youssef J, Badr M. Peroxisome proliferator-activated receptors and cancer: challenges and opportunities. Br. J. Pharmacol., 164, 68–82 (2011).
- 14) Copland JA, Marlow LA, Kurakata S, Fujiwara K, Wong AKC, Kreinest PA, Williams SF, Haugen BR, Klopper JP, Smallridge RC. Novel high-affinity PPAR gamma agonist alone and in combination with paclitaxel inhibits human anaplastic thyroid carcinoma tumor growth via p21(WAF1/CIP1). Oncogene, 25, 2304–2317 (2006).
- 15) Peters JM, Shah YM, Gonzalez FJ. The role of peroxisome proliferator-activated receptors in carcinogenesis and chemoprevention. Nat. Rev. Cancer, 12, 181–195 (2012).
- 16) Fujita M, Hasegawa A, Yamamori M, Okamura N. In vitro and in vivo cytotoxicity of troglitazone in pancreatic cancer. J. Exp. Clin. Cancer Res., 36, 91 (2017).
- 17) Kabeya Y, Mizushima N, Ueno T, Yamamoto A, Kirisako T, Noda T, Kominami E, Ohsumi Y, Yoshimori T. LC3, a mammalian homologue of yeast Apg8p, is localized in autophagosome membranes after processing. EMBO J., 19, 5720–5728 (2000).
- 18) Mizushima N, Yoshimori T, Levine B. Methods in mammalian autophagy research. Cell, 140, 313–326 (2010).
- 19) Al-Alem L, Southard RC, Kilgore MW, Curry TE. Specific thiazolidinediones inhibit ovarian cancer cell line proliferation and cause cell cycle arrest in a PPAR gamma independent manner. PLoS ONE, 6, e16179 (2011).
- 20) Haydon RC, Zhou L, Feng T, Breyer B, Cheng HW, Jiang W, Ishikawa A, Peabody T, Montag A, Simon MA, He TC. Nuclear receptor agonists as potential differentiation therapy agents for human osteosarcoma. Clin. Cancer Res., 8, 1288–1294 (2002).
- 21) Yoshizawa K, Cioca DP, Kawa S, Tanaka E, Kiyosawa K. Peroxisome proliferator-activated receptor gamma ligand troglitazone induces cell cycle arrest and apoptosis of hepatocellular carcinoma cell lines. Cancer, 95, 2243–2251 (2002).
- 22) Nazim UM, Moon JH, Lee YJ, Seol JW, Park SY. PPAR gamma activation by troglitazone enhances human lung cancer cells to TRAIL-induced apoptosis via autophagy flux. Oncotarget, 8, 26819–26831 (2017).
- 23) Li MY, Lee TW, Yim APC, Mok TSK, Chen GG. Apoptosis induced by troglitazone is both peroxisome proliferator-activated receptor-gamma- and ERK-dependent in human non-small lung cancer cells. J. Cell. Physiol., 209, 428–438 (2006).
- 24) Keshamouni VG, Reddy RC, Arenberg DA, Joel B, Thannickal VJ, Kalemkerian GP, Standiford TJ. Peroxisome proliferator-activated receptor-gamma activation inhibits tumor progression in non-small-cell lung cancer. Oncogene, 23, 100–108 (2004).
- 25) Willson TM, Brown PJ, Sternbach DD, Henke BR. The PPARs: from orphan receptors to drug discovery. J. Med. Chem., 43, 527–550 (2000).
- 26) Fujita M, Yagami T, Fujio M, Tohji C, Takase K, Yamamoto Y, Sawada K, Yamamori M, Okamura N. Cytotoxicity of troglitazone through PPAR gamma-independent pathway and p38 MAPK pathway in renal cell carcinoma. Cancer Lett., 312, 219–227 (2011).
- 27) Bae MA, Song BJ. Critical role of c-Jun N-terminal protein kinase activation in troglitazone-induced apoptosis of human HepG2 hepatoma cells. Mol. Pharmacol., 63, 401–408 (2003).
- 28) Bolden A, Bernard L, Jones D, Akinyeke T, Stewart LV. The PPAR gamma agonist troglitazone regulates Erk 1/2 phosphorylation via a PPAR gamma-independent, MEK-dependent pathway in human prostate cancer cells. PPAR Res., 2012, 929052 (2012).
- 29) Jung JY, Yoo CI, Kim HT, Kwon CH, Park JY, Kim YK. Role of mitogen-activated protein kinase (MAPK) in troglitazone-induced osteoblastic cell death. Toxicology, 234, 73–82 (2007).
- 30) Li MY, Lee TW, Mok TSK, Warner TD, Yim APC, Chen GG. Activation of peroxisome proliferator-activated receptor-gamma by troglitazone (TGZ) inhibits human lung cell growth. J. Cell. Biochem., 96, 760–774 (2005).
- 31) Wee P, Wang ZX. Epidermal growth factor receptor cell proliferation signaling pathways. Cancers, 9, 52 (2017).
- 32) Salaroglio IC, Mungo E, Gazzano E, Kopecka J, Riganti C. ERK is a pivotal player of chemo-immune-resistance in cancer. Int. J. Mol. Sci., 20, 2505 (2019).
- 33) Gouni-Berthold I, Berthold HK, Weber AA, Ko Y, Seul C, Vetter H, Sachinidis A. Troglitazone and rosiglitazone induce apoptosis of vascular smooth muscle cells through an extracellular signal-regulated kinase-independent pathway. Naunyn Schmiedebergs Arch. Pharmacol., 363, 215–221 (2001).
- 34) Singh SS, Vats S, Chia AYQ, Tan TZ, Deng S, Ong MS, Arfuso F, Yap CT, Goh BC, Sethi G, Huang RYJ, Shen HM, Manjithaya R, Kumar AP. Dual role of autophagy in hallmarks of cancer. Oncogene, 37, 1142–1158 (2018).
- 35) Yan JG, Yang HY, Wang G, Sun L, Zhou YG, Guo YL, Xi ZJ, Jiang XJ. Autophagy augmented by troglitazone is independent of EGFR transactivation and correlated with AMP-activated protein kinase signaling. Autophagy, 6, 67–73 (2010).
- 36) Zhou J, Zhang W, Liang B, Casimiro MC, Whitaker-Menezes D, Wang M, Lisanti MP, Lanza-Jacoby S, Pestell RG, Wang CG. PPAR gamma activation induces autophagy in breast cancer cells. Int. J. Biochem. Cell Biol., 41, 2334–2342 (2009).
- 37) Yan S, Yang X, Chen T, Xi Z, Jiang X. The PPAR gamma agonist Troglitazone induces autophagy, apoptosis and necroptosis in bladder cancer cells. Cancer Gene Ther., 21, 188–193 (2014).
- 38) Vitale G, Zappavigna S, Marra M, Dicitore A, Meschini S, Condello M, Arancia G, Castiglioni S, Maroni P, Bendinelli P, Piccoletti R, van Koetsveld PM, Cavagnini F, Budillon A, Abbruzzese A, Hofland LJ, Caraglia M. The PPAR-gamma agonist troglitazone antagonizes survival pathways induced by STAT-3 in recombinant interferon-beta treated pancreatic cancer cells. Biotechnol. Adv., 30, 169–184 (2012).
- 39) Amaravadi R, Kimmelman AC, White E. Recent insights into the function of autophagy in cancer. Genes Dev., 30, 1913–1930 (2016).
- 40) Yoshida GJ. Therapeutic strategies of drug repositioning targeting autophagy to induce cancer cell death: from pathophysiology to treatment. J. Hematol. Oncol., 10, 67 (2017).
- 41) Kroemer G, Marino G, Levine B. Autophagy and the integrated stress response. Mol. Cell, 40, 280–293 (2010).
- 42) Mizushima N. Autophagy: process and function. Genes Dev., 21, 2861–2873 (2007).
- 43) Gozuacik D, Kimchi A. Autophagy as a cell death and tumor suppressor mechanism. Oncogene, 23, 2891–2906 (2004).
- 44) Wu YT, Tan HL, Shui GH, Bauvy C, Huang Q, Wenk MR, Ong CN, Codogno P, Shen HM. Dual role of 3-methyladenine in modulation of autophagy via different temporal patterns of inhibition on class I and III phosphoinositide 3-kinase. J. Biol. Chem., 285, 10850–10861 (2010).