Abstract
Bioequivalence has been assessed using in vitro dissolution testing, such as in vivo predictive dissolution methodology. However, the assessment of bioequivalence should be performed carefully, considering the effect of the in vivo environment and according to the properties of the drug. The gastric emptying process is a key factor for the assessment of biopharmaceutics classification system class II (BCS class IIa) drugs with acidic properties since they cannot dissolve in the acidic stomach, but do dissolve in the small intestine (SI). The disintegration of a tablet in the stomach affects the distribution/dissolution in the SI due to the difference in the gastric emptying step, which in turn is a result of the varying formulation of the drugs. In this study, we used the reported dynamic pH change method and a novel gastric process simulation (GPS) model, which can compare the gastric emptying of particular-sized drug particles. The in vitro results were compared to clinical data using bioequivalent and bioinequivalent products of candesartan cilexetil. It was revealed that the dynamic pH change method was inappropriate, whereas the amount of filtered drug in GPS studies with 20 and 50 µm pore size filters could reflect the clinical results of all products. The evaluation of the gastric emptying process of drug particles less than 50 µm enabled us to assess the bioequivalence because they probably caused the difference in the distribution in the SI. This study demonstrated the utility of the GPS model for the assessment of bioequivalence of BCS class IIa drugs.
INTRODUCTION
Bioequivalence studies are generally performed to evaluate the therapeutic equivalence of oral formulations by comparing the rate and extent of drug availability in humans. Drug absorption from oral formulations is determined by in vivo dissolution and permeation in the gastrointestinal (GI) tract. Since bioequivalence and bioinequivalence between the reference and test formulations can be determined by the differences in in vivo dissolution, dissolution testing, such as the Biowaiver scheme, has been used to assure bioequivalence of formulations. However, a conventional dissolution test frequently fails to establish in vitro/in vivo correlation (IVIVC), especially for biopharmaceutics classification system (BCS) class II and IV drugs. This is because in vivo dissolution of oral formulations in the GI tract depends not only on the physicochemical parameters of a drug, such as surface area, diffusivity, and solubility, but also on physiological parameters such as pH, buffer capacity, bile salt, liquid volume, and gastric emptying.1–3) Therefore, the assessment of bioequivalence by in vitro dissolution tests should be performed carefully with a consideration of the influence of the in vivo environment on in vivo dissolution.
The BCS classifies drugs into four classes, based on their aqueous solubility and intestinal permeability, and takes into account major factors like dissolution, solubility, and intestinal permeability, which govern the rate and extent of drug absorption from solid oral dosage forms.4) In addition, the in vivo performance of BCS class II drugs, categorized by low solubility and high permeability, is highly dependent on their sub-classes (a (acidic), b (basic), and c (neutral)).5) BCS class IIa drugs cannot be dissolved in the stomach due to their low solubility; however, they are transferred to the small intestine (SI) and can be quickly dissolved and absorbed. Consequently, gastric emptying is important for understanding the in vivo dissolution of BCS class IIa drugs.
Candesartan cilexetil (CC), a BCS class IIa drug, has poor intrinsic aqueous solubility and high permeability (permeation coefficient, 2.2 ± 0.9 × 10⁻⁶ cm/s6) and log P 6.17)). CC is rapidly dissolved in the SI due to its solubility.3,7) It was reported that the oral bioavailability of candesartan after administration in the form of tablets and oral solution was 15 and 42%, respectively.8–10) It was also revealed that the administration of CC with larger substance particles resulted in a lower maximum plasma concentration (Cmax), indicating that dissolution rate should be an important factor in determining the in vivo behavior of CC.3) The administration of CC suspension was associated with a 17% increase in the Cmax relative to the tablet, whereas a small difference in the time to reach maximum plasma concentration (Tmax) was reported.11) These clinical studies clearly suggest that the disintegration of undissolved drug particles in the stomach would be a major determining factor for oral bioavailability of CC.
Recently, a flow-through cell (FTC) dissolution apparatus has been developed for the evaluation of gastric emptying and GI transit of drugs. Okumu et al. developed the FTC method with a dynamic pH change protocol, which could simulate in vivo environmental change along with GI transit of a drug product and establish IVIVC for a BCS class IIa drug.12) Furthermore, Paprskářová et al. explored the effect of gastric emptying time on dissolution and precipitation of BCS class IIb drugs using pH changing dissolution test with FTC.13)
In this study, we performed three tests, incorporating the gastric process, the reported FTC with dynamic pH change, and the novel gastric process simulation (GPS) model, for in vitro evaluation of bioequivalence of CC products. A GPS model based on FTC was developed to compare the gastric emptying of undissolved drug particles in the gastric process. Because the distribution/dissolution rate of undissolved drug particles in the SI after gastric emptying would depend on the particle size,14–17) the GPS studies were performed with five filters of different pore sizes connected to the FTC dissolution apparatus, and the optimal particle size for the assessment of bioequivalence of CC was evaluated. In the present study, clinical trial studies, including three bioequivalence studies of two bioequivalent and one bioinequivalent CC tablet, were shown. The fractions of dissolved and undissolved drugs in the updated fasted-state simulated intestinal fluid (FaSSIF-V2)18) after the gastric process of the GPS model were compared to the Cmax ratios obtained from clinical studies, and a model to predict the bioequivalence of CC was established.
MATERIALS AND METHODS
MaterialsBLOPRESS® 8 mg (R1) and UNISIA® combination tablets HD (R2) were used as references and purchased from Takeda Pharmaceutical Co., Ltd. (Osaka, Japan) (Table 1). Test products (single tablet, T1, T2; combination tablet, T3) were manufactured by Sawai Pharmaceutical Co., Ltd. (Osaka, Japan) (Table 1). All of them contained 8 mg CC, and R2 and T3 contained 5 mg amlodipine. CC and amlodipine were obtained from Sanyo Chemical Industrial, Ltd. (Osaka, Japan) and Hetero Drugs, Ltd. (Hyderabad, India), respectively. Sodium taurocholate (NaTC), hydrochloric acid (HCl), maleic acid, sodium dihydrogen phosphate dihydrate, sodium hydroxide (NaOH), sodium chloride (NaCl) and methanol (MeOH) were obtained from FUJIFILM Wako Pure Chemical Corporation (Osaka, Japan). Japanese Pharmacopoeia (JP) dissolution test fluid No. 1 (JP1 fluid) (pH 1.2), JP dissolution test fluid No. 2 (JP2 fluid) (pH 6.8), diluted McIlvaine buffer (pH 4.0), lecithin, and pepsin were obtained from Nacalai Tesque, Inc. (Kyoto, Japan). Tween 80 was obtained from Kanto Chemical Co., Inc. (Tokyo, Japan). Fasted-state simulated gastric fluid (FaSSGF) and FaSSIF-V2 were prepared in accordance with the reported method18); FaSSGF contained 80 µM NaTC, 20 µM lecithin, 0.1 mg/mL pepsin, 34.2 mM NaCl, and HCl adjusted to pH 2.0 and FaSSIF-V2 contained 3 mM NaTC, 0.2 mM lecithin, 19.12 mM maleic acid, 34.8 mM NaOH, and 68.62 mM NaCl adjusted to pH 6.5.
Table 1. The List of Reference and Test Products
| Product | Candesartan cilexetil (mg) | Amlodipine (mg) |
|---|
| R1: BLOPRESS® 8 mg | 8 | — |
| R2: UNISIA® combination tablets HD | 8 | 5 |
| T1: single tablet | 8 | — |
| T2: single tablet | 8 | — |
| T3: combination tablet | 8 | 5 |
R1 and R2 were purchased from Takeda Pharmaceutical Co., Ltd. (Osaka, Japan). T1, T2, and T3 were manufactured by Sawai Pharmaceutical Co., Ltd. (Osaka, Japan).
Bioequivalence studies in humans were carried out to verify the therapeutic equivalence between the test and reference products. These studies were designed as single-dose, randomized, two-way crossover studies, under fasted conditions. Pharmacokinetic parameters were calculated from the plasma concentration of candesartan measured by liquid chromatograph-tandem mass spectrometer (LC/MS/MS) because CC was hydrolyzed to candesartan during absorption.8) Cmax and area under the plasma concentration–time curve from 0 h to the last measured time (t) hours (AUC0–t), Tmax, and other pharmacokinetic parameters were analyzed using BESTS® software (CAC Croit Corp., Tokyo, Japan). The parameters of each product were logarithmically transformed, and the 90% confidence interval of the difference between their average values was calculated. The products were considered to be bioequivalent if the 90% confidence interval met the criteria of log (0.80) to log (1.25).19)
Institutional Review Board StatementThe clinical studies were conducted in accordance with the Declaration of Helsinki, and the protocol was approved by the Institutional Review Board corresponding to the study facility, namely Aiwa Clinic Clinical Trial Review Board (R1 vs. T1), Kyushu Clinical Pharmacology Clinic Clinical Trial Committee (R1 vs. T2), and Hakata Clinic Clinical Trial Committee (R2 vs. T3).
Informed Consent StatementInformed consent was obtained from all subjects involved in the clinical studies.
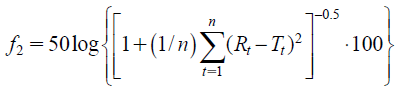
Dissolution Tests Using United States Pharmacopeia (USP) Apparatus 2The dissolution profiles of CC products were evaluated using the paddle method defined in JP.20) Briefly, dissolution tests were performed on each medium (900 mL per vessel) with the rotation speed of 50 rpm at 37.0 ± 0.5 °C. JP1 fluid (pH 1.2), JP2 fluid (pH 6.8) or diluted McIlvaine buffer (pH 4.0), and 0.1% Tween 80 were added to each medium as dissolution media. The samples were filtered through 0.45 µm filters (GL Sciences Inc., Tokyo, Japan), and the filtrate was assayed by HPLC as described in the HPLC analysis method below. Then, the dissolution similarity factor f2 was acquired following the formula below to evaluate the similarity of drug dissolution profiles between the samples19):
 | (1) |
where n is the number of time points, Rt is the dissolution value of the reference product at time t, and Tt is the dissolution value of the test product at time t.
FTC Dissolution Tests with Dynamic pH ChangesFTC dissolution tests with dynamic pH changes were performed to assess the dissolution along with in vivo pH change in the GI tract after oral administration, as previously described with modification.12) Dissolution tests were performed using the FTC apparatus with 22.6 mm cells (i.d.) (Sotax CE7 smart, Sotax AG, Aesch, Switzerland), a piston pump (Sotax CP7, Sotax AG, Aesch, Switzerland), and a 2.7 µm filter (GE Healthcare Japan, Ltd., Tokyo, Japan). The dissolution medium was pumped at a flow rate of 9 mL/min. The dissolution study was performed with three sequential estimated environments: the stomach, proximal duodenum, and SI. To assess dissolution profiles in the stomach, FaSSGF/water (1/3 (v/v)) containing 50 mL of gastric fluid21) mixed with 150 mL of dosing water, which were assumed a gastric environment, was pumped through the cells from 0 to 25 min until 200 mL of stomach fluid flowed. To assess the dissolution rate in the proximal duodenum, FaSSGF/FaSSIF-V2 (6/4 (v/v), pH 4–5) was pumped from 25 to 50 min. Finally, FaSSIF-V2 was made to flow from 50 to 75 min to assess the dissolution in the SI. Sequential sampling was performed every 5 min. Samples of 200 µL aliquots were mixed with 50 µL MeOH, and then, the mixtures were quantified by HPLC analysis as described in the HPLC analysis method below. Adjustments in the calculations were done to compensate for dilutions of the sampling solution, and the cumulative amount (mg) of drug collected at different time intervals was calculated. These values were then converted to percentage cumulative drug fractions, and the relevant profiles were constructed.
GPS Model ConditionsA diagram of the GPS model is shown in Fig. 1. The gastric process, disintegration, dissolution, and gastric emptying were simulated. Dissolution tests were performed using the FTC apparatus with 22.6 mm cells (i.d.) (Sotax CE7 smart, Sotax AG) and a piston pump (Sotax CP7, Sotax AG). The test conditions were as follows: FaSSGF/water (1/3 (v/v)) was pumped through the cells and sequential sampling was performed until 50 mL of gastric fluid21) plus 150 mL dosing water, which were assumed a gastric environment, flowed over 24 min at every 2 min interval. The GPS studies were performed with five different pore size filters (2.7 µm (GE Healthcare Japan), 11, 20 µm (Merck Millipore, Darmstadt, Germany), and 50 or 100 µm (Nippon Rikagaku Kikai Co., Ltd., Tokyo, Japan) filters) to compare the amount of filtrated drug as gastric emptied drug, dissolved drug, and undissolved small particles in filtrates. Samples (18 mL) were centrifuged for 10 min at 1972 × g. In order to assess the fraction of dissolved drug in the acid condition, 200 µL of the supernatant was added to 50 µL of MeOH and quantified. To assess the fraction of dissolved drug in FaSSIF-V2, 45 µL of 1 N NaOH and 18 mL of 2-folds concentration FaSSIF-V2 were added to 18 mL of collected samples, and the mixtures were shaken for 30 min at 37 °C at 150 rpm. The samples were centrifuged for 10 min at 1972 × g. The supernatant (200 µL) was diluted with 200 µL MeOH and quantified. Additionally, to assess the amount of filtered drug, eluted fractions were added to 10 mL of MeOH and mixed. Aliquots (200 µL) were diluted with 200 µL of MeOH and quantified. The CC concentration was determined by HPLC analysis as described in the HPLC analysis method below. Adjustments were made in the calculations for compensation as well as the section of FTC dissolution test.
HPLC Analytical MethodChromatographic analysis was performed on an integral system (Shimadzu Prominence series, Shimadzu, Kyoto, Japan). The peak signal of CC was observed using a Unison UK-C18 column (50 × 3 mm, 3 µm, Imtakt, Kyoto, Japan). The UV detector was set at a wavelength of 270 nm. Linear gradient elution with a flow rate of 1.0 mL/min was used. The column oven was maintained at 30 °C. The injection volume was 50 µL, and the analysis time was 3.8 min. A sodium dihydrogen phosphate dihydrate solution (50 mM, pH 2.5) was used as the mobile phase buffer.
RESULTS
Clinical TrialFigure 2 shows the plasma concentration-time profiles of candesartan when administered in a single dose of T1 or R1 (A), T2 or R1 (B) for a single tablet, and T3 or R2 (C) for the combination tablet. The plasma concentration of candesartan was determined because the CC was hydrolyzed to candesartan during absorption. Table 2 shows the geometric mean ratio (GMR) of Cmax and AUC0–t, and the 90% confidence interval of the ratio (T1 vs. R1, T2 vs. R1, and T3 vs. R2). On comparing the GMR of Cmax, T1 was 0.79, T2 was 0.98, and T3 was 1.11. The 90% confidence interval of Cmax of T1 was below the acceptable criteria range (< 0.80), and therefore, T1 was considered to be bioinequivalent to R1, whereas the 90% confidence interval of T2 and T3 was within this range. All products were bioequivalent with respect to AUC0–t. In addition, Tmax was 4–5 h, and the half-life was 8–10 h for all products. The average of Tmax for test products was higher than the reference in all clinical trials (4.1, 4.9, 4.7, 5.1, and 5.4 h for R1, T1, T2, R2, and T3, respectively). Several significant differences between the test and reference products were observed for Tmax (p = 0.0481, T1 vs. R1; p = 0.0213, T2 vs. R1; p = 0.3648, T3 vs. R2) and the elimination rate constant (p = 0.0062, T1 vs. R1; p = 0.6448, T2 vs. R1; p = 0.2921, T3 vs. R2).
Table 2. The Geometric Mean Ratio (GMR) of
Cmax and
AUC0–t of Test and Reference Products and the 90% Confidence Interval (
n = 28 for R1
vs. T1,
n = 20 for R1
vs. T2 and R2
vs. T3)
| Cmax | AUC0–t |
|---|
| Ratio | 90% confidence interval | Ratio | 90% confidence interval |
|---|
| T1/R1 | 0.79 | 0.72 | — | 0.86 | 0.87 | 0.81 | — | 0.93 |
| T2/R1 | 0.98 | 0.90 | — | 1.07 | 1.00 | 0.94 | — | 1.06 |
| T3/R2 | 1.11 | 1.00 | — | 1.24 | 1.06 | 0.98 | — | 1.15 |
The pharmacokinetic parameters were obtained from the data of plasma concentration–time profile of candesartan (Fig. 2). The T2/R1 data were obtained from previous articles of the clinical study of Sawai Pharmaceuticals.28,29)
Figure 3 shows the dissolution profiles of CC in 900 mL of buffered media at pH 1.2, 4.0, and 6.8, with 0.1% Tween 80 at 50 rpm. Without Tween 80, complete dissolution was not observed at any pH; thus, Tween 80 was added to all media. Almost 100% of the drug was dissolved within 45 min at pH 6.8 (Fig. 3C), whereas less than 25% of the drug was dissolved at pH 1.2 over 120 min (Fig. 3A). The dissolution similarity factor f2 met the criteria of similarity for the guideline for bioequivalence.19) The f2 values of T1 and T2 compared to R1 and T3 compared to R2 were 68.3, 84.8 and 77.8 at pH 1.2; 78.8, 62.2 and 80.4 at pH 4.0; and 64.8, 63.0, and 44.0 at pH 6.8, respectively. However, the correlation with Cmax in the clinical study (T1 < R1, T2 ≈ R1) was not observed during early dissolution within 40 min at pH 1.2 (Fig. 3A-a), and the dissolution profile at pH 4.0 (Fig. 3B-a) and pH 6.8 (Fig. 3C-a), while the correlation was observed between T3 and R2 (T3 > R2). Although the amount and rate of dissolution showed a drug property-dependent pattern, remarkable differences among the CC products were not seen with respect to the f2 values. Thus, the USP Apparatus 2 dissolution test was not found to be a discriminative methodology for the assessment of the bioequivalence of CC products.
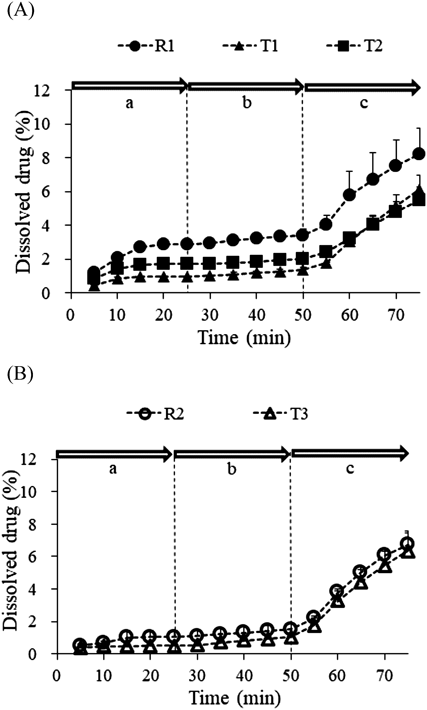
FTC Dissolution Tests with Dynamic pH ChangeFigure 4 shows the dissolved drug profiles in the FTC tests with dynamic pH changes. Because CC is a BCS class IIa drug, its solubility was improved at higher pH conditions. The amount of dissolved drug increased remarkably as the solution was changed to FaSSIF-V2, while the total amount of dissolved drug was less than 10% at the end of the FTC dissolution test. The different dissolution rates were determined according to the solubility in each condition. The fraction of dissolved drug in FaSSGF/dose water (1/3 (v/v)) seemed likely to correlate with Cmax for T1, T2, and R1 at earlier time points (Fig. 4A, area a; T1 < R1, T2 ≈ R1), but the relationship between R2 and T3 (Fig. 4B, area a; T3 < R2) was opposite to the clinical data. The dissolution rates in FaSSGF/FaSSIF-V2 and FaSSIF-V2 did not reflect differences in Cmax. The dissolution rate of T1 was higher than that of T2 when the medium was changed to FaSSIF-V2 (Fig. 4A, area c), which is consistent with the higher solubility of T1 in FaSSIF-V2 compared to T2 (2.47 and 1.92 µg/mL for T1 and T2, respectively). Therefore, the FTC dissolution tests with dynamic pH changes were not appropriate for evaluating the bioequivalence of the CC products.
GPS Dissolution StudiesTo estimate the undissolved drug particles in the gastric process, a GPS model based on the filtration under stomach conditions through different pore sizes was erected. Before the erection of the GPS model, preliminary experiments were conducted using FaSSGF to understand the dissolution of the drug in stomach conditions. The profiles of dissolved drug in FaSSGF/dose water (1/3 (v/v)) with 2.7 or 20 µm filters in the GPS studies were similar to those of FTC with dynamic pH change studies under the same conditions (data not shown). This indicated that under acidic conditions, the profiles of dissolved drug did not depend on filter size because of the low solubility, and the comparison of each filter size was not significant in detecting the difference in dissolution among CC products. Therefore, we did not conduct experiments using a larger filter under these conditions.
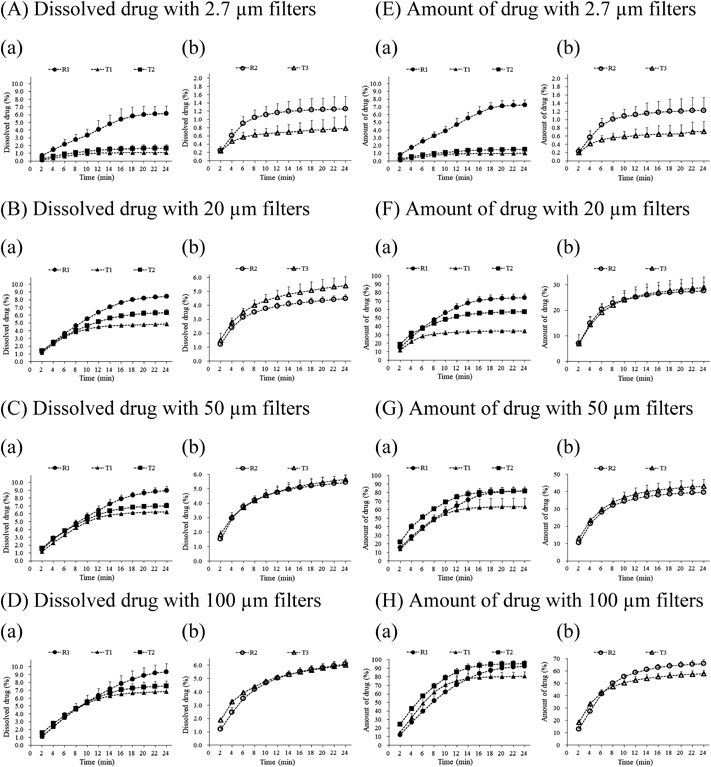
Next, as shown in Fig. 1, the fraction of dissolved drug in FaSSIF-V2 in the GPS model determined the dissolved drug in SI and the fraction of the amount of drug after filtration (including dissolved and undissolved drug) in the GPS model determined the transferred amount after gastric emptying. As per the concept of the GPS model, Figs. 5A–D show the fraction of dissolved drug in FaSSIF-V2 through various pore size filters with FTC under acidic conditions, and Figs. 5E–H show the profiles of amount of drug transferred when filtrated with 2.7 µm (A or E), 20 µm (B or F), 50 µm (C or G), and 100 µm (D or H) filters. The fraction of dissolved drug did not change regardless of filter pore sizes except when 2.7 µm filter was used; hence, it seemed to reach a plateau. On the other hand, the amount of filtrated drug increased as pore size increased, and the amount of drug filtrated from combination tablets (T3 and R2) tended to be lower than that from single tablets (T1, T2, and R1). This trend was observed in Cmax in clinical studies (Fig. 2), although each clinical study was conducted on different subjects. In this study, it was observed that larger drug particles of T3 and R2 accumulated at the bottom of the cell during the tests. With 20 and 50 µm filters, although a certain correlation was seen between the fraction of dissolved drug in FaSSIF-V2 as well as the amount of drug (Figs. 5B, C, F, G) and Cmax in the clinical studies for all products (Fig. 2), the differences between the products in the profiles were slightly different from the clinical studies results. In other words, depending on the conditions, T2 was lower than R1 (Figs. 5B, C, F) or T3 was almost the same as R2 (Figs. 5C, F), resulting in slightly different from the clinical studies. The results observed when using 20 µm filters were the same with those from 11 µm filters (data not shown). The profiles of the dissolved drug when 50 µm filters were used showed a smaller difference among products (Fig. 5C) compared to the results with 11 and 20 µm filters, and the amount of filtrated drug for T2 was closer to R1 (Fig. 5G-a).
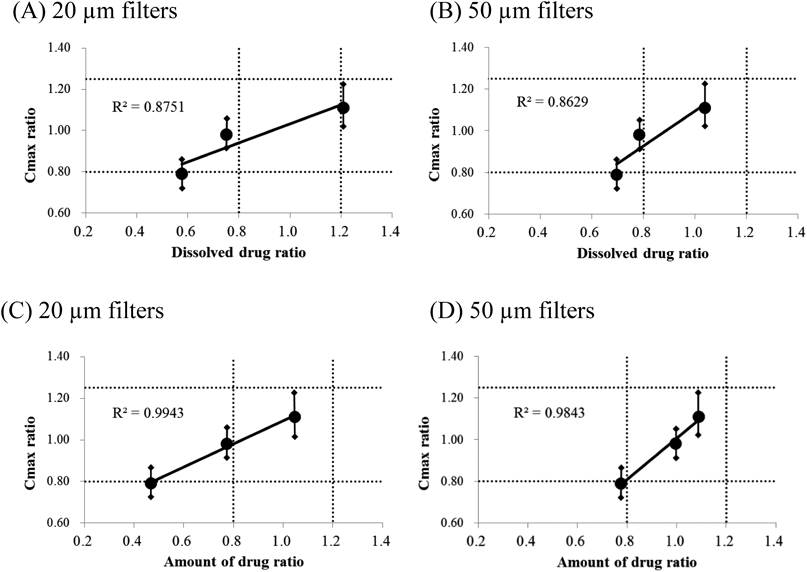
From the results shown in Fig. 5, the drug fraction ratio of the test product to the reference product at 24 min was calculated, and the drug fraction ratio of either the dissolved drug or filtrated drug amount was used for the analysis of correlation with Cmax ratio in a clinical study to evaluate the bioequivalence (Fig. 6). All plots, with the fraction ratio of dissolved drug in FaSSIF-V2 or amount of filtrated drug using 20 or 50 µm filters, showed good correlation (R2 = 0.86–0.99), and the amount of filtrated drug ratio was more correlated than the dissolved drug ratio in FaSSIF-V2 (0.8751 vs. 0.9943, 20 µm filters; 0.8629 vs. 0.9843, 50 µm filters). The fraction ratio of the amount of drug filtrated with 50 µm filters was closest to the clinical Cmax ratio (Fig. 6D). Furthermore, note that the fraction ratios of T1 to R1 for both dissolved drug and amount of drug filtrated with 20 and 50 µm were lower than 0.80 (Fig. 6, leftmost point), and enabled us to detect the bioinequivalence of T1. In contrast, with 2.7 and 100 µm filters, the profiles did not reflect Cmax, as several T3 and R2 profiles exhibited the opposite pattern, as shown in Fig. 5. With 2.7 µm filters, the profiles of dissolved drug in FaSSIF-V2 and the amount of drug filtrated with 2.7 µm filters were shown to be the same (Figs. 5A, E).
DISCUSSION
In this study, CC (a BCS class IIa drug) products were evaluated in USP 2 Apparatus dissolution studies (Fig. 3), but these studies were not able to detect differences in Cmax, bioequivalence, or bioinequivalence, in the clinical study (Fig. 2). Therefore, a novel method needs to be established, not only to predict the in vivo behavior of CC but also to consider the dissolution conditions based on the characteristics of CC. Since CC cannot dissolve in the acidic stomach but dissolves in SI, the disintegration of tablets in the stomach may affect the distribution/dissolution in the SI due to the difference in gastric emptying steps, depending on the formulation. In other words, the gastric process can be a key factor determining the bioequivalence of CC. To evaluate in vivo dissolution, incorporating the gastric process, we performed two dissolution studies with the FTC system with the dynamic pH change method reported previously12) and the GPS model that we developed in the current study. The former was performed to assess the effect of in vivo pH change along with gastric emptying, and the latter was used to assess the effect of the gastric emptying rate of drug particles in the stomach.
FTC with dynamic pH change was performed to simulate the GI transit of a drug product, and the dissolution in each part (the stomach, the proximal duodenum, and the SI) was observed (Fig. 4). Previously, IVIVC for a BCS class IIa drug, montelukast, was established in a similar test performed by Okumu et al.12) However, the results of the present study (Fig. 4) did not reflect the difference in Cmax in clinical studies (Fig. 2 and Table 2), although the initial dissolution rate in the acidic condition seemed to be correlated with Cmax among single-agent products. The dynamic pH change dissolution test proved to be inappropriate for the assessment of in vivo performance of CC. It can be speculated that the experimental settings of FTCs with dynamic pH changes do not consider the gastric emptying rate of drug particles in the stomach.
After oral administration, the CC product rapidly disintegrated and dispersed in the gastric fluid. Thereafter, it was expected that smaller particles in the stomach would be emptied faster and would provide a wide distribution and/or undergo fast dissolution in the SI. The importance of disintegration in the stomach for CC bioavailability was conceivable by the increase in Cmax after administration of the CC suspension.11) Therefore, a GPS model based on the FTC system illustrated in Fig. 1 was developed, and we compared filters with different pore sizes to consider the gastric emptying rate of drug particles in the stomach.
First, the profiles of dissolved drug in the acidic condition in GPS studies were observed to verify the effect of dissolution of drug in the stomach on the difference in Cmax in clinical studies. The same profiles were observed with 2.7 and 20 µm filters (data not shown). This is due to poor drug solubility in acidic conditions and because larger undissolved particles did not pass through the filter membrane. For this reason, we did not conduct experiments using a larger filter under these conditions. A correlation between the profiles of dissolved drug in the acidic condition in GPS studies and the clinical data suggested that the fraction of dissolved drug in the stomach did not contribute to the difference in Cmax. These results were in agreement with our hypothesis that undissolved drug particles in the stomach contribute to the difference in Cmax.
Then, the fraction of the amount of drug that passed through filters under acidic conditions and dissolved drug in FaSSIF-V2 among filtrated drug particles were investigated to understand the effect of the gastric emptying rate and the dissolution in the SI on the difference in Cmax (Fig. 5). The GPS study showed that the amount of filtrated drug increased with the increase in filter pore size (Figs. 5E–H). However, the dissolved drug in FaSSIF-V2 reached a plateau with the increase in filter pore size; therefore, the dissolved drug concentration might become saturated with 100 µm filters. In addition, the sink condition might be available in vivo because the dissolved fraction of CC would be absorbed rapidly in the SI due to the high permeability11,22); hence, the dissolution in vivo might be different from the present in vitro results. Furthermore, the observed lower profiles in combination tablets rather than single agent tablets (Fig. 5) might lead to the accumulation of combination tablets in the SI, probably resulting from the different formulation design. The accumulation needs to be prevented, although the clinical results also revealed a lower Cmax of combination tablets.
The correlation and decorrelation of drug fraction profiles in GPS studies with Cmax in clinical studies is shown in Fig. 6. Correlation was found with 11, 20, and 50 µm filters and decorrelation with 2.7 and 100 µm filters, depending on filter pore size. The sizes of 11 and 20 µm were equivalent to D50 (6–8 µm) and D90 (18–20 µm) of the drug substance, and a slight difference between D50 and D90 was observed. Good correlation of Cmax ratio in the clinical studies was observed with the fraction ratio of not only dissolved drug in FaSSIF-V2, but also the amount of drug filtrated with 20 and 50 µm filters. Since the 20 and 50 µm filters are close to the particle size of the drug substance and are sized for undissolved drugs to pass through smoothly, they might be the best reflection of in vivo behavior, which is the size distribution and gastric emptying rate of the excipient-containing particles in the suspension during the gastric process. The lower correlation with dissolved drug compared to the undissolved drug (Fig. 6, R2 value) might be due to an unsuitable composition of FaSSIF-V2; a recent report indicated that the surface tension of FaSSIF-V2 could be higher than that of fasted human intestinal fluids, and solubility could be underestimated in FaSSIF-V2.22) Since surface tension was decreased by the increase in NaTC/lecithin concentration,23) a denser concentration of bile components might be appropriate for investigating the in vivo dissolution of CC, which is sensitive to bile components.3) Moreover, 2.7 µm filters showed the same profiles of dissolved drug in FaSSIF-V2 and the amount of filtrated drug and decorrelation (Figs. 5A, E). We speculate that small particles less than 2.7 µm, which would be dissolved rapidly and completely after transit to the SI, would not be contributing to the difference in Cmax. Therefore, it appeared that not only the dissolved drug, but also the undissolved drug fraction in the SI, could contribute to the difference in Cmax.
Drug particles larger than 100 µm did not contribute to the difference in Cmax, as shown in Fig. 5. Particles with sizes of 100 µm would be small enough to be gastric emptied according to a previous report, and pellet formulations of a size less than 2 mm would be expected to be emptied from the stomach even during the digestive phase.24) Consistent with this, most/almost all of the drug was released along with the fluids in GPS with 100 µm filters as shown in Fig. 5. Therefore, we do not consider that the reduction of the gastric emptying rate was likely the cause of the decorrelation of larger sized particles of 100 µm with Cmax. One possibility of decorrelation is the reduction in the dissolution rate in the SI, because the larger particles of CC substance reduced the Cmax due to their slower dissolution rate.3) The second possibility of decorrelation of 100 µm with Cmax is the reduction in the distribution area according to the report of drifting into the unstirred water layer (UWL),25) and the bio-adhesive interaction at the intestinal lumen26) of micro-scale particles. The larger particles may be transferred through the SI without distribution, providing a reduction in the distribution area, resulting in no contribution to bioequivalence. The third possibility is that the higher expression of P-glycoprotein at the lower region of the SI27) may affect the absorption of CC, which is the substance of P-glycoprotein.6)
The clinical data of CC products partially imply that drug dissolution may occur at the intestinal juxta-membrane after drug particle size in the gastric process changes the distribution and dissolution in the SI. The dissolution of CC would be driven by the concentration gradient, which would be maintained around the intestinal membrane due to its rapid permeability.6,7) In addition, from the comparison of pharmacokinetics of tablet and solution formulations, the slow absorption of CC was expected to result from the dissolution step.8–10) In addition, Tmax in clinical studies was about 4–5 h (Fig. 2), which was slower than the reported intestinal transit times of about 3 h by Davis et al.24) Hence, drug particles would be dispersed widely in the intestinal tract when Cmax is reached. Therefore, the dissolution of CC seemed likely to occur after the distribution of drug particles in the intestinal membrane, and the distribution area of drug particles would be the key factor determining the bioequivalence.
Note that GPS studies using 20 and 50 µm filters showed that the bioinequivalent CC product was detectable by evaluating the fraction ratio of both dissolved and undissolved drugs in FaSSIF-V2, as shown in Fig. 6. The best prediction was obtained with the amount of drug of particle size less than 50 µm, which was larger than the drug substance size. In contrast to the previous report by Waterbeemd et al., the drug substance size of CC tablets affected Cmax in humans.3) In other words, the difference in particle size distribution of not only the drug substance, but also the drug substance containing the excipients in the suspension through the gastric process, may affect Cmax. This could be attributed to the difference between T1 and T2, which were made from the same drug substances. Hence, the difference of Cmax may have been caused by the step of the disintegration of oral formulations to small particles in the gastric process.
CONCLUSION
In this study, we developed a GPS model based on the FTC system as a tool for predicting the bioequivalence in clinical studies, which controlled the distribution of dissolved and undissolved drugs by using filters with different pore sizes to evaluate the gastric emptying rate of drug particles. It was suggested that the difference in disintegration to small particles less than 50 µm in the stomach would cause a difference in the distribution in the SI, leading to a difference in Cmax. It is possible that GPS could be useful for the assessment of other BCS class IIa drugs as an in vivo predictive tool using the FTC system. Further studies are required to validate and generalize the GPS model.
Acknowledgments
The authors are grateful to Sawai Pharmaceuticals for allowing to use the clinical study data.
Author Contributions
Naoki Zenda: Conceptualization, Investigation, Methodology, Data curation, Visualization, Writing—original draft, Writing—Review & Editing, Project administration. Tatsuaki Tagami: Writing—Review & Editing. Tetsuya Ozeki: Supervision.
Conflict of Interest
Tetsuya Ozeki received funding from Sawai Pharmaceuticals. The other authors declare no conflict of interest.
REFERENCES
- 1) Dressman JB, Amidon GL, Reppas C, Shah VP. Dissolution testing as a prognostic tool for oral drug absorption: immediate release dosage forms. Pharm. Res., 15, 11–22 (1998).
- 2) Takeuchi S, Tsume Y, Amidon GE, Amidon GL. Evaluation of a three compartment in vitro gastro intestinal simulator dissolution apparatus to predict in vivo dissolution. J Phrma Sci., 103, 3416–3422 (2014).
- 3) Waterbeemd H, Lennernas H, Artursson P. Drug bioavailability estimation of solubility, permeability, absorption and bioavailability. Wiley-VCH, Weinheim, pp. 495–531 (2003).
- 4) Amidon GL, Lennernäs H, Shah VP, Crison JR. A theoretical basis for a biopharmaceutic drug classification: the correlation of in vitro drug product dissolution and in vivo bioavailability. Pharm. Res., 12, 413–420 (1995).
- 5) Tsume Y, Mudie DM, Langguth P, Amidon GE, Amidon GL. The biopharmaceutics classification system: subclasses for in vivo predictive dissolution (IPD) methodology and IVIVC. Eur. J. Pharm. Sci., 57, 152–163 (2014).
- 6) Zhou L, Chen X, Gu Y, Liang J. Transport characteristics of candesartan in human intestinal Caco-2 cell line. Biopharm. Drug Dispos., 30, 259–264 (2009).
- 7) Schwebel HJ, van Hoogevest P, Leigh ML, Kuentz M. The apparent solubilizing capacity of simulated intestinal fluids for poorly water-soluble drugs. Pharm. Dev. Technol., 16, 278–286 (2011).
- 8) McClellan KJ, Goa KL. Candesartan cilexetil: a review of its use in essential hypertension. Drugs, 56, 847–869 (1998).
- 9) van Lier JJ, van Heiningen PN, Sunzel M. Absorption, metabolism and excretion of 14C-candesartan and 14C-candesartan cilexetil in healthy volunteers. J. Hum. Hypertens., 11 (Suppl. 2), S27–S28 (1997).
- 10) Israili ZH. Clinical pharmacokinetics of angiotensin II (AT1) receptor blockers in hypertension. J. Hum. Hypertens., 14 (Suppl. 1), S73–S86 (2000).
- 11) Teng R, Hansson AC, Borjesson I. Oral bioavailability of candesartan cilexetil suspension. J. Pharm. Technol., 23, 270–274 (2007).
- 12) Okumu A, DiMaso M, Lobenberg R. Dynamic dissolution testing to establish in vitro/in vivo correlations for montelukast sodium, a poorly soluble drug. Pharm. Res., 25, 2778–2785 (2008).
- 13) Paprskářová A, Možná P, Oga EF, Elhissi A, Alhnan MA. Instrumentation of flow-through USP IV dissolution apparatus to assess poorly soluble basic drug products: a technical note. AAPS PharmSciTech, 17, 1261–1266 (2016).
- 14) Sugano K. Introduction to computational oral absorption simulation. Expert Opin. Drug Metab. Toxicol., 5, 259–293 (2009).
- 15) Kaneniwa N, Watari N, Iijima H. Dissolution of slightly soluble drugs. V. Effect of particle size on gastrointestinal drug absorption and its relation to solubility. Chem. Pharm. Bull., 26, 2603–2614 (1978).
- 16) Xia D, Cui F, Piao H, Cun D, Piao H, Jiang Y, Ouyang M, Quan P. Effect of crystal size on the in vitro dissolution and oral absorption of nitrendipine in rats. Pharm. Res., 27, 1965–1976 (2010).
- 17) Jinno J, Kamada N, Miyake M, Yamada K, Mukai T, Odomi M, Toguchi H, Liversidge GG, Higaki K, Kimura T. Effect of particle size reduction on dissolution and oral absorption of a poorly water-soluble drug, cilostazol, in beagle dogs. J. Control. Release, 111, 56–64 (2006).
- 18) Jantratid E, Dressman J. Biorelevant dissolution media simulating the proximal human gastrointestinal tract: an update. Dissolut. Technol., 16, 21–25 (2009).
- 19) “Guideline for bioequivalence studies of generic products; English translation of attachment 1 of PSEHB/PED notification No. 0319-1: Japan, 2020.”: ‹http://www.nihs.go.jp/drug/be-guide(e)/2020/GL1_BE_2020.pdf›, accessed 24 November, 2021.
- 20) “The Japanese Pharmacopeia, 18th ed.; The society of Japanese Pharmacopeia: Tokyo, Japan, 2021.”: ‹https://www.pmda.go.jp/english/rs-sb-std/standards-development/jp/0029.html›, accessed 24 November, 2021.
- 21) Mudie DM, Amidon GL, Amidon GE. Physiological parameters for oral delivery and in vitro testing. Mol. Pharm., 7, 1388–1405 (2010).
- 22) Fuchs A, Leigh M, Kloefer B, Dressman JB. Advances in the design of fasted state simulating intestinal fluids: FaSSIF-V3. Eur. J. Pharm. Biopharm., 94, 229–240 (2015).
- 23) Xie X, Cardot JM, Garrait G, Thery V, El-Hajji M, Beyssac E. Micelle dynamic simulation and physicochemical characterization of biorelevant media to reflect gastrointestinal environment in fasted and fed states. Eur. J. Pharm. Biopharm., 88, 565–573 (2014).
- 24) Davis SS, Hardy JG, Fara JW. Transit of pharmaceutical dosage forms through the small intestine. Gut, 27, 886–892 (1986).
- 25) Sugano K. Possible reduction of effective thickness of intestinal unstirred water layer by particle drifting effect. Int. J. Pharm., 387, 103–109 (2010).
- 26) Ponchel G, Irache J. Specific and non-specific bioadhesive particulate systems for oral delivery to the gastrointestinal tract. Adv. Drug Deliv. Rev., 34, 191–219 (1998).
- 27) Ohashi R, Kamikozawa Y, Sugiura M, Fukuda H, Yabuuchi H, Tamai I. Effect of P-glycoprotein on intestinal absorption and brain penetration of antiallergic agent bepotastine besilate. Drug Metab. Dispos., 34, 793–799 (2006).
- 28) Pharmaceuticals and Medical Devices Agency. “IF of Candesartan “Sawai”: Japan, 2020.”: ‹https://www.info.pmda.go.jp/go/interview/1/300119_2149040F5048_1_061_1F.pdf›, accessed 24 November, 2021.
- 29) Matsuguma K, Tao I, Kato T, Kiwata S, Ueno S, Ohnishi A. Bioequivalence study of candesartan tablets 2 mg “Sawai”, candesartan tablets 4 mg “Sawai”, candesartan tablets 8 mg “Sawai” and candesartan tablets 12 mg “Sawai” in healthy subjects. Medical Consultation & New Remedies, 51, 959–971 (2014).