Abstract
In many epidemiological studies, the dust extinction coefficient measured by light detection and ranging (LIDAR) is used as an indicator of exposure to Asian dust. However, few reports on the relationship between the distribution of total suspended particles (TSPs) near the ground surface and the dust extinction coefficient exist. In this study, we examined the relationship between the concentrations of TSPs near the ground surface, substances indicative of mineral content, and air pollutants that may be transported with Asian dust and dust extinction coefficients in two regions: Imizu and Yurihama–Matsue, from March to May in 2011 and 2013. In both years, large dust extinction coefficients were observed in Imizu and Matsue on days when the concentrations of TSPs and mineral content indicators were high near the ground surface in Imizu and Yurihama, and Asian dust was expected to be highly suspended. In both regions, the concentrations of TSPs and mineral content indicators were significantly positively correlated with the dust extinction coefficient. The concentrations of all air pollutants analyzed were significantly positively correlated with the dust extinction coefficient in each region in 2013, but not in 2011. These results suggest that the dust extinction coefficient is a useful indicator of Asian dust near the ground surface; however, as harmful air pollutants occasionally move with Asian dust, it is necessary to monitor these pollutants near the ground surface when conducting an epidemiological study on the health effect of airborne particles.
INTRODUCTION
Asian dust is a phenomenon wherein soil and mineral particles that have reached an altitude of several thousand meters in the arid and semi-arid regions of inland East Asia, such as the Taklamakan Desert, Gobi Desert, and Loess Plateau, are carried by westerly winds to eastern China, the Korean Peninsula, the Japanese Islands, and the east coast of the Pacific Ocean.1–9) Many epidemiological studies have been conducted to investigate the effects of transported Asian dust and air pollutants on human health, and definitions by the meteorological agencies of the concerned countries, particulate matter concentrations, and observed values using light detection and ranging (LIDAR), have been used as indicators to evaluate exposure to Asian dust.10–17) The Japan Meteorological Agency visually detected Asian dust at its meteorological stations mostly in spring (March to May).18) LIDAR is a device that measures the scattering of laser beams by airborne particles in the air at a height of ≥120 m using a receiving telescope. It has been measured at 12 locations in Japan by the National Institute for Environmental Studies (NIES).19) In LIDAR analysis, the amount of Asian dust particles distributed in the atmosphere can be quantified as the extinction coefficient of non-spherical aerosols (dust extinction coefficient).20,21) Therefore, LIDAR observations have been used as an index to evaluate exposure to Asian dust in many epidemiological studies in recent years.16,17,22–25)
Dust extinction coefficients used as indicators of Asian dust exposure in epidemiological studies are mostly measured by LIDAR at heights of 120–1000 m. However, epidemiological studies have investigated the health status of people exposed to suspended particles near the ground surface. Therefore, to use LIDAR measurement results as an indicator of Asian dust in epidemiological studies, they must reflect the dispersion of Asian dust near the ground surface; however, few reports exist which explore the relationship between them.26–28) Additionally, the effect of the distance between the LIDAR measurement point and particle collection point at the ground surface on the relationship between the LIDAR dust extinction coefficient and the concentrations of particles and their composition has rarely been reported.28)
The present study aimed to clarify the relationship between the concentrations of total suspended particles (TSPs) and their chemical composition near the ground surface and the dust extinction coefficient. Collection of TSPs and the measurement of the dust extinction coefficient by LIDAR were carried out in Imizu, Toyama Prefecture. Additionally, to clarify the effect of the horizontal distance between the TSPs collection and LIDAR measurement points, we also conducted a similar study in Yurihama, Tottori Prefecture, and Matsue, Shimane Prefecture. The TSPs were collected in Yurihama, and the dust coefficients were measured by LIDAR in Matsue, which is approx. 70 km away from Yurihama. In the compositional analysis of TSPs, iron (Fe), magnesium (Mg), and non-sea-salt calcium ions (nss-Ca2+), which are indicators of mineral content, and lead (Pb), cadmium (Cd), and non-sea-salt sulfate (nss-SO42−), which are air pollutants expected to be transported with Asian dust, were analyzed. To clarify the reproducibility of the relationship between the TSPs, its composition, and the dust extinction coefficient, the survey was conducted from March to May, the time of arrival of Asian dust, in 2011 and 2013.
MATERIALS AND METHODS
ReagentsQuartz filters (8 × 10 inches) were purchased from Pall Life Science (Port Washington, NY, U.S.A.). Methanol, ethanol, nitric acid, hydrochloric acid, hydrofluoric acid, and p-hydroxybenzoic acid were purchased from Nacalai Tesque, Inc. (Kyoto, Japan). Perchloric acid and boric acid were purchased from Wako Pure Chemical Corporation (Osaka, Japan). Standard solutions of Ca2+ and SO42− were purchased from Kanto Chemical Co., Inc. (Tokyo, Japan). Bis(2-hydroxyethyl)imino-tris(hydroxymethyl)methane was purchased from Dojindo Laboratories (Mashiki, Japan).
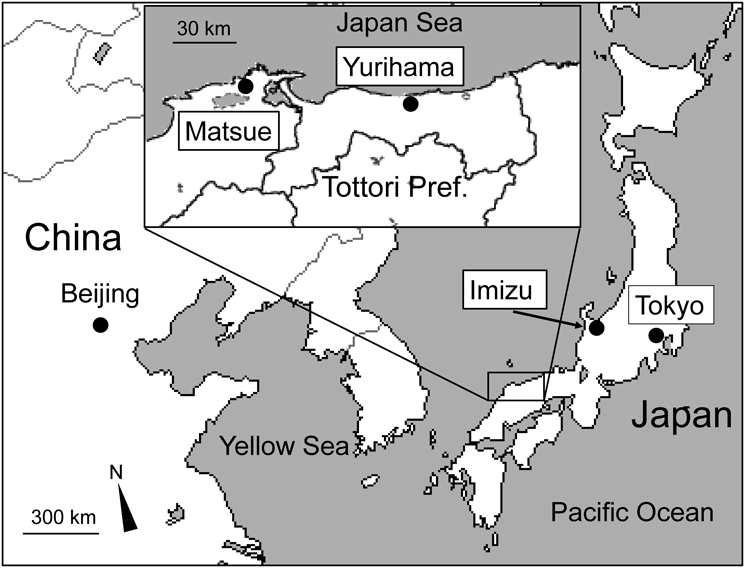
Sampling Methodology and Sample PreparationTSPs were collected on quartz fiber filters using a high volumetric air sampler (HV-1000R, Shibata Scientific Technology, Soka, Japan) for approx. 24 h each at the Toyama Environmental Science Center in Imizu (137.10°E, 36.70°N), and the Tottori Prefectural Institute of Hygiene and Environment in Yurihama (133.88°E, 35.49°N) (Fig. 1). The collection started at approximately 9:00 a.m., and the air was aspirated at approx. 1000 L/min (total flow rate: 1491.3 m3). From March to May of 2011 and 2013, TSPs were collected on weekdays, and those that were collected on days when the dust extinction coefficient could be observed by LIDAR were analyzed for their composition. The filters were weighed before and after collection of TSPs in a constant humidity chamber (approx. 50% humidity) at a temperature of approx. 20 °C and humidity of approx. 50%. Filters that collected TSPs were stored below −80 °C until use.7)
Analysis of MetalsThe filter that collected the TSPs was cut into small pieces, placed in a beaker made of tetrafluoroethylene, and heated at 130 °C with nitric and hydrochloric acids. After cooling, nitric acid, perchloric acid, and hydrofluoric acid were added, and the mixture was heated to approx. 200 °C. The contents were then dissolved in distilled water, filtered using filter paper, evaporated to dryness, and dissolved in 0.2 mol/L nitric acid to make the test solution. Fe and Mg were analyzed with an inductively coupled plasma-emission spectrometer (IRIS 1000, Thermo Fisher Scientific, MA, U.S.A.), and Pb and Cd were analyzed using an atomic absorption spectrophotometer (AAnalyst 600, PerkinElmer, Inc., MA, U.S.A.).29) The recovery rate using reference atmospheric particles (NIST, SRM1648a) was Fe: 96%, Mg: 96%, Pb: 83%, Cd: 73%.
Analysis of Water-Soluble Ionic SpeciesThe filter that collected the TSPs was cut into small pieces, extracted with distilled water using an ultrasonic generator (BRANSON 3510, Emerson Japan, Tokyo, Japan), and filtered through a membrane filter (DISMIC-25CS, Advantech, Taiwan) to yield the test solution. Ca2+ and SO42− were analyzed by ion chromatography using a conduction detector (CDD-10, Shimadzu Corporation, Kyoto, Japan) with Shim-pack IC-C4 and IC-A3 columns (Shimadzu Corporation). To analyze the cation (Ca2+), 2.5 mmol/L oxalic acid solution was used as the mobile phase, and the flow rate was 1.0 mL/min. For the analysis of the anion (SO42−), 8 mmol/L p-hydroxybenzoic acid, 3.2 mmol/L bis(2-hydroxyethyl)imino-tris(hydroxymethyl)methane, and 50 mmol/L boric acid were used as mobile phases with a flow rate of 1.2 mL/min.30) The nss-Ca2+ and nss-SO42− concentrations were calculated based on Guo et al.31)
Measurement of Dust Extinction CoefficientDust extinction coefficients were measured using LIDAR at the Toyama Environmental Science Center in Imizu (137.10°E, 36.70°N, the site of TSPs collection) and at the Shimane Institute for Health and Environmental Sciences in Matsue (133.01°E, 35.48°N, 73 km from the TSPs collection site in Yurihama). The data are daily averages of dust extinction coefficients from 9:00 a.m. to 9:00 a.m. of the following day, at altitudes from 120 to 1020 m.
Asian Dust Observations by the Japan Meteorological AgencyInformation on Asian dust observation dates in Toyama (15 km from Imizu) and Matsue by the Japan Meteorological Agency (JMA) were obtained from the JMA website.32)
Statistical AnalysisThe calculation of correlation coefficients and their significance tests were performed using Microsoft Office Excel 2013. When the correlation coefficient was between 0.2 and 0.4, and the p-value was <0.05, it was judged to be weakly positively correlated; when the correlation coefficient was between 0.4 and 0.7 and the p-value was <0.05, it was judged to be moderately positively correlated; and when the correlation coefficient was >0.7, and the p-value was <0.05, it was judged to be strongly positively correlated.
Backward Trajectory AnalysisBackward trajectories were estimated with the HYSPLIT model provided by the National Oceanic and Atmospheric Administration (NOAA) of the United State of America.33) The backward trajectories started at 10 p.m. (Japanese Standard Time), and the height was set at 1500 m. Backward trajectory analysis was measured using model vertical velocity and the trajectory duration was 96 h (4 d).
RESULTS
Concentrations of TSPs and Mineral Content Indicators (Fe, Mg, and nss-Ca2+) and Dust Extinction Coefficients in Imizu and Yurihama–MatsueThe concentrations of TSPs and Fe, Mg, and nss-Ca2+ in TSPs collected near the ground surface in Imizu; the dust extinction coefficient measured by LIADR at the same site; and their median, mean, standard deviation, and maximum and minimum values, are shown in Table 1. The JMA reported that Asian dust was observed in Toyama on May 2, 3, and 13, 2011, and March 9 and 19, 2013. In Imizu, the concentrations of TSPs, Fe, Mg, and nss-Ca2+ were very high on May 1–3 and 13, 2011, ranging from 126–257, 5.05–9.09, 2.37–3.92, and 1.95–2.99 µg/m3, respectively, and the values of extinction coefficient were also very large (0.126–0.354 km−1). On March 7, 8, and 19, 2013, the concentrations of TSPs, Fe, Mg, and nss-Ca2+ were high, ranging from 86–120, 1.28–1.81, 0.89–1.29, and 1.52–2.02 µg/m3, respectively. The dust extinction coefficient values were also large (0.058–0.062 km−1) on these days.
Table 1. Concentrations of TSPs and Mineral Content Indicators in TSPs Collected at Imizu and LIDAR Dust Extinction Coefficient Measured at Imizu in 2011 and 2013
| Sampling dates | TSPs (µg/m3) | Fe (µg/m3) | Mg (µg/m3) | nss-Ca2+ (µg/m3) | LIDAR (km−1) |
|---|
| Year 2011 |
| 2011/3/28 | 33 | 1.09 | 0.08 | 0.37 | 0.015 |
| 3/29 | 63 | 0.18 | 0.24 | 0.54 | 0.025 |
| 3/31 | 31 | 0.75 | 0.12 | 0.16 | 0.011 |
| 4/5 | 28 | 0.83 | 0.17 | 0.25 | 0.010 |
| 4/6 | 74 | 0.70 | 0.13 | 0.33 | 0.020 |
| 4/7 | 94 | 0.48 | 0.07 | 0.20 | 0.044 |
| 4/10 | 82 | 1.75 | 0.82 | 1.45 | 0.061 |
| 4/12 | 83 | 1.53 | 0.63 | 1.01 | 0.052 |
| 4/13 | 54 | 0.91 | 0.43 | 0.73 | 0.034 |
| 4/14 | 85 | 1.19 | 0.49 | 1.01 | 0.046 |
| 4/21 | 33 | 0.41 | 0.11 | 0.35 | 0.017 |
| 4/25 | 30 | 0.63 | 0.20 | 0.33 | 0.008 |
| 5/1 | 126 | 5.05 | 2.37 | 1.95 | 0.126 |
| 5/2* | 224 | 8.72 | 3.92 | 2.99 | 0.354 |
| 5/3* | 186 | 7.15 | 3.29 | 2.59 | 0.144 |
| 5/6 | 66 | 0.99 | 0.48 | 0.42 | 0.042 |
| 5/7 | 33 | 0.54 | 0.23 | 0.30 | 0.013 |
| 5/8 | 57 | 1.26 | 0.61 | 0.76 | 0.035 |
| 5/9 | 74 | 0.80 | 0.29 | 0.48 | 0.018 |
| 5/13* | 257 | 9.09 | 3.89 | 2.68 | 0.207 |
| 5/14 | 113 | 2.79 | 1.31 | 1.32 | 0.076 |
| 5/16 | 95 | 1.02 | 0.47 | 0.91 | 0.038 |
| 5/17 | 49 | 0.76 | 0.31 | 0.48 | 0.020 |
| 5/18 | 35 | 0.61 | 0.21 | 0.42 | 0.020 |
| 5/19 | 54 | 0.87 | 0.27 | 0.55 | 0.023 |
| 5/24 | 20 | 0.27 | 0.17 | 0.21 | 0.005 |
| Median | 64 | 0.89 | 0.30 | 0.51 | 0.029 |
| Mean | 80 | 1.94 | 0.82 | 0.88 | 0.056 |
| S.D. | 60 | 2.56 | 1.17 | 0.82 | 0.077 |
| Maximum | 257 | 9.09 | 3.92 | 2.99 | 0.354 |
| Minimum | 20 | 0.18 | 0.07 | 0.16 | 0.005 |
| Year 2013 |
| 2013/3/4 | 26 | 0.36 | 0.15 | 0.42 | 0.007 |
| 3/5 | 28 | 0.35 | 0.18 | 0.38 | 0.012 |
| 3/6 | 64 | 0.95 | 0.58 | 1.10 | 0.052 |
| 3/7 | 94 | 1.68 | 0.89 | 2.02 | 0.062 |
| 3/8 | 120 | 1.81 | 1.29 | 1.77 | 0.058 |
| 3/9* | 103 | 1.00 | 0.74 | 0.90 | 0.062 |
| 3/11 | 37 | 0.15 | 0.23 | 0.16 | 0.023 |
| 3/12 | 119 | 0.42 | 0.24 | 0.21 | 0.016 |
| 3/14 | 23 | 0.12 | 0.22 | 0.21 | 0.005 |
| 3/19* | 86 | 1.28 | 0.89 | 1.52 | 0.059 |
| 3/21 | 22 | 0.09 | 0.18 | 0.20 | 0.011 |
| 3/25 | 22 | 0.16 | 0.12 | 0.50 | 0.009 |
| 3/26 | 24 | 0.09 | 0.11 | 0.12 | 0.009 |
| 3/27 | 37 | 0.51 | 0.12 | 0.33 | 0.010 |
| 4/1 | 27 | 0.20 | 0.12 | 0.20 | 0.008 |
| 4/4 | 53 | 0.82 | 0.33 | 0.35 | 0.024 |
| 4/8 | 22 | 0.26 | 0.25 | 0.35 | 0.012 |
| 4/9 | 40 | 0.76 | 0.38 | 0.78 | 0.021 |
| 4/11 | 18 | 0.09 | 0.05 | 0.23 | 0.006 |
| 4/15 | 46 | 0.94 | 0.51 | 0.97 | 0.027 |
| 4/16 | 71 | 1.44 | 0.67 | 1.61 | 0.045 |
| 4/22 | 18 | 0.13 | 0.02 | 0.12 | 0.004 |
| 4/23 | 22 | 0.33 | 0.07 | 0.15 | 0.010 |
| 4/24 | 14 | 0.15 | 0.08 | 0.24 | 0.017 |
| 4/25 | 31 | 0.47 | 0.19 | 0.34 | 0.011 |
| 4/30 | 51 | 1.19 | 0.54 | 0.52 | 0.041 |
| 5/8 | 14 | 0.20 | 0.04 | 0.07 | 0.003 |
| 5/9 | 38 | 0.55 | 0.13 | 0.31 | 0.014 |
| 5/13 | 90 | 1.55 | 0.54 | 1.33 | 0.033 |
| 5/15 | 65 | 0.92 | 0.38 | 0.90 | 0.015 |
| 5/20 | 23 | 0.38 | 0.10 | 0.25 | 0.012 |
| 5/21 | 50 | 1.06 | 0.35 | 0.82 | 0.020 |
| 5/22 | 50 | 1.05 | 0.40 | 0.87 | 0.018 |
| 5/23 | 21 | 0.42 | 0.10 | 0.09 | 0.007 |
| 5/27 | 45 | 0.70 | 0.20 | 0.36 | 0.012 |
| 5/30 | 24 | 0.51 | 0.14 | 0.14 | 0.025 |
| 5/31 | 62 | 1.99 | 0.64 | 0.82 | 0.039 |
| Median | 37 | 0.51 | 0.22 | 0.35 | 0.015 |
| Mean | 46 | 0.68 | 0.33 | 0.59 | 0.022 |
| S.D. | 30 | 0.54 | 0.29 | 0.52 | 0.018 |
| Maximum | 120 | 1.99 | 1.29 | 2.02 | 0.062 |
| Minimum | 14 | 0.09 | 0.02 | 0.07 | 0.003 |
S.D. standard deviation. *Asian dust arrival dates.
The concentrations of TSPs and Fe, Mg, and nss-Ca2+ in TSPs collected near the ground surface in Yurihama; the dust extinction coefficient in Matsue; and their medians, means, standard deviations, and maximum and minimum values, are shown in Table 2. The JMA reported that Asian dust was observed in Matsue on May 1 and 13, 2011, and March 8–10 and 19, 2013. In Yurihama, the concentrations of TSPs, Fe, Mg, and nss-Ca2+ were high on April 9 and 10, and May 1 and 13, 2011, ranging from 68–276, 1.75–7.94, 0.89–3.62, and 1.16–4.19 µg/m3, respectively. On these days, the values of the dust extinction coefficient measured in Matsue were large (0.055–0.299 km−1). The concentrations of TSPs, Fe, Mg, and nss-Ca2+ were high in Yurihama on March 7–9 and 19, and April 30, 2013 (TSPs 91–201 µg/m3, Fe 1.88–4.02 µg/m3, Mg 0.97–1.69 µg/m3, and nss-Ca2+ 1.78–4.04 µg/m3), and the dust extinction coefficients in Matsue were large (0.072 to 0.134 km−1).
Table 2. Concentrations of TSPs and Mineral Content Indicators in TSPs Collected at Yurihama and LIDAR Dust Extinction Coefficient Measured at Matsue in 2011 and 2013
| Sampling dates | TSPs (µg/m3) | Fe (µg/m3) | Mg (µg/m3) | nss-Ca2+ (µg/m3) | LIDAR (km−1) |
|---|
| Year 2011 |
| 2011/3/8 | 35 | 0.57 | 0.42 | 0.36 | 0.028 |
| 3/10 | 35 | 0.41 | 0.30 | 0.28 | 0.017 |
| 3/11 | 45 | 0.39 | 0.56 | 0.56 | 0.029 |
| 3/17 | 21 | 0.09 | 0.23 | 0.03 | 0.012 |
| 3/18 | 30 | 0.30 | 0.26 | 0.17 | 0.020 |
| 3/19 | 52 | 0.41 | 0.44 | 0.48 | 0.024 |
| 3/24 | 48 | 1.04 | 0.63 | 0.68 | 0.033 |
| 3/28 | 38 | 0.80 | 0.31 | 0.52 | 0.020 |
| 3/29 | 42 | 0.63 | 0.26 | 0.49 | 0.018 |
| 3/30 | 62 | 0.91 | 0.50 | 0.70 | 0.026 |
| 3/31 | 63 | 1.16 | 0.53 | 1.03 | 0.051 |
| 4/1 | 49 | 0.91 | 0.41 | 0.58 | 0.032 |
| 4/4 | 21 | 0.21 | 0.30 | 0.15 | 0.009 |
| 4/5 | 24 | 0.60 | 0.20 | 0.20 | 0.013 |
| 4/6 | 34 | 0.36 | 0.15 | 0.16 | 0.018 |
| 4/9 | 68 | 1.87 | 0.91 | 1.16 | 0.055 |
| 4/10 | 86 | 1.75 | 0.89 | 1.57 | 0.064 |
| 4/12 | 56 | 1.14 | 0.54 | 0.79 | 0.042 |
| 4/13 | 60 | 0.85 | 0.63 | 0.67 | 0.038 |
| 4/14 | 61 | 0.91 | 0.61 | 0.85 | 0.043 |
| 4/20 | 25 | 0.14 | 0.44 | 0.11 | 0.012 |
| 4/21 | 51 | 0.58 | 0.30 | 0.33 | 0.029 |
| 4/25 | 41 | 0.50 | 0.49 | 0.29 | 0.020 |
| 4/26 | 61 | 0.87 | 0.41 | 0.66 | 0.021 |
| 4/28 | 20 | 0.09 | 0.16 | 0.03 | 0.006 |
| 5/1* | 276 | 7.94 | 3.62 | 4.19 | 0.299 |
| 5/5 | 34 | 0.43 | 0.49 | 0.22 | 0.034 |
| 5/6 | 55 | 0.63 | 0.52 | 0.40 | 0.036 |
| 5/8 | 52 | 1.44 | 0.63 | 0.73 | 0.062 |
| 5/13* | 203 | 6.03 | 2.44 | 1.83 | 0.136 |
| 5/16 | 75 | 1.28 | 0.73 | 1.12 | 0.033 |
| 5/17 | 45 | 0.99 | 0.48 | 0.72 | 0.041 |
| 5/18 | 54 | 1.26 | 0.52 | 0.82 | 0.041 |
| 5/19 | 54 | 0.96 | 0.37 | 0.56 | 0.035 |
| 5/20 | 46 | 0.74 | 0.28 | 0.31 | 0.016 |
| 5/24 | 19 | 0.11 | 0.18 | 0.08 | 0.010 |
| 5/25 | 26 | 1.25 | 0.19 | 0.11 | 0.018 |
| Median | 48 | 0.80 | 0.44 | 0.52 | 0.029 |
| Mean | 56 | 1.10 | 0.58 | 0.65 | 0.039 |
| S.D. | 48 | 1.51 | 0.64 | 0.73 | 0.049 |
| Maximum | 276 | 7.94 | 3.62 | 4.19 | 0.299 |
| Minimum | 19 | 0.09 | 0.15 | 0.03 | 0.006 |
| Year 2013 |
| 2013/3/4 | 78 | 1.17 | 0.60 | 1.10 | 0.029 |
| 3/5 | 40 | 0.46 | 0.20 | 0.37 | 0.032 |
| 3/6 | 85 | 1.02 | 0.71 | 0.97 | 0.056 |
| 3/7 | 111 | 1.88 | 0.97 | 1.95 | 0.078 |
| 3/8* | 182 | 4.02 | 1.69 | 4.04 | 0.104 |
| 3/9* | 201 | 3.63 | 1.36 | 3.45 | 0.134 |
| 3/10* | 38 | 0.46 | 0.74 | 0.38 | 0.011 |
| 3/11 | 24 | 0.09 | 0.25 | 0.11 | 0.019 |
| 3/12 | 47 | 0.42 | 0.24 | 0.29 | 0.021 |
| 3/14 | 20 | 0.01 | 0.28 | 0.12 | 0.012 |
| 3/19* | 104 | 1.98 | 1.28 | 1.78 | 0.072 |
| 3/21 | 22 | 0.13 | 0.19 | 0.19 | 0.013 |
| 3/26 | 23 | 0.10 | 0.09 | 0.46 | 0.011 |
| 4/1 | 44 | 0.33 | 0.24 | 0.15 | 0.018 |
| 4/3 | 27 | 0.18 | 0.32 | 0.06 | 0.010 |
| 4/4 | 34 | 0.34 | 0.16 | 0.25 | 0.017 |
| 4/8 | 42 | 0.31 | 0.66 | 0.53 | 0.024 |
| 4/9 | 76 | 1.41 | 1.07 | 1.22 | 0.042 |
| 4/11 | 29 | 0.39 | 0.33 | 0.50 | 0.021 |
| 4/15 | 67 | 1.31 | 0.81 | 1.23 | 0.037 |
| 4/16 | 89 | 1.52 | 0.83 | 1.96 | 0.053 |
| 4/18 | 32 | 0.31 | 0.44 | 0.55 | 0.011 |
| 4/22 | 24 | 0.24 | 0.04 | 0.16 | 0.016 |
| 4/25 | 33 | 0.48 | 0.23 | 0.26 | 0.025 |
| 4/30 | 91 | 2.49 | 1.08 | 1.78 | 0.085 |
| 5/8 | 19 | 0.05 | 0.15 | 0.10 | 0.011 |
| 5/9 | 41 | 0.48 | 0.17 | 0.24 | 0.021 |
| 5/13 | 76 | 1.32 | 0.54 | 0.91 | 0.039 |
| 5/14 | 59 | 0.92 | 0.30 | 0.65 | 0.038 |
| 5/15 | 46 | 0.57 | 0.44 | 0.29 | 0.021 |
| 5/16 | 22 | 0.20 | 0.34 | 0.08 | 0.008 |
| 5/20 | 34 | 0.49 | 0.22 | 0.47 | 0.024 |
| 5/21 | 58 | 1.23 | 0.51 | 0.71 | 0.036 |
| 5/22 | 49 | 0.88 | 0.37 | 0.43 | 0.033 |
| 5/23 | 22 | 0.34 | 0.15 | 0.21 | 0.031 |
| 5/27 | 55 | 0.38 | 0.36 | 0.19 | 0.010 |
| 5/29 | 42 | 0.31 | 0.13 | 0.13 | 0.015 |
| 5/30 | 47 | 1.44 | 0.60 | 0.68 | 0.063 |
| Median | 43 | 0.47 | 0.35 | 0.45 | 0.024 |
| Mean | 56 | 0.88 | 0.50 | 0.76 | 0.034 |
| S.D. | 41 | 0.93 | 0.39 | 0.90 | 0.029 |
| Maximum | 201 | 4.02 | 1.69 | 4.04 | 0.134 |
| Minimum | 19 | 0.01 | 0.04 | 0.06 | 0.008 |
S.D. standard deviation. *Asian dust arrival dates.
The concentrations of Pb, Cd, and nss-SO42− in TSPs collected near the ground surface in Imizu; the dust extinction coefficients at the same site; and their median, mean, standard deviation, maximum, and minimum values, are shown in Table 3. Pb and Cd concentrations were high on May 8, 2011, and Pb, Cd, and nss-SO42− concentrations were high on May 16, 2011. However, the dust extinction coefficient values measured on these days were not large (0.035 km−1 on May 8 and 0.038 km−1 on May 16). The concentrations of nss-SO42− were high on April 14 and May 17, 2011, and the concentrations of Cd were high on April 10 and 13, 2011; however, large dust extinction coefficient values were only recorded on April 10 (0.061 km−1 on April 10, compared to 0.020–0.046 km−1 on other days). The concentrations of Pb, Cd, and nss-SO42− were high on March 8, 2013, and the value of dust extinction factor was also large (0.058 km−1). The concentrations of Pb and Cd were high on March 6 and 7, 2013, and the value of the dust extinction coefficient was large (0.052 and 0.062 km−1 on March 6 and 7, respectively). Although the concentrations of Pb, Cd, and nss-SO42− were high on May 13, 2013, the value of the dust extinction coefficient was not large (0.033 km−1).
Table 3. Concentrations of Air Pollutants in TSPs Collected at Imizu and LIDAR Dust Extinction Coefficient Measured at Imizu in 2011 and 2013
| Sampling dates | Pb (ng/m3) | Cd (ng/m3) | nss-SO42− (µg/m3) | LIDAR (km−1) |
|---|
| Year 2011 |
| 2011/3/28 | 12.7 | 0.15 | 2.62 | 0.015 |
| 3/29 | 42.7 | 0.38 | 9.24 | 0.025 |
| 3/31 | 11.6 | 0.12 | 3.09 | 0.011 |
| 4/5 | 8.2 | 0.28 | 2.05 | 0.010 |
| 4/6 | 12.8 | 0.39 | 2.48 | 0.020 |
| 4/7 | 5.6 | 0.14 | 2.93 | 0.044 |
| 4/10 | 34.0 | 0.50 | 7.40 | 0.061 |
| 4/12 | 9.0 | 0.24 | 2.08 | 0.052 |
| 4/13 | 19.7 | 0.56 | 3.77 | 0.034 |
| 4/14 | 11.7 | 0.10 | 11.31 | 0.046 |
| 4/21 | 7.0 | 0.12 | 2.54 | 0.017 |
| 4/25 | 11.3 | 0.16 | 5.90 | 0.008 |
| 5/1 | 28.2 | 0.26 | 4.56 | 0.126 |
| 5/2* | 41.6 | 0.31 | 4.24 | 0.354 |
| 5/3* | 36.0 | 0.28 | 3.65 | 0.144 |
| 5/6 | 11.5 | 0.16 | 4.46 | 0.042 |
| 5/7 | 10.1 | 0.13 | 2.95 | 0.013 |
| 5/8 | 44.3 | 0.46 | 7.20 | 0.035 |
| 5/9 | 17.1 | 0.23 | 4.76 | 0.018 |
| 5/13* | 32.2 | 0.37 | 3.81 | 0.207 |
| 5/14 | 22.3 | 0.30 | 2.83 | 0.076 |
| 5/16 | 44.1 | 0.42 | 14.30 | 0.038 |
| 5/17 | 25.5 | 0.26 | 9.82 | 0.020 |
| 5/18 | 16.1 | 0.17 | 5.25 | 0.020 |
| 5/19 | 29.3 | 0.21 | 6.93 | 0.023 |
| 5/24 | 6.3 | 0.30 | 2.03 | 0.005 |
| Median | 16.6 | 0.26 | 4.02 | 0.029 |
| Mean | 21.2 | 0.27 | 5.08 | 0.056 |
| S.D. | 13.0 | 0.13 | 3.16 | 0.077 |
| Maximum | 44.3 | 0.56 | 14.30 | 0.354 |
| Minimum | 5.6 | 0.10 | 2.03 | 0.005 |
| Year 2013 |
| 2013/3/4 | 10.1 | 0.25 | 3.59 | 0.007 |
| 3/5 | 17.3 | 0.31 | 1.55 | 0.012 |
| 3/6 | 37.1 | 0.63 | 6.85 | 0.052 |
| 3/7 | 34.2 | 0.90 | 4.54 | 0.062 |
| 3/8 | 44.6 | 0.94 | 11.76 | 0.058 |
| 3/9* | 17.8 | 0.40 | 4.18 | 0.062 |
| 3/11 | 5.8 | 0.11 | 1.91 | 0.023 |
| 3/12 | 8.0 | 0.26 | 2.21 | 0.016 |
| 3/14 | 5.0 | 0.13 | 2.78 | 0.005 |
| 3/19* | 16.0 | 0.31 | 8.78 | 0.059 |
| 3/21 | 4.0 | 0.08 | 2.24 | 0.011 |
| 3/25 | 8.4 | 0.15 | 4.16 | 0.009 |
| 3/26 | 5.6 | 0.10 | 2.51 | 0.009 |
| 3/27 | 10.5 | 0.40 | 3.59 | 0.010 |
| 4/1 | 12.7 | 0.26 | 4.47 | 0.008 |
| 4/4 | 33.9 | 0.49 | 11.53 | 0.024 |
| 4/8 | 9.8 | 0.15 | 2.43 | 0.012 |
| 4/9 | 15.6 | 0.20 | 5.87 | 0.021 |
| 4/11 | 13.2 | 0.15 | 4.54 | 0.006 |
| 4/15 | 12.2 | 0.23 | 2.97 | 0.027 |
| 4/16 | 30.2 | 0.62 | 9.55 | 0.045 |
| 4/22 | 7.5 | 0.19 | 3.50 | 0.004 |
| 4/23 | 6.5 | 0.14 | 2.30 | 0.010 |
| 4/24 | 5.8 | 0.12 | 1.98 | 0.017 |
| 4/25 | 12.5 | 0.29 | 5.87 | 0.011 |
| 4/30 | 14.5 | 0.22 | 3.16 | 0.041 |
| 5/8 | 10.0 | 0.15 | 0.90 | 0.003 |
| 5/9 | 16.1 | 0.22 | 3.04 | 0.014 |
| 5/13 | 62.3 | 1.09 | 19.65 | 0.033 |
| 5/15 | 15.7 | 0.33 | 14.72 | 0.015 |
| 5/20 | 6.1 | 0.10 | 2.27 | 0.012 |
| 5/21 | 14.5 | 0.25 | 9.40 | 0.020 |
| 5/22 | 32.6 | 0.29 | 11.42 | 0.018 |
| 5/23 | 11.5 | 0.13 | 3.99 | 0.007 |
| 5/27 | 9.2 | 0.20 | 7.07 | 0.012 |
| 5/30 | 24.7 | 0.25 | 3.73 | 0.025 |
| 5/31 | 17.0 | 0.32 | 5.95 | 0.039 |
| Median | 12.7 | 0.25 | 3.99 | 0.015 |
| Mean | 16.7 | 0.31 | 5.43 | 0.022 |
| S.D. | 12.7 | 0.24 | 4.13 | 0.018 |
| Maximum | 62.3 | 1.09 | 19.65 | 0.062 |
| Minimum | 4.0 | 0.08 | 0.90 | 0.003 |
S.D. standard deviation. *Asian dust arrival dates.
The concentrations of Pb, Cd, and nss-SO42− in TSPs collected near the ground surface in Yurihama; the dust extinction coefficient in Matsue; and their median, mean, standard deviation, maximum, and minimum values, are shown in Table 4. Pb, Cd, and nss-SO42− concentrations were high on March 29, April 14, and May 16, 2011; however, the dust extinction coefficient values were not large (0.018–0.043 km−1). Although the concentrations of Pb and Cd were high on April 13, 2011, the value of the dust extinction coefficient was not large (0.038 km−1). On the other hand, Pb, Cd, and nss-SO42− concentrations were high on March 8 and 9, 2013, and the values of the dust extinction coefficient were very large (0.104 and 0.134 km−1 on March 8 and 9, respectively). Additionally, Pb and Cd concentrations were high on March 4, 2013, and Pb and nss-SO42− concentrations were very high on May 13, 2013; however, the dust extinction coefficient values were not large (0.029 and 0.039 km−1 on March 4 and May 13, respectively).
Table 4. Concentrations of Air Pollutants in TSPs Collected at Yurihama and LIDAR Dust Extinction Coefficient Measured at Matsue in 2011 and 2013
| Sampling dates | Pb (ng/m3) | Cd (ng/m3) | nss-SO42− (µg/m3) | LIDAR (km−1) |
|---|
| Year 2011 |
| 2011/3/8 | 16.6 | 0.30 | 2.83 | 0.028 |
| 3/10 | 13.7 | 0.41 | 3.69 | 0.017 |
| 3/11 | 16.0 | 0.38 | 4.15 | 0.029 |
| 3/17 | 3.8 | 0.08 | 2.76 | 0.012 |
| 3/18 | 7.8 | 0.21 | 2.79 | 0.020 |
| 3/19 | 13.8 | 0.37 | 5.32 | 0.024 |
| 3/24 | 18.9 | 0.30 | 4.14 | 0.033 |
| 3/28 | 21.4 | 0.73 | 6.78 | 0.020 |
| 3/29 | 32.6 | 0.70 | 10.41 | 0.018 |
| 3/30 | 18.2 | 0.44 | 10.10 | 0.026 |
| 3/31 | 26.0 | 0.53 | 9.97 | 0.051 |
| 4/1 | 21.5 | 0.74 | 6.14 | 0.032 |
| 4/4 | 3.0 | 0.07 | 1.29 | 0.009 |
| 4/5 | 5.1 | 0.13 | 1.99 | 0.013 |
| 4/6 | 4.5 | 0.15 | 2.81 | 0.018 |
| 4/9 | 18.5 | 0.30 | 7.31 | 0.055 |
| 4/10 | 22.0 | 0.38 | 8.82 | 0.064 |
| 4/12 | 8.4 | 0.16 | 3.53 | 0.042 |
| 4/13 | 52.0 | 0.84 | 7.98 | 0.038 |
| 4/14 | 23.6 | 0.63 | 12.92 | 0.043 |
| 4/20 | 2.5 | 0.05 | 3.07 | 0.012 |
| 4/21 | 11.2 | 0.23 | 5.86 | 0.029 |
| 4/25 | 19.8 | 0.24 | 6.37 | 0.020 |
| 4/26 | 15.7 | 0.25 | 10.34 | 0.021 |
| 4/28 | 3.1 | 0.05 | 2.55 | 0.006 |
| 5/1* | 20.7 | 0.29 | 7.46 | 0.299 |
| 5/5 | 5.4 | 0.10 | 2.79 | 0.034 |
| 5/6 | 8.7 | 0.13 | 4.98 | 0.036 |
| 5/8 | 17.4 | 0.24 | 7.36 | 0.062 |
| 5/13* | 18.3 | 0.23 | 3.03 | 0.136 |
| 5/16 | 27.9 | 0.59 | 15.13 | 0.033 |
| 5/17 | 15.1 | 0.47 | 11.89 | 0.041 |
| 5/18 | 16.5 | 0.45 | 6.07 | 0.041 |
| 5/19 | 14.8 | 0.45 | 11.25 | 0.035 |
| 5/20 | 11.0 | 0.23 | 8.76 | 0.016 |
| 5/24 | 3.5 | 0.05 | 1.50 | 0.010 |
| 5/25 | 6.5 | 0.08 | 2.20 | 0.018 |
| Median | 15.7 | 0.29 | 5.86 | 0.029 |
| Mean | 15.3 | 0.32 | 6.12 | 0.039 |
| S.D. | 9.9 | 0.22 | 3.59 | 0.049 |
| Maximum | 52.0 | 0.84 | 15.13 | 0.299 |
| Minimum | 2.5 | 0.05 | 1.29 | 0.006 |
| Year 2013 |
| 2013/3/4 | 50.5 | 0.92 | 9.77 | 0.029 |
| 3/5 | 27.9 | 0.39 | 5.77 | 0.032 |
| 3/6 | 34.4 | 0.59 | 6.16 | 0.056 |
| 3/7 | 33.0 | 0.86 | 11.67 | 0.078 |
| 3/8* | 63.2 | 1.51 | 17.98 | 0.104 |
| 3/9* | 58.4 | 1.23 | 18.13 | 0.134 |
| 3/10* | 5.6 | 0.09 | 3.03 | 0.011 |
| 3/11 | 4.2 | 0.10 | 1.76 | 0.019 |
| 3/12 | 8.5 | 0.27 | 5.08 | 0.021 |
| 3/14 | 3.7 | 0.10 | 2.17 | 0.012 |
| 3/19* | 34.4 | 0.61 | 10.56 | 0.072 |
| 3/21 | 4.8 | 0.10 | 1.91 | 0.013 |
| 3/26 | 6.1 | 0.18 | 5.12 | 0.011 |
| 4/1 | 9.1 | 0.14 | 3.52 | 0.018 |
| 4/3 | 6.9 | 0.14 | 5.98 | 0.010 |
| 4/4 | 9.6 | 0.16 | 6.48 | 0.017 |
| 4/8 | 21.4 | 0.18 | 3.83 | 0.024 |
| 4/9 | 22.6 | 0.27 | 5.68 | 0.042 |
| 4/11 | 17.7 | 0.32 | 4.90 | 0.021 |
| 4/15 | 14.9 | 0.30 | 3.34 | 0.037 |
| 4/16 | 40.6 | 1.07 | 14.25 | 0.053 |
| 4/18 | 7.3 | 0.14 | 5.34 | 0.011 |
| 4/22 | 6.9 | 0.14 | 4.27 | 0.016 |
| 4/25 | 11.0 | 0.15 | 8.47 | 0.025 |
| 4/30 | 9.3 | 0.16 | 2.17 | 0.085 |
| 5/8 | 1.1 | 0.03 | 1.29 | 0.011 |
| 5/9 | 10.8 | 0.18 | 9.47 | 0.021 |
| 5/13 | 45.9 | 0.54 | 20.64 | 0.039 |
| 5/14 | 29.9 | 0.39 | 13.02 | 0.038 |
| 5/15 | 14.6 | 0.23 | 13.71 | 0.021 |
| 5/16 | 5.7 | 0.08 | 5.10 | 0.008 |
| 5/20 | 5.6 | 0.09 | 6.40 | 0.024 |
| 5/21 | 35.7 | 0.27 | 13.69 | 0.036 |
| 5/22 | 15.9 | 0.22 | 13.85 | 0.033 |
| 5/23 | 8.5 | 0.11 | 4.05 | 0.031 |
| 5/27 | 10.3 | 0.05 | 3.68 | 0.010 |
| 5/29 | 23.7 | 0.37 | 17.49 | 0.015 |
| 5/30 | 17.7 | 0.29 | 7.14 | 0.063 |
| Median | 12.8 | 0.20 | 5.87 | 0.024 |
| Mean | 19.4 | 0.34 | 7.81 | 0.034 |
| S.D. | 16.2 | 0.35 | 5.27 | 0.029 |
| Maximum | 63.2 | 1.51 | 20.64 | 0.134 |
| Minimum | 1.1 | 0.03 | 1.29 | 0.008 |
S.D. standard deviation. *Asian dust arrival dates.
Table 5 shows the correlation coefficient between the concentrations of TSPs, metals, and ions, and the dust extinction coefficient in Imizu. In both 2011 and 2013, the correlation coefficients between the concentrations of TSPs, Fe, Mg, and nss-Ca2+ were large (r = 0.75–0.99, p < 0.01), and these concentrations were strongly positively correlated. In 2011, Pb concentrations were moderately positively correlated with TSPs, Fe, Mg, and nss-Ca2+ concentrations (r = 0.48–0.60, p < 0.05); however, Cd and nss-SO42− concentrations were not significantly correlated with TSPs, Fe, Mg, or nss-Ca2+ concentrations. In 2013, Pb, Cd, and nss-SO42− concentrations were moderately or strongly positively correlated with TSPs, Fe, Mg, and nss-Ca2+ concentrations (r = 0.50–0.79, p < 0.01). In 2011 and 2013, the correlation coefficients between the concentrations of TSPs, Fe, Mg, and nss-Ca2+ and the dust extinction coefficient were ≥0.78 (p < 0.01), indicating a strong positive correlation. On the other hand, in 2011 and 2013, the correlation coefficients between Pb concentration and dust extinction coefficients were 0.50 (p = 0.01) and 0.60 (p < 0.01), respectively, and these values were moderately positively correlated. Cd and nss-SO42− concentrations were not significantly correlated with dust extinction coefficients in 2011; however, they were moderately or weakly positively correlated with dust extinction coefficients in 2013 (Cd r = 0.68, p < 0.01, nss-SO42− r = 0.36, p < 0.05).
Table 5. Correlation Coefficient between TSPs, Metal and Ion Concentrations, and LIDAR Dust Extinction Coefficient in Imizu in 2011 and 2013
| TSPs (µg/m3) | Fe (µg/m3) | Mg (µg/m3) | nss-Ca2+ (µg/m3) | Pb (ng/m3) | Cd (ng/m3) | nss-SO42− (µg/m3) | LIDAR (km−1) |
|---|
| Year 2011 |
| TSPs (µg/m3) | 1.00 | | | | | | | |
| Fe (µg/m3) | 0.94** | 1.00 | | | | | | |
| Mg (µg/m3) | 0.94** | 0.99** | 1.00 | | | | | |
| nss-Ca2+ (µg/m3) | 0.93** | 0.96** | 0.97** | 1.00 | | | | |
| Pb (ng/m3) | 0.52** | 0.48* | 0.52** | 0.60** | 1.00 | | | |
| Cd (ng/m3) | 0.26 | 0.20 | 0.23 | 0.32 | 0.62** | 1.00 | | |
| nss-SO42−(µg/m3) | 0.00 | −0.14 | −0.1 | 0.03 | 0.56** | 0.21 | 1.00 | |
| LIDAR (km−1) | 0.90** | 0.93** | 0.93** | 0.91** | 0.50* | 0.20 | −0.08 | 1.00 |
| Year 2013 |
| TSPs (µg/m3) | 1.00 | | | | | | | |
| Fe (µg/m3) | 0.75** | 1.00 | | | | | | |
| Mg (µg/m3) | 0.83** | 0.87** | 1.00 | | | | | |
| nss-Ca2+ (µg/m3) | 0.75** | 0.86** | 0.91** | 1.00 | | | | |
| Pb (ng/m3) | 0.60** | 0.71** | 0.63** | 0.70** | 1.00 | | | |
| Cd (ng/m3) | 0.72** | 0.74** | 0.72** | 0.79** | 0.91** | 1.00 | | |
| nss-SO42−(µg/m3) | 0.52** | 0.63** | 0.50** | 0.59** | 0.77** | 0.67** | 1.00 | |
| LIDAR (km−1) | 0.78** | 0.81** | 0.92** | 0.83** | 0.60** | 0.68** | 0.36* | 1.00 |
Significances:** p < 0.01,* p < 0.05.
Table 6 shows the correlation coefficient between the concentrations of TSPs, metals, and ions, and the dust extinction coefficient in Yurihama–Matsue. In both 2011 and 2013, the correlation coefficients between the concentrations of TSPs, Fe, Mg, and nss-Ca2+ in Yurihama were large (r = 0.88–0.98, p < 0.01), and these concentrations were strongly positively correlated. Additionally, the concentrations of Pb, Cd, and nss-SO42−, and those of TSPs, Fe, Mg, and nss-Ca2+ were not moderately or strongly correlated in 2011. By contrast, in 2013, Pb and Cd concentrations were moderately or strongly positively correlated with Fe, Mg, and nss-Ca2+ concentrations (r = 0.68–0.88, p < 0.01), and nss-SO42− was moderately or weakly positively correlated with Fe, Mg, and nss-Ca2+ concentrations. The correlation coefficients between the concentrations of TSPs, Fe, Mg, and nss-Ca2+ in Yurihama and the dust extinction coefficient in Matsue were ≥0.84 (p < 0.01) in 2011 and 2013, indicating a strong positive correlation. By contrast, the concentrations of Pb, Cd, and nss-SO42− in Yurihama and the dust extinction coefficient in Matsue were strongly or moderately positively correlated in 2013 (r = 0.51–0.78, p < 0.01); however, no significant correlation was found between them in 2011.
Table 6. Correlation Coefficient between TSPs, Metal and Ion Concentrations, and LIDAR Dust Extinction Coefficient in Yurihama–Matsue in 2011 and 2013
| TSPs (µg/m3) | Fe (µg/m3) | Mg (µg/m3) | nss-Ca2+ (µg/m3) | Pb (ng/m3) | Cd (ng/m3) | nss-SO42− (µg/m3) | LIDAR (km−1) |
|---|
| Year 2011 |
| TSPs (µg/m3) | 1.00 | | | | | | | |
| Fe (µg/m3) | 0.98** | 1.00 | | | | | | |
| Mg (µg/m3) | 0.98** | 0.97** | 1.00 | | | | | |
| nss-Ca2+ (µg/m3) | 0.95** | 0.92** | 0.94** | 1.00 | | | | |
| Pb (ng/m3) | 0.31 | 0.24 | 0.26 | 0.38* | 1.00 | | | |
| Cd (ng/m3) | 0.12 | 0.05 | 0.04 | 0.22 | 0.86** | 1.00 | | |
| nss-SO42− (µg/m3) | 0.22 | 0.13 | 0.12 | 0.34* | 0.63** | 0.67** | 1.00 | |
| LIDAR (km−1) | 0.96** | 0.95** | 0.97** | 0.96** | 0.24 | 0.06 | 0.14 | 1.00 |
| Year 2013 |
| TSPs (µg/m3) | 1.00 | | | | | | | |
| Fe (µg/m3) | 0.96** | 1.00 | | | | | | |
| Mg (µg/m3) | 0.88** | 0.90** | 1.00 | | | | | |
| nss-Ca2+ (µg/m3) | 0.96** | 0.96** | 0.91** | 1.00 | | | | |
| Pb (ng/m3) | 0.84** | 0.78** | 0.68** | 0.79** | 1.00 | | | |
| Cd (ng/m3) | 0.88** | 0.82** | 0.73** | 0.88** | 0.92** | 1.00 | | |
| nss-SO42−(µg/m3) | 0.61** | 0.57** | 0.38* | 0.53** | 0.77** | 0.68** | 1.00 | |
| LIDAR (km−1) | 0.92** | 0.95** | 0.84** | 0.92** | 0.73** | 0.78** | 0.51** | 1.00 |
Significances: ** p < 0.01, * p < 0.05.
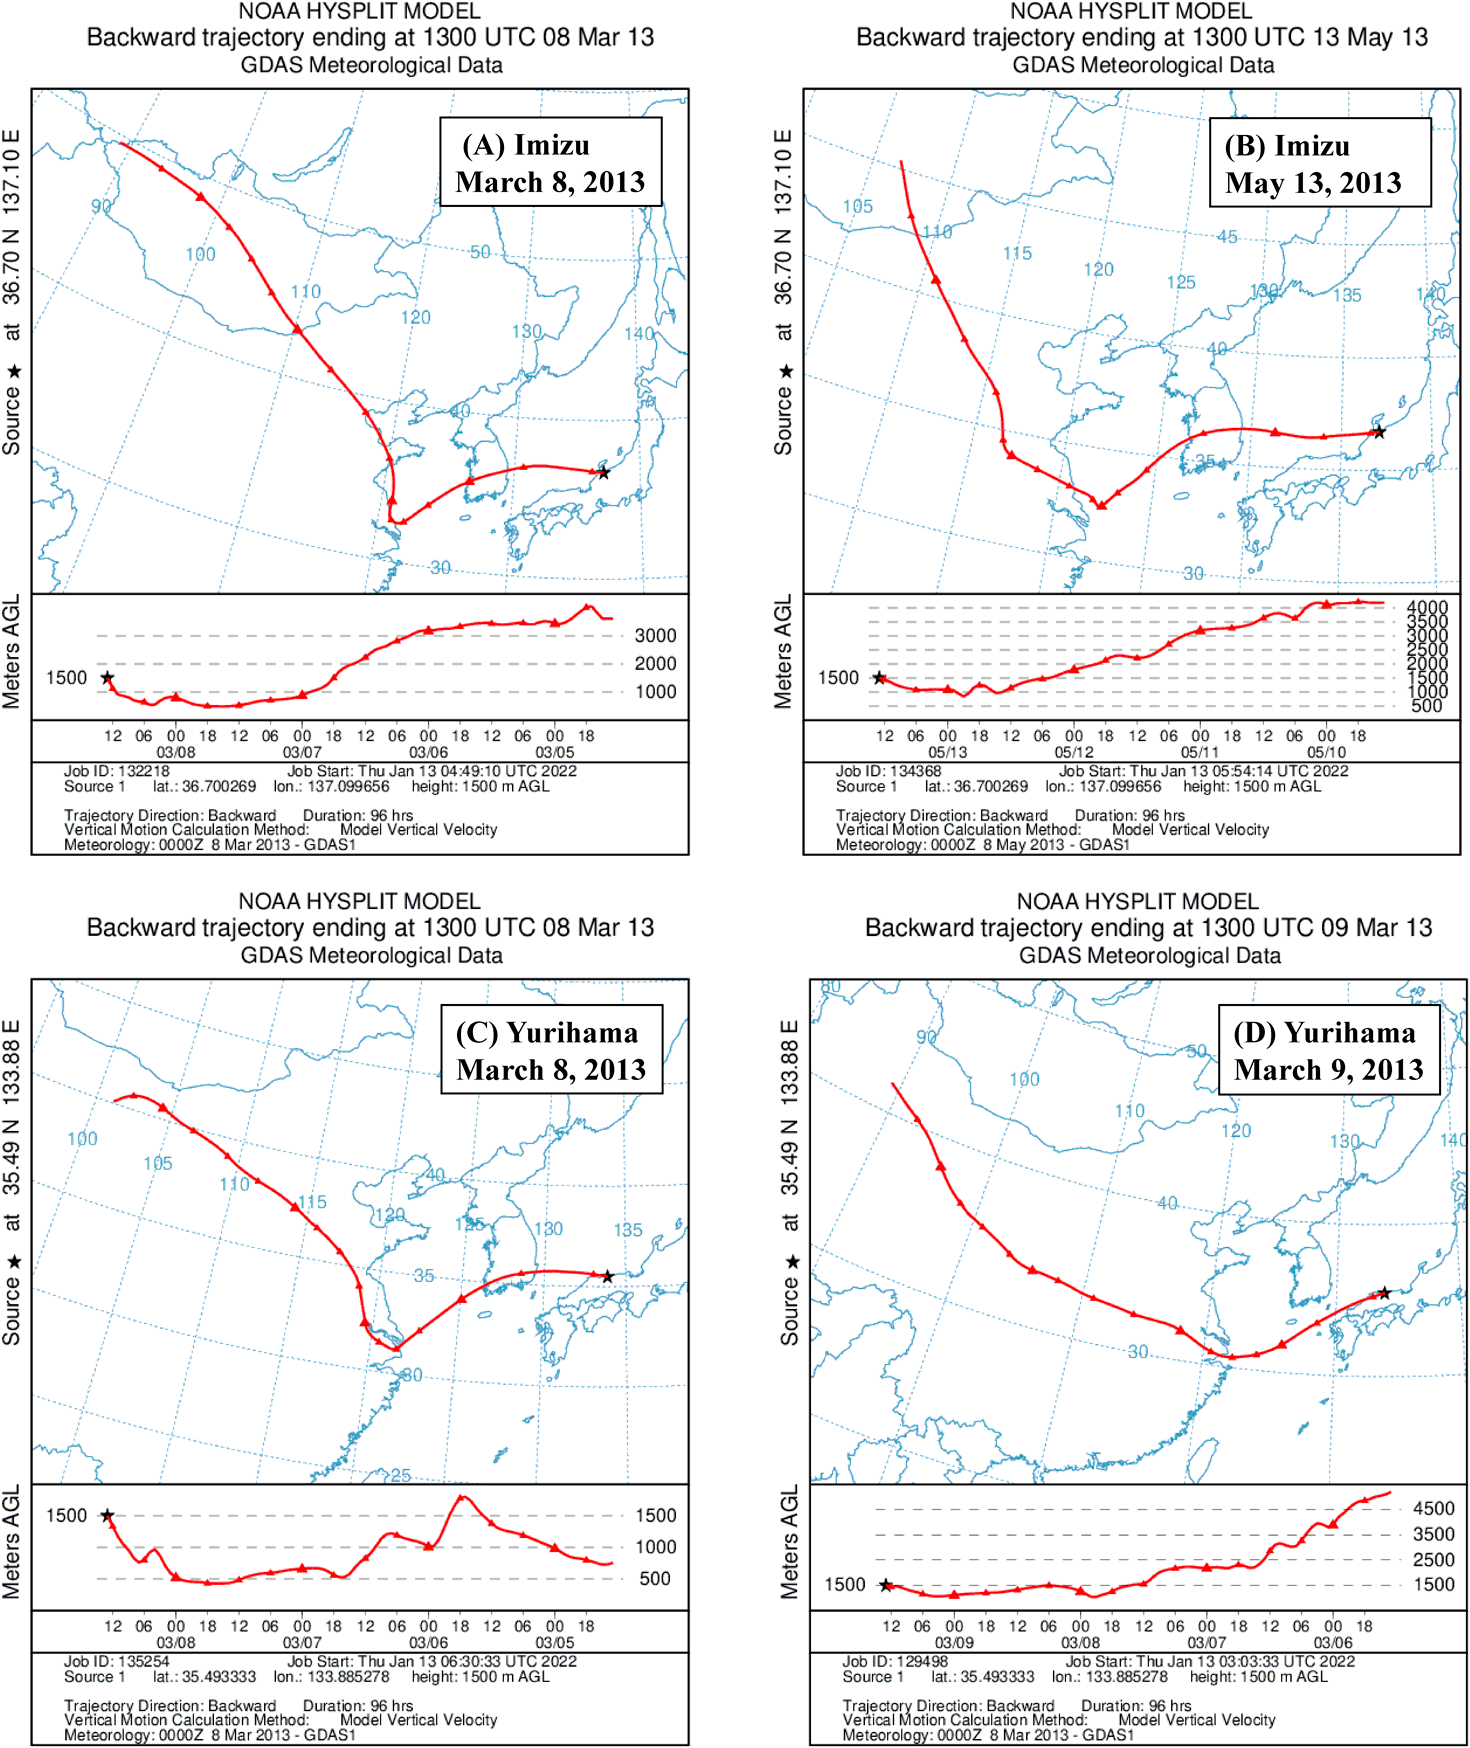
Figure 2 shows the backward trajectories of the air masses from Imizu and Yurihama on days when high concentrations of TSPs, Fe, Mg, nss-Ca2+, Pb, Cd, and nss-SO42− were found (Tables 1–4). Trajectories from Imizu on March 8 and May 13, 2013, and Yurihama on March 8, 2013 (Figs. 2(A)–(C)) indicate that air masses had passed through Gobi Desert, Northern China, and East China, and that from Yurihama on March 9, 2013 (Fig. 2(D)) indicates that air mass had passed through Taklamakan Desert and East China.
DISCUSSION
In this study, to clarify the relationship between the concentrations of TSPs, mineral content indicators, and air pollutants near the ground surface and the dust extinction coefficient measured by LIDAR at altitudes from 120 to 1020 m, TSPs collection and dust extinction coefficient measurement were conducted in Imizu from March to May in 2011 and 2013. Additionally, to explore the effect of horizontal distance on the relationship between the TSPs near the ground surface and the dust extinction coefficient, we collected TSPs in Yurihama and measured dust extinction coefficients in Matsue, located approx. 70 km away from Yurihama, during the same period. In both years, large dust extinction coefficients were observed in Imizu and Matsue on days when the concentrations of TSPs and mineral content indicators (Fe, Mg, and nss-Ca2+) were high near the ground surface and Asian dust was expected to be suspended in large amounts in Imizu and Yurihama (Tables 1, 2). The dust extinction coefficients were strongly positively correlated with the concentrations of TSPs and mineral content indicators in both periods in both regions (Tables 5, 6). These results suggest that the dust extinction coefficient strongly reflects the concentration of particles and minerals suspended in the air near the ground surface at the point where the LIDAR observations were made. Additionally, it was suggested that the dust extinction coefficient strongly reflects the concentration of particles and minerals suspended in the air near the ground surface approx. 70 km away from the point where the LIDAR observations were made. Shimizu et al.26) measured dust extinction coefficient and TSPs concentration at six sites in Japan on days when Asian dust was observed in 2006–2008 and reported that the dust extinction coefficients (1 km−1) correspondent approximately to 1 mg m−3 (0.5–2.0 mg m−3) of TSPs. In the present study, the dust extinction coefficient (1 km−1) in Imizu in 2011 and 2013 corresponded to 0.7 mg m−3 (705 µg m−3) and 1.3 mg m−3 (1296 µg m−3) of TSPs, respectively; similarly, the dust extinction coefficient (1 km−1) in Yurihama–Matsue in 2011 and 2013 corresponded to 0.9 mg m−3 (928 µg m−3) and 1.3 mg m−3 (1319 µg m−3) of TSPs, respectively. These relationships between dust extinction coefficient and TSPs concentration found in this study are consistent with that reported by Shimizu et al.26) Kaneyasu et al.28) reported that the concentration of coarse particles, which was calculated from the concentrations of suspended particulate matter (SPM, particles with an air dynamic diameter of ≤10 µm) and fine particulate matter (PM2.5, particles with an air dynamic diameter of ≤2.5 µm), i.e., [SPM] − [PM2.5], in Nagasaki City was proportional to the dust extinction coefficient measured by LIDAR in Omura City, which is approx. 20 km from Nagasaki City. Additionally, they reported that there was a good positive proportional relationship between the dust extinction coefficient measured in Omura and the concentration of Fe in PM2.5 in Dazaifu, Fukuoka Prefecture, which is located approx. 87 km away from Omura. In the present study, we found the strong positive correlation between the concentrations of TSPs, mineral content indicators, and the dust extinction coefficients measured in two regions: Imizu and Yurihama–Matsue, which are consistent with the results observed in the regions of Nagasaki–Omura and Dazaifu–Omura.28)
The relationship between the concentrations of air pollutants (Pb, Cd, and nss-SO42−) and other atmospheric indicators, such as Fe, Mg, and nss-Ca2+, and the dust extinction coefficients differed between the years (Tables 5, 6). In 2011, in Imizu, Pb concentrations were moderately positively correlated with TSPs, Fe, Mg, and nss-Ca2+ concentrations, and Pb concentrations were moderately positively correlated with the dust extinction coefficient. However, the concentrations of Cd and nss-SO42− were not significantly correlated with either the concentrations of TSPs and the mineral content indicators or the dust extinction coefficient. In contrast, the concentrations of Pb, Cd, and nss-SO42− were moderately or strongly positively correlated with the concentrations of mineral content indicators in Imizu in 2013, and the concentrations of air pollutants were moderately or weakly positively correlated with the dust extinction coefficient. In Yurihama, Pb, Cd, and nss-SO42− concentrations did not show moderate or strong correlations with the concentrations of TSPs and mineral content indicators in 2011, and they did not show significant correlations with the dust extinction coefficient measured in Matsue. In contrast, in 2013, the concentrations of Pb, Cd, and nss-SO42− in Yurihama were significantly positively correlated with the concentrations of mineral content indicators, and the concentrations of air pollutants were moderately or strongly positively correlated with the dust extinction coefficient measured in Matsue.
Although Pb and Cd may be released into the air by natural sources such as sediment, it is estimated that Pb and Cd in the air in China mainly originate from anthropogenic activities, such as fossil fuel combustion and industrial activities.34–36) Energy consumption in China has increased rapidly since 2000, and China has been the world’s largest energy consumer since 2009, with coal being the main energy source.37,38) In China, Pb and Cd concentrations in the atmosphere have increased since 2000 as a result of coal consumption and nonferrous metal smelting.39) Additionally, coal combustion is a major source of atmospheric sulfur dioxide (SO2) emissions, and China is a major emitter of SO2.40) In the atmosphere, nss-SO42− is formed from SO2 by oxidation and other reactions.41,42) Studies on Asian dust and air pollutants in China have shown that Asian dust can travel with high levels of Pb, Cd, and nss-SO42− depending on its domestic migration route.1) Because Imizu and Yurihama are located on the coast of the Sea of Japan and there are no large-scale combustion facilities that can act as a source of air pollution, the Pb, Cd, and nss-SO42− detected in the TSPs in these regions are expected to have been transported over long distances. The backward trajectories of air masses from Imizu and Yurihama on days when high concentrations of TSPs, mineral content indicators (Fe, Mg, and nss-Ca2+), and air pollutants (Pb, Cd, and nss-SO42−) were observed indicate that air masses had passed through arid regions, Gobi and Taklamakan Deserts, and moved to Beijin–Tianjin–Hebei (BTH) region in Northern China and Yangtze River Delta (PYR) region in East China (Fig. 2). BTH and PYR regions are the most developed regions in China, and many studies reported heavy air pollution in these regions.43–46) These results suggest that air pollutants produced in these regions were transported to Imizu and Yurihama–Matsue with dust particles from Gobi and Taklamakan Deserts. In this study, the concentrations of air pollutants in the cities of Imizu and Yurihama in 2013 showed a strong positive correlation with the concentrations of airborne mineral indicator substances (Tables 5, 6), suggesting that air pollutants moved into the cities of Imizu and Yurihama along with Asian dust in that year; therefore, the concentration of air pollutants and the dust extinction coefficient were significantly correlated in this year. However, in 2011, few air pollutants and Asian dust moved into each region simultaneously, which could explain why the concentrations of Cd and nss-SO42− were not significantly correlated with the dust extinction coefficient.
From the above results, it can be concluded that the dust extinction coefficient reflects the concentration of minerals (i.e., Asian dust) over a broad region (70–87 km from the LIDAR observation point) near the ground surface, and that dust extinction coefficient is a useful indicator of Asian dust at the ground level. The dust extinction coefficient is inconsistently strongly correlated with the concentration of air pollutants near the ground surface; therefore, it is not appropriate to use it as an indicator of air pollutants that may be transported with Asian dust. Pb and Cd are harmful metals; Pb damages many organs, such as nerves and the kidneys,47) and Cd damages the kidneys and lungs.48) Additionally, SO42− in PM2.5 has been reported to be strongly associated with pneumonia and wheezing.49) It is important to note that selecting days with high Asian dust concentrations using the dust extinction coefficient as an indicator in epidemiological studies may pick out days with high or low air pollutant concentrations, which may lead to inconsistencies in the results of epidemiological studies on the health effects of Asian dust.
Conflict of Interest
The authors declare no conflict of interest.
REFERENCES
- 1) Sun Y, Zhuang G, Wang Y, Zhao X, Li J, Wang Z, An Z. Chemical composition of dust storms in Beijing and implications for the mixing of mineral aerosol with pollution aerosol on the pathway. J. Geophys. Res., 110 (D24), D24209 (2005).
- 2) Kim KH, Kang CH, Ma CJ, Lee JH, Choi KC, Youn YH. Airborne cadmium in spring season between Asian dust and non-Asian dust periods in Korea. Atmos. Environ., 42, 623–631 (2008).
- 3) Lee PK, Youm SJ, Jo HY. Heavy metal concentrations and contamination levels from Asian dust and identification of sources: a case-study. Chemosphere, 91, 1018–1025 (2013).
- 4) Iwasaka Y, Yamato M, Imasu R, Ono A. Transport of Asian dust (KOSA) particles; importance of weak KOSA events on the geochemical cycle of soil particles. Tellus, 40B, 494–503 (1988).
- 5) Nishikawa M, Kanamori S, Kanamori N, Mizoguchi T. Kosa aerosol as eolian carrier of anthropogenic material. Sci. Total Environ., 107, 13–27 (1991).
- 6) Takami A, Imai T, Shimizu A, Matsui I, Sugimoto N, Hatakeyama S. Transport of anthropogenic and dust aerosol observed at cape Hedo, Okinawa. J. Aerosol Res., 21, 341–347 (2006).
- 7) Watanabe T, Hasei T, Kokunai O, et al. Air pollution with particulate matter and mutagens: relevance of Asian dust to mutagenicity of airborne particles in Japan. Genes Environ., 36, 120–136 (2014).
- 8) Heald CL, Jacob DJ, Park RJ, Alexander B, Fairlie TD, Yantosca RM, Chu DA. Transpacific transport of Asian anthropogenic aerosols and its impact on surface air quality in the United States. J. Geophys. Res., 111, D14310 (2006).
- 9) McKendry IG, Macdonald AM, Leaitch WR, van Donkelaar A, Zhang Q, Duck T, Martin RV. Trans-pacific dust events observed at Whistler, British Columbia during INTEX-B. Atmos. Chem. Phys., 8, 6297–6307 (2008).
- 10) Ueda K, Nitta H, Odajima H. The effects of weather, air pollutants, and Asian dust on hospitalization for asthma in Fukuoka. Environ. Health Prev. Med., 15, 350–357 (2010).
- 11) Watanabe M, Kurai J, Igishi T, Yamasaki A, Burioka N, Takeuchi H, Sako T, Touge H, Nakamoto M, Hasegawa Y, Chikumi H, Matsumoto S, Yamasaki C, Minato S, Ueda Y, Horasaki K, Watanabe T, Shimizu E. Influence of Asian desert dust on lower respiratory tract symptoms in patients with asthma over 4 Years. Yonago Acta Med., 55, 41–48 (2012).
- 12) Park J, Lim MN, Hong Y, Kim WJ. The influence of Asian dust, haze, mist, and fog on hospital visits for airway diseases. Tuberc. Respir Dis. (Seoul), 78, 326–335 (2015).
- 13) Liu ST, Liao CY, Kuo CY, Kuo HW. The effects of PM2.5 from Asian dust storms on emergency room visits for cardiovascular and respiratory diseases. Int. J. Environ. Res. Public Health, 14, 428 (2017).
- 14) Kojima S, Michikawa T, Ueda K, Sakamoto T, Matsui K, Kojima T, Tsujita K, Ogawa H, Nitta H, Takami A. Asian dust exposure triggers acute myocardial infarction. Eur. Heart J., 38, 3202–3208 (2017).
- 15) Hashizume M, Kim Y, Ng CFS, Chung Y, Madaniyazi L, Bell ML, Guo YL, Kan H, Honda Y, Yi SM, Kim H, Nishiwaki Y. Health effects of Asian dust: a systematic review and meta-analysis. Environ. Health Perspect., 128, 66001 (2020).
- 16) Nakamura T, Nishiwaki Y, Hashimoto K, Takeuchi A, Kitajima T, Komori K, Tashiro K, Hasunuma H, Ueda K, Shimizu A, Odajima H, Moriuchi H, Hashizume M. Association between Asian dust exposure and respiratory function in children with bronchial asthma in Nagasaki Prefecture, Japan. Evironon. Health Prev. Med., 25, 8 (2020).
- 17) Hasunuma H, Takeuchi A, Ono R, Amimoto Y, Hwang YH, Uno I, Shimizu A, Nishiwaki Y, Hashizume M, Askew DJ, Odajima H. Effect of Asian dust on respiratory symptoms among children with and without asthma, and their sensitivity. Sci. Total Environ., 753, 141585 (2021).
- 18) Japan Meteorological Agency. “Aging of Kosa observation days.”: ‹https://www.data.jma.go.jp/gmd/env/kosahp/kosa_shindan.html›, accessed 13 March, 2020.
- 19) “MOEJ Real-time DSS information.”: ‹http://www2.env.go.jp/dss/kosa/en/index.html›, accessed 13 March, 2020.
- 20) Sugimoto N, Uno I, Nishikawa M, Shimizu A, Matsui I, Dong X, Chen Y, Quan H. Record heavy Asian dust in Beijing in 2002: observations and model analysis of recent events. Geophys. Res. Lett., 30, 1640 (2003).
- 21) Shimizu A, Sugimoto N, Matsui I, Arao K, Uno I, Murayama T, Kagawa N, Aoki K, Uchiyama A, Yamazaki A. Continuous observations of Asian dust and other aerosols by polarization lidars in China and Japan during ACE-Asia. J. Geophys. Res., 109, D19S17 (2004).
- 22) Kanatani KT, Ito I, Al-Delaimy WK, Adachi Y, Mathews WC, Ramsdell JW. Desert dust exposure is associated with increased risk of asthma hospitalization in children. Am. J. Respir. Crit. Care Med., 182, 1475–1481 (2010).
- 23) Ueda K, Shimizu A, Nitta H, Inoue K. Long-range transported Asian dust and emergency ambulance dispatches. Inhal. Toxicol., 24, 858–867 (2012).
- 24) Higashi T, Kambayashi Y, Ohkura N, Fujimura M, Nakai S, Honda Y, Saijoh K, Hayakawa K, Kobayashi F, Michigami Y, Olando AE, Hitomi Y, Nakamura H. Effects of Asian dust on daily cough occurrence in patients with chronic cough: a panel study. Atmos. Environ., 92, 506–513 (2014).
- 25) Watanabe M, Noma H, Kurai J, Sano H, Mikami M, Yamamoto H, Ueda Y, Touge H, Fujii Y, Ikeda T, Tokuyasu H, Konishi T, Yamasaki A, Igishi T, Shimizu E. Effect of Asian dust on pulmonary function in adult asthma patients in western Japan: a panel study. Allergol. Int., 65, 147–152 (2016).
- 26) Shimizu A, Sugimoto N, Matsui I, Mori I, Nishikawa M, Kido M. Relationship between Lidar-derived dust extinction coefficients and mass concentrations in Japan. SOLA, 7A, 1–4 (2011).
- 27) Sugimoto N, Hara Y, Shimizu A, Yumimoto K, Uno I, Nishikawa M. Comparison of surface observations and a regional dust transport model assimilated with Lidar network data in Asian dust event of March 29 to April 2, 2007. SOLA, 7A, 13–16 (2011).
- 28) Kaneyasu N, Sugimoto N, Shimizu A, Yamamoto S, Kawamoto K. Comparison of lidar-derived dust extinction coefficients and the mass concentrations of surface aerosol. J. Jpn. Soc. Atmos. Environ., 47, 285–291 (2012).
- 29) Funasaka K, Sakai M, Shinya M, Miyazaki T, Kamiura T, Kaneco S, Ohta K, Fujita T. Size distributions and characteristics of atmospheric inorganic particles by regional comparative study in urban Osaka, Japan. Atmos. Environ., 37, 4597–4605 (2003).
- 30) Khan MS, Coulibaly S, Abe M, Furukawa N, Kubo Y, Nakaoji Y, Kawase Y, Matsumoto T, Hasei T, Deguchi Y, Nagaoka H, Yamagishi N, Watanabe M, Honda N, Wakabayashi K, Watanabe T. Seasonal fluctuation of endotoxin and protein concentrations in outdoor air in Sasebo, Japan. Biol. Pharm. Bull., 41, 115–122 (2018).
- 31) Guo YT, Zhang J, Wang SG, Feng S, Xu L. Long-term characterization of major water-soluble inorganic ions in PM10 in coastal site on the Japan sea. J. Atmos. Chem., 68, 299–316 (2011).
- 32) Japan Meteorological Agency. “Data collection of Kosa.”: ‹http://www.data.jma.go.jp/gmd/env/kosahp/kosa_data_index.html›, accessed 3 January, 2020.
- 33) Air Resources Laboratory. “HYSPLIT-Hybrid Single Particle Lagrangian Integrated Trajectory Model.”: ‹http://www.ready.noaa.gov/HYSPLIT.php›, accessed 21 December, 2021.
- 34) Nriagu JO. A global assessment of natural sources of atmospheric trace metals. Nature, 338, 47–49 (1989).
- 35) Tian HZ, Zhu CY, Gao JJ, Cheng K, Hao JM, Wang K, Hua SB, Wang Y, Zhou JR. Quantitative assessment of atmospheric emissions of toxic heavy metals from anthropogenic sources in China: historical trend, spatial distribution, uncertainties, and control policies. Atmos. Chem. Phys., 15, 10127–10147 (2015).
- 36) Wu Y, Lin S, Tian H, Zhang K, Wang Y, Sun B, Liu X, Liu K, Xue Y, Hao J, Liu H, Liu S, Shao P, Luo L, Bai X, Liu W, Wu B, Zhao S. A quantitative assessment of atmospheric emissions and spatial distribution of trace elements natural sources in China. Environ. Pollut., 259, 113918 (2020).
- 37) “bp-stats-review-2020-full-report.”: ‹https://www.bp.com/content/dam/bp/business-sites/en/global/corporate/pdfs/energy-economics/statistical-review/bp-stats-review-2021-full-report.pdf›, accessed 27 June, 2021.
- 38) Dong KY, Sun RJ, Li H, Jiang HD. A review of China’s energy consumption structure and outlook based on a long-range energy alternatives modeling tool. Pet. Sci., 14, 214–227 (2017).
- 39) Cheng K, Wang Y, Tian H, Gao X, Zhang Y, Wu X, Zhu C, Gao J. Atmospheric emission characteristics and control policies of five precedent-controlled toxic heavy metals from anthropogenic sources in China. Environ. Sci. Technol., 49, 1206–1214 (2015).
- 40) Li C, McLinden C, Fioletov V, Krotkov N, Carn S, Joiner J, Streets D, He H, Ren X, Li Z, Dickerson RR. India is overtaking China as the world’s largest emitter of anthropogenic sulfur dioxide. Sci. Rep., 7, 14304 (2017).
- 41) Monn C, Schaeppi G. Concentrations of total suspended particulates, fine particles and their anionic compounds in ambient air and indoor air. Environ. Technol., 14, 869–875 (1993).
- 42) Khoder MI. Atmospheric conversion of sulfur dioxide to particulate sulfate and nitrogen dioxide to particulate nitrate and gaseous nitric acid in an urban area. Chemosphere, 49, 675–684 (2002).
- 43) Wang L, Yang J, Zhang P, Zhao X, Wei Z, Zhang F, Su J, Meng C. A review of air pollution and control in hebei province, China. Open Journal of Air Pollution, 2, 47–55 (2013).
- 44) Xiao C, Zhou J, Wang X, Zhang S. Industrial agglomeration and air pollution: a new perspective from enterprises in Atmospheric Pollution Transmission Channel Cities (APTCC) of Beijing-Tianjin-Hebei and its surrounding areas, China. PLOS ONE, 16, e0255036 (2021).
- 45) Ding AJ, Fu CB, Yang XQ, Sun JN, Zheng LF, Xie YN, Herrmann E, Nie W, Petaj¨a¨ T, Kerminen VM, Kulmala M. Ozone and fine particle in the western Yangtze River Delta: an overview of 1 yr data at the SORPES station. Atmos. Chem. Phys., 13, 5813–5830 (2013).
- 46) Lou CR, Liu HY, Li YF, Li YL. Socioeconomic drivers of PM2.5 in the accumulation phase of air pollution episodes in the Yangtze River Delta of China. Int. J. Environ. Res. Public Health, 13, 928 (2016).
- 47) “Toxicological Profile for Lead, 2020.”: ‹https://www.atsdr.cdc.gov/ToxProfiles/tp13.pdf›, accessed 8 June, 2021.
- 48) “Toxicological Profile for Cadmium, 2012.”: ‹https://www.atsdr.cdc.gov/toxprofiles/tp5.pdf›, accessed 8 June, 2021.
- 49) Xiao Q, Liu Y, Mulholland JA, Russell AG, Darrow LA, Tolbert PE, Strickland MJ. Pediatric emergency department visits and ambient air pollution in the U.S. State of Georgia: a case-crossover study. Environ. Health, 15, 115 (2016).