Abstract
Malignant pleural mesothelioma (MPM) is a malignancy closely associated with asbestos exposure. Although early diagnosis provides a chance of effective treatment and better prognosis, invasive biopsy and cytological procedure are required for definitive diagnosis. In this study, we developed a method to differentiate between MPM and control cell lines, named “amino acid metabolomics,” consisting in the assessment of the balance of their amino acid levels in the cell culture medium. Culture media of MESO-1 (MPM cell line) and Met-5A (control) cells were used in this study to evaluate amino acid levels using HPLC, following the fluorescence derivatization method. The time-dependent changes in amino acid levels were visualized on the score plot following principal component analysis, and the results revealed differential changes in amino acid levels between the two cell culture supernatants. A discriminative model based on linear discriminant analysis could distinguish MPM and control cells.
INTRODUCTION
Malignant pleural mesothelioma (MPM) is a malignant tumor that arises from pleural mesothelial cells. History of asbestos exposure is a major risk factor for MPM and the disease manifests after an incubation period of approximately 40 years.1) Although clinical symptoms, such as pleural effusion, do occur, they are not specific to MPM. Therefore, early detection of MPM is difficult, not only for an aware patient but also for experienced pathologists. Currently, clinical diagnosis is made following interview, palpation, and image monitoring, but biopsy and cytology are essential for a definitive diagnosis of suspected patients.2,3) Therefore, the development of new diagnostic methods for early detection and diagnosis is imperative. In recent years, diagnostic biomarkers present in blood or urine, which can be measured relatively easily, have drawn much attention due to their potential application in early and differential diagnosis in clinical practice. For example, soluble mesothelin-related peptides (SMRP),4,5) soluble cytokeratin 19 fragments (CYFRA) 21-1,5,6) carcinoembryonic antigen (CEA) ratio,6,7) and hyaluronic acid8) have been reported as major blood-based biomarker candidates. However, they can also be expressed in malignant tumors other than MPM (e.g., lung and colon cancer), hence being rather non-specific.3) Therefore, there is a need to identify specific biomarkers for a more accurate diagnosis.
In recent years, targeted metabolomics has been widely applied in clinical diagnosis,9–11) biomarker identification,12,13) drug discovery,14,15) and food quality evaluation.16) Amino acids, either obtained from ingested food or synthesized endogenously, play essential physiological roles as basic metabolites as well as metabolic regulators. Amino acid profiles are influenced by metabolic variations in specific organ systems induced by specific diseases. Although amino acids are the most favorable biomarkers, differences across single amino acids limit the discrimination abilities. In our previous study, we developed a method, called “amino acid metabolomics,” that comprehensively measured amino acid levels in cell culture media and statistically compressed multidimensional information into two dimensions.17–19) It enabled visualization and evaluation of changes in the cell state of several colon and pancreatic cancer cells in a two-dimensional graph, called a score plot. Although metabolomics studies have been conducted on various diseases, only a few have been reported on MPM.20,21) In the present study, we applied the amino acid metabolomics approach to the analysis of samples of malignant mesothelioma and normal mesothelial cells for establishing discrimination model of them. Because it is thought that the malignant mesothelioma cells in the pleural mesothelium lead abnormalities to amino acid levels in the pleural fluid and blood nearby the pleura, our proposed discrimination model based on the amino acid metabolomics using in vitro MPM and control cell samples might be helpful for diagnosis of MPM.
To this end, twenty kinds of proteinogenic amino acids in cell culture medium were determined based on a pre-column derivatization method with o-phthalaldehyde (OPA)/9-fluorenylmethyl chloroformate (FMOC-Cl).22,23) Based on the difference in amino acid levels in culture media, we investigated whether differences in the cell state could be evaluated and estimated which amino acids would be important for distinguishing between malignant mesothelioma and normal mesothelial cells followed by construction of discrimination model.
MATERIALS AND METHODS
MaterialsThe standard amino acid mixture solution type H (2.5 mM each of L-Asp, L-Ser, L-Glu, Gly, L-His, L-Arg, L-Thr, L-Ala, L-Pro, L-Tyr, L-Val, L-Met, L-Lys, L-Ile, L-Leu, L-Phe, and L-cystine [(Cys)2]), L-Trp, OPA, FMOC-Cl, 3-mercaptopropionic acid (MPA), hydrocortisone, insulin, potassium dihydrogen phosphate, dipotassium hydrogen phosphate, boric acid, and sodium hydroxide were purchased from FUJIFILM Wako Pure Chemical Corporation (Osaka, Japan). L-Asn monohydrate and L-Gln were obtained from Tokyo Chemical Industry (Tokyo, Japan). Ultrapure water was produced using a Milli-Q Plus system (Millipore Sigma, Burlington, MA, U.S.A.). All organic solvents were of HPLC grade.
Stock solutions of Asn (250 mM), Gln (250 mM), and Trp (100 mM) were prepared by dissolving the amino acids in 0.1 M hydrochloric acid solution. A standard mixture solution of 20 amino acids (each 2.27 mM) was prepared and diluted further with 0.1 M hydrochloric acid. A stock solution (10 mM) of α-aminobutyric acid (ABA) was prepared in 0.1 M hydrochloric acid and diluted further to 0.1 mM before use.
Solutions of 11 mM MPA and 1.5 mM FMOC-Cl were prepared in 0.1 M borate buffer (pH 9) and acetonitrile, respectively, and 15 mM OPA was prepared by dissolving OPA in a mixture solution consisting of ultrapure water:0.1 M borate buffer:ethanol (40 : 7 : 3, v/v/v). The reagents for derivatization were usable for at least 1 week when stored at 4 °C.
An MPM cell line (MESO-1) and a non-neoplastic mesothelial cell line (Met-5A) were obtained from RIKEN BioResource Research Center Cell Bank (Ibaraki, Japan) and the American Type Culture Collection (Manassas, VA, U.S.A.), respectively. RPMI 1640 medium, Medium 199, and dialyzed fetal bovine serum (FBS) were purchased from Gibco (Auckland, New Zealand). Recombinant human epidermal growth factor was obtained from PeproTech (Cranbury, NJ, U.S.A.).
Cell CultureMESO-1 cells, derived from human MPM, were maintained in RPMI 1640 medium supplemented with 10% dialyzed FBS at 37 °C under 5% CO2. In contrast, Met-5A cells, which are human reactive mesothelial cells, were cultured in Medium 199 supplemented with 10% dialyzed FBS, 1 µg/µL epidermal growth factor, 1.4 mg/µL hydrocortisone, and 10 mg/mL insulin and used as the control. Each culture (maintained) medium for each cell line was used for all cellular experiments. For amino acid metabolomics, both cell lines (4 × 10⁴ cells/mL) were seeded with 100 µL of appropriate culture medium in 96-well plates and placed in an incubator for 24 h for pre-incubation. The medium was changed thereafter, and the cells were further incubated for up to 72 h. After 0, 12, 24, 36, 48, and 72 h, an aliquot (50 µL) of each culture medium of MESO-1 and Met-5A cells was transferred to a 1.5 mL tube containing 0.1 mM ABA (internal standard) solution (50 µL) and 100 µL of acetonitrile (for protein precipitation). After centrifugation at 16000 × g at 4 °C for 5 min, the supernatant was used for derivatization.
Derivatization and HPLC Analysis of Amino AcidsAmino acid analyses were performed on a Shimadzu Nexera X2 system (Shimadzu, Kyoto, Japan) comprised of CBM-20 A system controller, DGU-20SR degassing unit, two LC-30AD pumps, SIL-20AC autosampler, and CTO-10 A column oven, connected to an RF-20 A fluorescence detector. The pre-column derivatization procedure, except for protein precipitation, was conducted on an autosampler, according to a previously reported procedure22) with some modifications. Briefly, 45 µL of MPA solution and 22 µL of OPA solution were added to 7.5 µL of sample solution placed in a polypropylene vial. After mixing and waiting for 1 min, 22 µL of FMOC-Cl solution was added for derivatization of secondary amines and allowed to stand for another 2 min. An aliquot (1 µL) of the reaction mixture was then injected into the HPLC system. An analytical column, namely Kinetex EVO C18 column (100 × 3.0 mm i.d., particle size 2.6 µm; Phenomenex, Torrance, CA, U.S.A.), was kept at a constant column temperature of 35 °C. The mobile phase used consisted of (A) 20 mM phosphate buffer and (B) a mixture of acetonitrile:methanol:ultrapure water (45 : 40 : 15, v/v/v) with a flow rate of 0.85 mL/min. The gradient elution conditions were as follows: 0–1.5 min, 11% B; 1.5–6 min, linear increase from 11 to 22% B; 6–8 min, from 22 to 30% B; 8–10.5 min, from 30 to 53% B; 10.5–12.5 min, 53% B; 12.5–13 min, from 53 to 100% B; 13–17 min, 100% B; 17–17.5 min, linear decrease from 100 to 11% B, followed by a re-equilibration step of 5.5 min under the initial conditions. Fluorescence excitation and emission wavelengths of the detector were set at 350 and 450 nm for OPA derivatives, and 266 and 305 nm for FMOC-Cl derivatives, respectively.
Data were acquired using the LabSolutions LC/GC software package (Shimadzu), with the peak area ratio used to calculate amino acid concentrations by internal standard calibration.
Statistical AnalysisThe difference in amino acid concentrations was observed between the culture media. To avoid any interference on discrimination, the change in the concentration from the initial value in each sample [(concentration in each sample–concentration at 0 h) / concentration at 0 h] was calculated and defined as the “amino acid level.” In all statistical analyses, the amino acid level was imported into SPSS Statistics 27 software (IBM, Armonk, NY, U.S.A.) as an independent variable. All cell-culture experiments were performed independently in duplicate, and amino acid data from the HPLC analysis were applied to the statistical analysis. First, principal component analysis (PCA) was performed to confirm the differences in amino acid profiles across samples. Data were further analyzed using the Mann–Whitney U test and receiver operating characteristics (ROC) analysis for exploring and selecting the potential amino acids for class-discrimination variables. The medians of the amino acid levels of six samples (12–72 h) in each cell line were compared and a p-value <0.05 was considered to indicate a statistically significant difference. A discriminative model for distinguishing the MPM cell line (MESO-1 cell group) from the control (Met-5A cell group) was then constructed using the selected potential variables as independent variables in the linear discrimination analysis. Finally, the applicability of this method for the discrimination of the MESO-1 cell group was assessed using the constructed discriminative model.
RESULTS AND DISCUSSION
Chromatograms of Amino Acids in Cell Culture MediaThe derivatization and LC analysis of amino acids were performed in a fully automated manner using the autosampler pretreatment function of the HPLC system, reducing manual labor and improving accuracy. Figure 1 shows the representative chromatograms depicting peaks corresponding to amino acids and the internal standard in the culture media of MESO-1 and Met-5A cells, obtained after incubation for 72 h. Each amino acid was detected as a single peak within 15 min of injection into the HPLC system, without notable interference from matrix components in the medium. Among the detected amino acids, only Asn was not detected in the Met-5A cell culture medium, probably because Asn was not included in this medium. Therefore, the data of Asn were excluded from subsequent statistical analysis.
Visualization of Differences in Amino Acid Levels with Score Plot Obtained from PCAFigure 2A shows the PCA score plot obtained from the amino acid analysis of MESO-1 and Met-5A cells cultured for 72 h. The sum of contributions of principal component (PC) 1 and PC 2 was 88.6%, which retained sufficient information from the original data. Using the PCA score plot, the differences in amino acid composition between the samples could be visually represented as coordinates on the two-dimensional graphs. The initial (0 h) samples of both cell groups were expressed as a common coordinate point, as these were the reference points for the change in the concentration (amino acid level 0). Under brief incubation conditions, the plots were located closely, regardless of cell type. In contrast, with increasing incubation time, the coordinate positions were gradually distinguished and clustered separately as MESO-1 cell and Met-5A cell groups as per cluster analysis. Furthermore, the plots showed MESO-1 cells to have positive PC2 scores and Met-5A cells to have negative PC2 scores; therefore, the difference between the two cell types could be clearly distinguished using the PC2 score.
The corresponding PCA loading plot is presented in Fig. 2B. In this plot, Arg, Asp, Gln, and Ala, whose PC2 loading values were high, were shown to contribute to the positive PC2 scores of MESO-1 cells, hence suggesting that the changes in amino acid levels may be related to characterization of the cultured MESO-1 cells. In fact, variations of the four amino acid levels in MESO-1 cells during cell culture were different from those in Met-5A cells.
Consequently, using PCA of amino acid levels in cell culture medium, the difference in cell types, such as MESO-1 and Met-5A cells, was found to be represented as variances of amino acid metabolism.
Construction of a Predictive Model from Linear Discrimination AnalysisIn order to create an index for identifying malignant mesothelioma cells, we performed linear discriminant analysis of amino acid data for establishing a discriminative model (discriminant function) for the MESO-1 cell group and Met-5A cell group (as the control). To build a simple and practical discriminant function that can efficiently discriminate between groups with as few independent variables as possible, selection of significant variables would be required. In this study, significant differences in amino acid changes between MESO-1 and Met-5A cell groups were investigated using the Mann–Whitney U test. As shown in Table 1, Glu, Arg, Ala, and (Cys)2 could be selected as significant variables (p < 0.05). Moreover, from the ROC analysis results, Asp seemed to be a statistically significant independent variable.
Table 1. Mann–Whitney
U Test and ROC Analysis of Each Amino Acid
| | Mann–Whitney U test | ROC analysis |
|---|
| | p-Value | AUC | p-Value |
|---|
| 1 | Asp | 0.051 | 0.833 | 0.046 |
| 2 | Glu | 0.002 | 0.976 | 0.004 |
| 4 | Ser | 0.366 | 0.667 | 0.317 |
| 5 | Gln | 1.000 | 0.524 | 0.886 |
| 6 | His | 0.101 | 0.786 | 0.086 |
| 7 | Gly | 0.445 | 0.643 | 0.391 |
| 8 | Thr | 0.138 | 0.762 | 0.116 |
| 9 | Arg | 0.022 | 0.881 | 0.022 |
| 10 | Ala | 0.002 | 0.976 | 0.004 |
| 11 | Tyr | 0.234 | 0.714 | 0.199 |
| 12 | Val | 0.445 | 0.643 | 0.391 |
| 13 | Met | 0.295 | 0.690 | 0.253 |
| 14 | (Cys)2 | 0.001 | 1.000 | 0.003 |
| 15 | Trp | 0.366 | 0.667 | 0.317 |
| 16 | Phe | 0.366 | 0.667 | 0.317 |
| 17 | Ile | 0.628 | 0.595 | 0.568 |
| 18 | Leu | 0.836 | 0.548 | 0.775 |
| 19 | Lys | 0.295 | 0.690 | 0.253 |
| 20 | Pro | 0.731 | 0.571 | 0.668 |
Aspartic acid (Asp); glutamic acid (Glu); serine (Ser); glutamine (Gln); histidine (His); glycine (Gly); threonine (Thr); arginine (Arg); alanine (Ala); tyrosine (Tyr); valine (Val); methionine (Met); cystine (Cys)2; tryptophan (Trp); phenylalanine (Phe); isoleucine (Ile); leucine (Leu); lysine (Lys); proline (Pro)
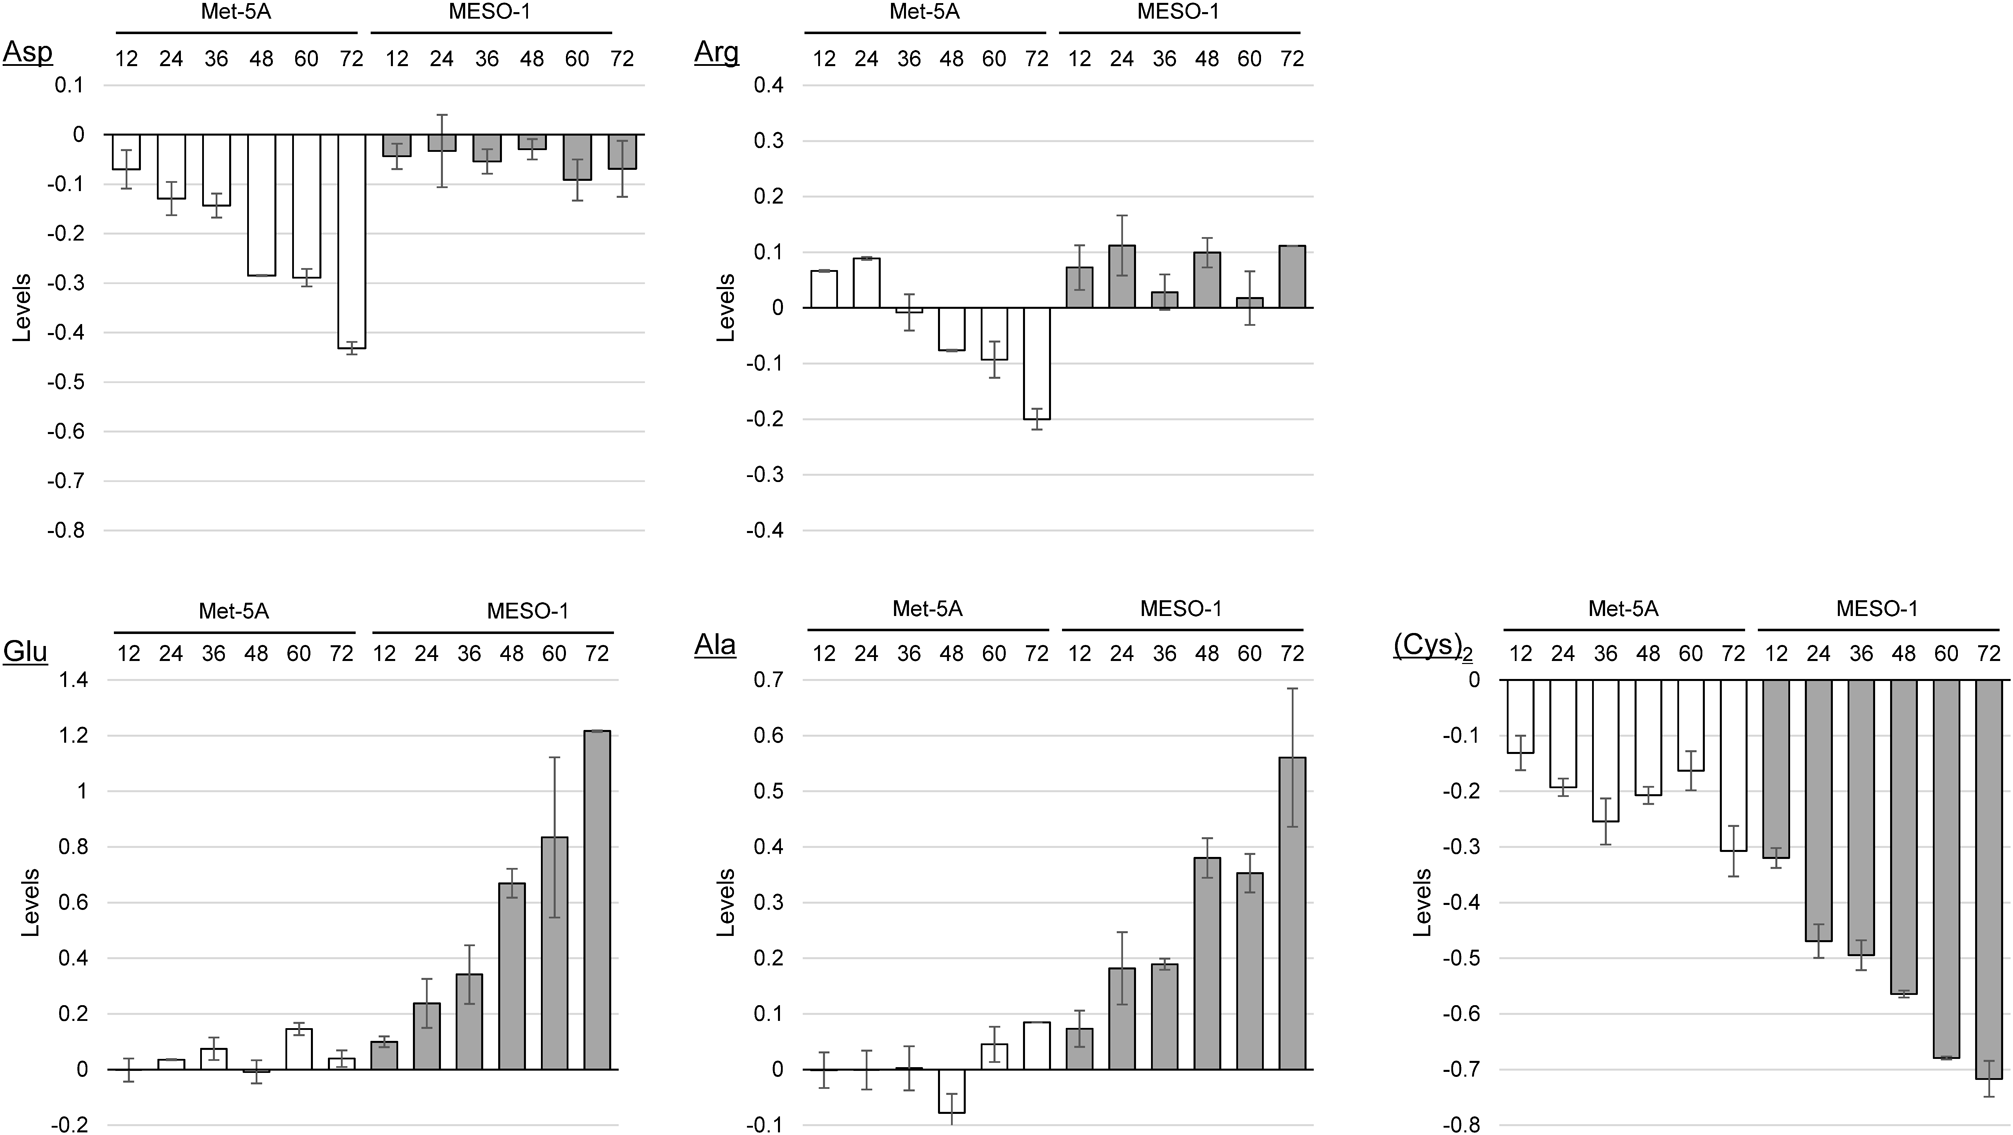
Noteworthy, deficiency in argininosuccinate synthetase in the urea cycle has been found in several MPM cell lines and xenografts.24) Therefore, errors in Asp and Arg metabolism may relate to MPM, considering that they are materials and/or intermediates in the urea cycle.25) In fact, the change in their levels in the MESO-1 cell group was different from that in the Met-5A group (Fig. 3). The levels of Asp and Arg in the Met-5A cell culture medium decreased with increasing incubation time, although it was not so in the MESO-1 cell culture medium.
To the best of our knowledge, there has been no report on Glu, Ala, and (Cys)2 being specifically related to the development and progression of MPM. Ala is generated from Glu and pyruvate by aminotransferase and plays an important role in supplying energy.26,27) The significant increase in Ala concentration in the MESO-1 culture medium was considered to be due to the remarkable proliferative capacity of tumor cells. The Glu level was oppositely increased in the MESO-1 culture medium owing to the anaplerotic glutamine catabolism, called glutaminolysis. (Cys)2 is a major source of cysteine constituting glutathione (GSH), which plays an important role in tumor cells.28,29) Tumor cells need to generate large amounts of intracellular GSH to avoid oxidative stress caused by excessive proliferation and enhanced metabolism.30) Thus, the level of (Cys)2 was significantly decreased in the MESO-1 cell culture medium compared to that in the Met-5A cell culture medium.
Using the obtained five significant variables, namely Asp, Glu, Arg, Ala, and (Cys)2, a discriminative model was proposed, by discrimination analysis, to distinguish the MESO-1 cell group from the Met-5A cell group; the equation is outlined below:
where Y represents discriminant score, and Xamino acid represents the levels of each amino acid
The positive discrimination score denotes the Met-5A cell group, whereas the negative score denotes the MESO-1 cell group. A strong correlation was observed between the scores calculated using the above model equation and the sample groups (correlation ratio η = 0.952). As shown in Fig. 4, the area under the curve (AUC) obtained from the ROC curve of the proposed model was 1.000, which was higher than that obtained from the respective selected amino acid. However, future studies should carefully explore the selection of significant variables because the current study was only a limited study performed in vitro with MPM and control cell samples.
Furthermore, the applicability of the proposed model to the discrimination of malignant mesothelioma cells was confirmed using amino acid data obtained from other duplicated experiments. Almost all samples were confirmed to be correctly classified as malignant mesothelioma, except for one misidentified case in the MESO-1 cell group (sensitivity and specificity were 86 and 100%, respectively). The results indicated that the proposed model is effective for the discrimination of MPM cell lines from control cell lines.
CONCLUSIONS
In this study, the time-dependent changes in MESO-1 and Met-5A cells were visualized on the score plot of amino acid levels obtained using PCA. Five amino acids (Asp, Glu, Arg, Ala, and [Cys]2) were identified from the Mann–Whitney U test and ROC analysis as potential class-discriminating variables. Furthermore, a discriminative model was established in vitro for the MPM cell line from the control based on amino acid metabolomics, and it was successfully for the classification of malignant mesothelioma cells, suggesting its application in MPM diagnosis. We believe this method would contribute to the development of a new auxiliary diagnostic technique through further investigation of clinical specimens; studies in this regard are currently in progress.
Acknowledgments
This work was supported in part by Fukuoka Foundation for Sound Health Cancer Research Fund, JSPS KAKENHI (Grant No. 19K20720), and Fukuoka University (Grant No. 201032).
Conflict of Interest
The authors declare no conflict of interest.
Supplementary Materials
This article contains supplementary materials.
REFERENCES
- 1) Bianco A, Valente T, De Rimini ML, Sica G, Fiorelli A. Clinical diagnosis of malignant pleural mesothelioma. J. Thorac. Dis., 10 (Suppl. 2), S253–S261 (2018).
- 2) Schumann SO, Kocher G, Minervini F. Epidemiology, diagnosis and treatment of the malignant pleural mesothelioma, a narrative review of literature. J. Thorac. Dis., 13, 2510–2523 (2021).
- 3) Szolkowska M, Blasinska-Przerwa K, Knetki-Wroblewska M, Rudzinski P, Langfort R. Malignant pleural mesothelioma: main topics of american society of clinical oncology clinical practice guidelines for diagnosis and treatment. J. Thorac. Dis., 10 (Suppl. 17), S1966–S1970 (2018).
- 4) Gao R, Wang F, Wang Z, Wu Y, Xu L, Qin Y, Shi H, Tong Z. Diagnostic value of soluble mesothelin-related peptides in pleural effusion for malignant pleural mesothelioma: an updated meta-analysis. Medicine (Baltim.), 98, e14979 (2019).
- 5) Niu Y, Hu Z-D. Diagnostic accuracy of pleural effusion biomarkers for malignant pleural mesothelioma: a machine learning analysis. J. Lab. Precis. Med., 6, 4 (2021).
- 6) Suzuki H, Hirashima T, Kobayashi M, Sasada S, Okamoto N, Uehara N, Tamiya M, Matsuura Y, Morishita N, Kawase I. Cytokeratin 19 fragment/carcinoembryonic antigen ratio in pleural effusion is a useful marker for detecting malignant pleural mesothelioma. Anticancer Res., 30, 4343–4346 (2010).
- 7) Hackner K, Errhalt P, Handzhiev S. Ratio of carcinoembryonic antigen in pleural fluid and serum for the diagnosis of malignant pleural effusion. Ther. Adv. Med. Oncol., 11, 1758835919850341 (2019).
- 8) Agostinis C, Vidergar R, Belmonte B, Mangogna A, Amadio L, Geri P, Borelli V, Zanconati F, Tedesco F, Confalonieri M, Tripodo C, Kishore U, Bulla R. Complement protein C1q binds to hyaluronic acid in the malignant pleural mesothelioma microenvironment and promotes tumor growth. Front. Immunol., 8, 1559 (2017).
- 9) Liu Y, Song X, Liu X, Pu J, Gui S, Xu S, Tian L, Zhong X, Zhao L, Wang H, Liu L, Xu G, Xie P. Alteration of lipids and amino acids in plasma distinguish schizophrenia patients from controls: a targeted metabolomics study. Psychiatry Clin. Neurosci., 75, 138–144 (2021).
- 10) Tsoukalas D, Fragoulakis V, Papakonstantinou E, Antonaki M, Vozikis A, Tsatsakis A, Buga AM, Mitroi M, Calina D. Prediction of autoimmune diseases by targeted metabolomic assay of urinary organic acids. Metabolites, 10, 502 (2020).
- 11) Jasbi P, Wang D, Cheng SL, Fei Q, Cui JY, Liu L, Wei Y, Raftery D, Gu H. Breast cancer detection using targeted plasma metabolomics. J. Chromatogr. B Analyt. Technol. Biomed. Life Sci., 1105, 26–37 (2019).
- 12) Gong LL, Yang S, Zhang W, Han FF, Xuan LL, Lv YL, Liu H, Liu LH. Targeted metabolomics for plasma amino acids and carnitines in patients with metabolic syndrome using HPLC-MS/MS. Dis. Markers, 2020, 8842320 (2020).
- 13) Lee HS, Park TJ, Kim JM, Yun JH, Yu HY, Kim YJ, Kim BJ. Identification of metabolic markers predictive of prediabetes in a Korean population. Sci. Rep., 10, 22009 (2020).
- 14) Feng L, Gao M, Zhai Y, Li X, Wang Y, Xie T, Yao W, Shan J, Zhang L, Ding A. A novel strategy based on targeted cellular metabolomics for quantitatively evaluating anti-aging effect and screening effective extracts of Erzhi Wan. J. Chromatogr. B Analyt. Technol. Biomed. Life Sci., 1178, 122857 (2021).
- 15) Liu J, Luo X, Guo R, Jing W, Lu H. Cell metabolomics reveals berberine-inhibited pancreatic cancer cell viability and metastasis by regulating citrate metabolism. J. Proteome Res., 19, 3825–3836 (2020).
- 16) Brigante FI, Lucini Mas A, Pigni NB, Wunderlin DA, Baroni MV. Targeted metabolomics to assess the authenticity of bakery products containing chia, sesame and flax seeds. Food Chem., 312, 126059 (2020).
- 17) Tomita R, Todoroki K, Hayama T, Yoshida H, Fujioka T, Nakashima M, Yamaguchi M, Nohta H. Assessment of anticancer drug effects on pancreatic cancer cells under glucose-depleted conditions using intracellular and extracellular amino acid metabolomics. Biol. Pharm. Bull., 41, 220–228 (2018).
- 18) Tomita R, Todoroki K, Maruoka H, Yoshida H, Fujioka T, Nakashima M, Yamaguchi M, Nohta H. Amino acid metabolomics using LC-MS/MS: assessment of cancer-cell resistance in a simulated tumor microenvironment. Anal. Sci., 32, 893–900 (2016).
- 19) Tomita R, Todoroki K, Machida K, Nishida S, Maruoka H, Yoshida H, Fujioka T, Nakashima M, Yamaguchi M, Nohta H. Assessment of the efficacy of anticancer drugs by amino acid metabolomics using fluorescence derivatization-HPLC. Anal. Sci., 30, 751–758 (2014).
- 20) Li N, Yang C, Zhou S, Song S, Jin Y, Wang D, Liu J, Gao Y, Yang H, Mao W, Chen Z. Combination of plasma-based metabolomics and machine learning algorithm provides a novel diagnostic strategy for malignant mesothelioma. Diagnostics (Basel), 11, 1281 (2021).
- 21) Di Gregorio E, Miolo G, Saorin A, Muraro E, Cangemi M, Revelant A, Minatel E, Trovò M, Steffan A, Corona G. Radical hemithoracic radiotherapy induces systemic metabolomics changes that are associated with the clinical outcome of malignant pleural mesothelioma patients. Cancers (Basel), 13, 508 (2021).
- 22) Azuma K, Hirao Y, Hayakawa Y, Murahata Y, Osaki T, Tsuka T, Imagawa T, Okamoto Y, Ito N. Application of pre-column labeling liquid chromatography for canine plasma-free amino acid analysis. Metabolites, 6, 3 (2016).
- 23) Schwarz EL, Roberts WL, Pasquali M. Analysis of plasma amino acids by HPLC with photodiode array and fluorescence detection. Clin. Chim. Acta, 354, 83–90 (2005).
- 24) Lam SK, Li YY, Xu S, Leung LL, U KP, Zheng YF, Cheng PN, Ho JC. Growth suppressive effect of pegylated arginase in malignant pleural mesothelioma xenografts. Respir. Res., 18, 80 (2017).
- 25) Keshet R, Szlosarek P, Carracedo A, Erez A. Rewiring urea cycle metabolism in cancer to support anabolism. Nat. Rev. Cancer, 18, 634–645 (2018).
- 26) Lieu EL, Nguyen T, Rhyne S, Kim J. Amino acids in cancer. Exp. Mol. Med., 52, 15–30 (2020).
- 27) Moreno-Sánchez R, Rodríguez-Enríquez S, Marín-Hernández A, Saavedra E. Energy metabolism in tumor cells. FEBS J., 274, 1393–1418 (2007).
- 28) Guo W, Li K, Sun B, et al. Dysregulated glutamate transporter SLC1A1 propels cystine uptake via Xc- for glutathione synthesis in lung cancer. Cancer Res., 81, 552–566 (2021).
- 29) Martin L, Gardner LB. Stress-induced inhibition of nonsense-mediated RNA decay regulates intracellular cystine transport and intracellular glutathione through regulation of the cystine/glutamate exchanger SLC7A11. Oncogene, 34, 4211–4218 (2015).
- 30) Lv H, Zhen C, Liu J, Yang P, Hu L, Shang P. Unraveling the potential role of glutathione in multiple forms of cell death in cancer therapy. Oxid. Med. Cell. Longev., 2019, 3150145 (2019).