Abstract
Colorectal cancer (CRC) is one of the common types of cancer in humans. Prostaglandin E2 (PGE2) is a well-known mediator of colorectal cancer through stimulation of four E-type prostanoid (EP) receptor subtypes: EP1, EP2, EP3, and EP4 receptors. All subtypes of EP receptors are involved in CRC promotion or malignancy. However, the characteristics of CRC that highly expresses EP receptor subtypes have not been clarified. In the present study, we classified CRC from a cancer genomic database and identified CRC clusters which highly express EP receptor subtypes. Most of these clusters predominantly expressed one subtype of EP receptor and showed different gene expression patterns. Among them, we focused on the cluster highly expressing the EP3 receptor (CL-EP3). As the result of characterization of gene expression, CL-EP3 was characterized as: epithelial mesenchymal transition (EMT)-induced progressed cancer with activation of transforming growth factor-β pathway, activation of hypoxia-inducible factor-1α, and suppression of runt-related transcription factor 3. Since we previously reported that EP3 receptor is involved in and induce colon cancer cell migration, EP3 receptor-expressing CRC may induce metastasis through these signaling pathways. Thus, the findings suggest the effectiveness of cancer clustering by gene expression of the EP receptor subtype to elucidate the mechanism of human CRC.
INTRODUCTION
Colorectal cancer (CRC) is the third most commonly diagnosed cancer, and is a major cause of cancer-associated deaths in the world.1) Prostaglandin E2 (PGE2), synthesized by cyclooxygenases from arachidonic acid, is a well-known mediator of colorectal cancer. It has been reported that an increase in the production of PGE2 is one of the hallmarks of CRC.2) PGE2 is the primarily ligand for four subtypes of E-type prostanoid (EP) receptor: EP1, EP2, EP3, and EP4 receptors, and signals downstream of these receptor subtypes are considered to be responsible for CRC development and malignancy.3)
EP receptor subtypes are seven-transmembrane G protein-coupled receptors which are highly conserved among mammalian species.4) EP1 receptor signaling is considered to be coupled to phospholipase C/inositol trisphosphate signaling, whereas EP2 and EP4 receptor signaling generates increased intracellular cAMP levels via coupling to Gs proteins.2) Additionally, we previously reported that the EP4 receptor is also coupled to Gi protein and activates different and additional intracellular signals from the EP2 receptor.5) The EP3 receptor has generally been considered to couple to Gi protein, leading to a reduction in intracellular cAMP levels.2) Knockout mouse studies have suggested that all subtypes of EP receptors are involved in the pathophysiology of CRC.3) Although there are some reports that EP3 receptors suppress CRC,6,7) EP3 receptor signaling have been reported to be involved in tumor-associated angiogenesis.8) Indeed, we previously reported that the stimulation of EP3 receptor subtypes promote colon cancer cell migration via inductions of vascular endothelial growth factor (VEGF) and VEGF receptor-1 (VEGFR-1).9,10) However, the characteristics of the genetic responses of patients with CRC that highly expresses EP receptor subtypes have not been clarified.
In the present study, we performed in silico analysis of gene expression data of CRC in The Cancer Genome Atlas (TCGA) database and identified 5 types of CRC clusters with high-level expression of EP receptor subtypes (EPhigh clusters) and distinctly different gene expression patterns from each other. We focused on the CRC cluster that most prominently expresses the EP3 receptor with distinctly different gene responses from other clusters. Biological characterization of CRC with high-level expression of the EP3 receptor showed a high possibility to induce epithelial mesenchymal transition (EMT) with activation and suppression of pathways such as the transforming growth factor-β (TGF-β) pathway, hypoxia-inducible factor-1α (HIF-1α), and runt-related transcription factor 3 (RUNX3). Stimulation of EP3 receptors may promote cancer malignancy through these metastasis mechanisms in actual CRC patients.
MATERIALS AND METHODS
Clustering Analysis of Human CRCGene expression data of human colorectal cancer were obtained from Genomic Data Commons (GDC) Data Portal (portal.gdc.cancer.gov). The gene expression counts analyzed by HTSeq11) of 622 CRC tissues in colon adenocarcinoma (COAD) and rectum adenocarcinoma (READ) datasets were obtained and transcripts per kilobase million (TPM) value of all genes were calculated using gene lengths in the human genome (GRCh38) with R program (version 3.4.1). For clustering analysis, TPM of EP1, EP2, EP3, and EP4 receptor genes (PTGER1, PTGER2, PTGER3, and PTGER4, respectively) of each patient were normalized by the Min-Max scaling method and used for the k-means spectral clustering method.
Determination of Differentially Expressed Genes (DEGs)Gene expression changes of all genes in EPhigh clusters (CL-EP4, CL-EP2/4, CL-EP2, CL-EP1, and CL-EP3) were measured based on the gene expression level of the EPlow cluster (CL-EPlow) using the R package edgeR12) (version 3.34.0), and the fold change log-value (log2FC), count per million log-value (log2CPM), p-value, and false discovery rate (FDR) of all genes were calculated. Genes with log2FC ≥1 (up-regulated) or log2FC ≤−1 (down-regulated) and log2CPM >0 and FDR <0.05 were defined as DEGs. A heatmap was drawn based on the log2FC value of the top 100 and bottom 100 genes in each EPhigh cluster (671 genes after duplicate deletion) using z-score normalization.
Gene Set Enrichment Analysis (GSEA)Gene sets associated with CRC promotion were obtained from public data reported by Guinney et al.13) GSEA of EPhigh clusters was performed using the log2FC value of all genes by the R package fgsea14) (version 1.18.0), and normalized enrichment score (NES), and the p-value of each gene set was calculated. Positive or negative NES indicated up- or down-regulated gene sets, respectively. Gene sets with a p-value <0.05 were considered significant.
Upstream Regulator Analysis of Transcription FactorsUpstream regulator analysis of EPhigh clusters was performed using Ingenuity Pathway Analysis (IPA) software15) (version 70750971, Ingenuity Systems, Inc., Redwood City, CA, U.S.A.) using the log2FC value of each DEG. In CL-EP3, DEGs with log2FC ≥2.5 or log2FC ≤−2.5 and log2CPM >0 and FDR <0.05 were used in analysis to narrow down the correlated genes to analyze. Z-scores and p-values of genes associated with CRC and EMT were extracted.16–18) Genes with a p-value <0.05 were considered significant.
RESULTS AND DISCUSSION
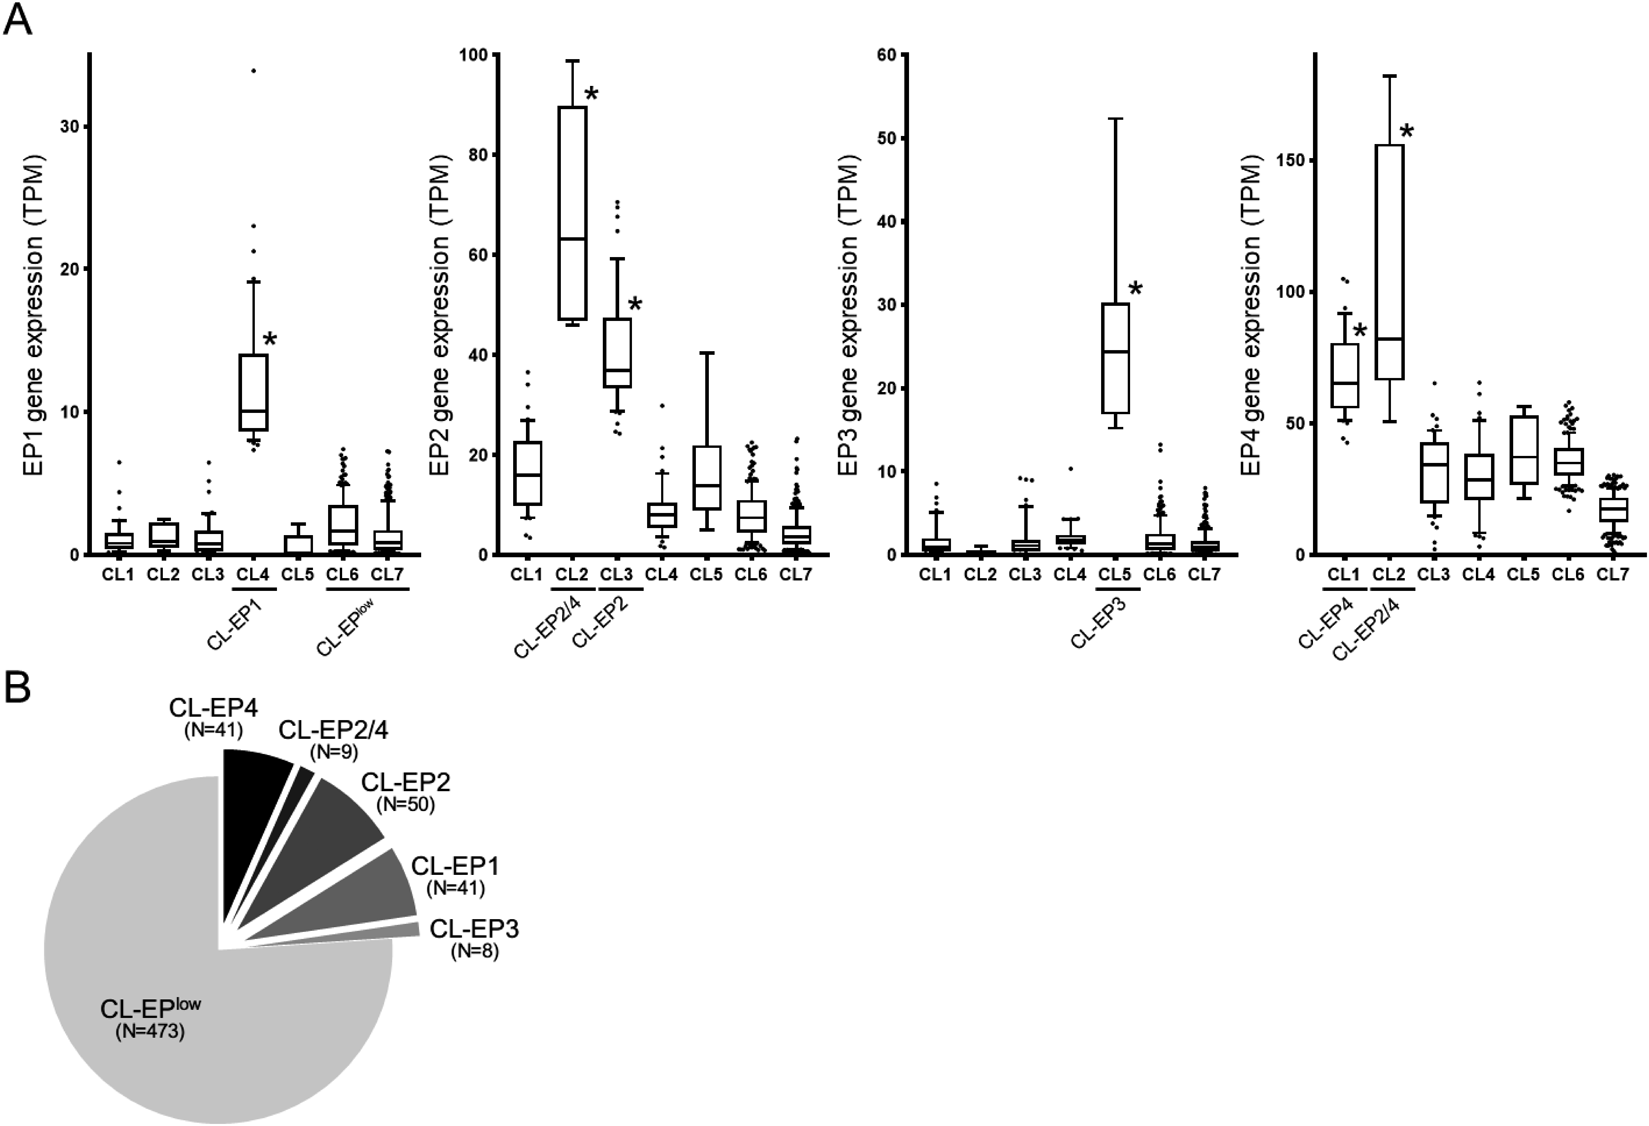
Identification of CRC Clusters with High Expression of EP Receptor SubtypesGene expression data of 622 CRC patients were obtained from the TCGA database. To classify cancers by EP receptor subtype expression, clustering analysis using the gene expression level of each EP receptor subtype gene was performed. Based on the cluster number prediction by elbow plot and classification evaluation by principal component analysis (PCA) (Supplementary Fig. 1), we divided CRC into 7 clusters from CL1 to CL7. The gene expression of each EP receptor subtype in CL1 to CL7 was compared by boxplot, and we found that the expression patterns of EP receptor subtypes in CL1 to CL5 were clearly different from each other (Fig. 1A). CL1, CL3, CL4, and CL5 highly expressed predominantly one type of receptor subtype: EP4, EP2, EP1, and EP3 receptors, respectively, while CL2 highly expressed both EP2 and EP4 receptors. CL7 showed obviously low gene expression level for all EP receptor subtypes. CL6 showed slightly higher gene expression levels for EP1, EP2, and EP4 receptors than CL7, but clearly lower than CL1 to CL5. We identified CL1-5 as EPhigh clusters (CL1 as CL-EP4, 41 samples; CL2 as CL-EP2/4, 9 samples; CL3 as CL-EP2, 50 samples; CL4 as CL-EP1, 41 samples; CL5 as CL-EP3, 8 samples) and CL6-7 as a EPlow cluster (CL-EPlow, 473 samples) (Fig. 1B). Approximately 24% of CRC (149 of total 622) are EP receptor-highly expressing cancers.
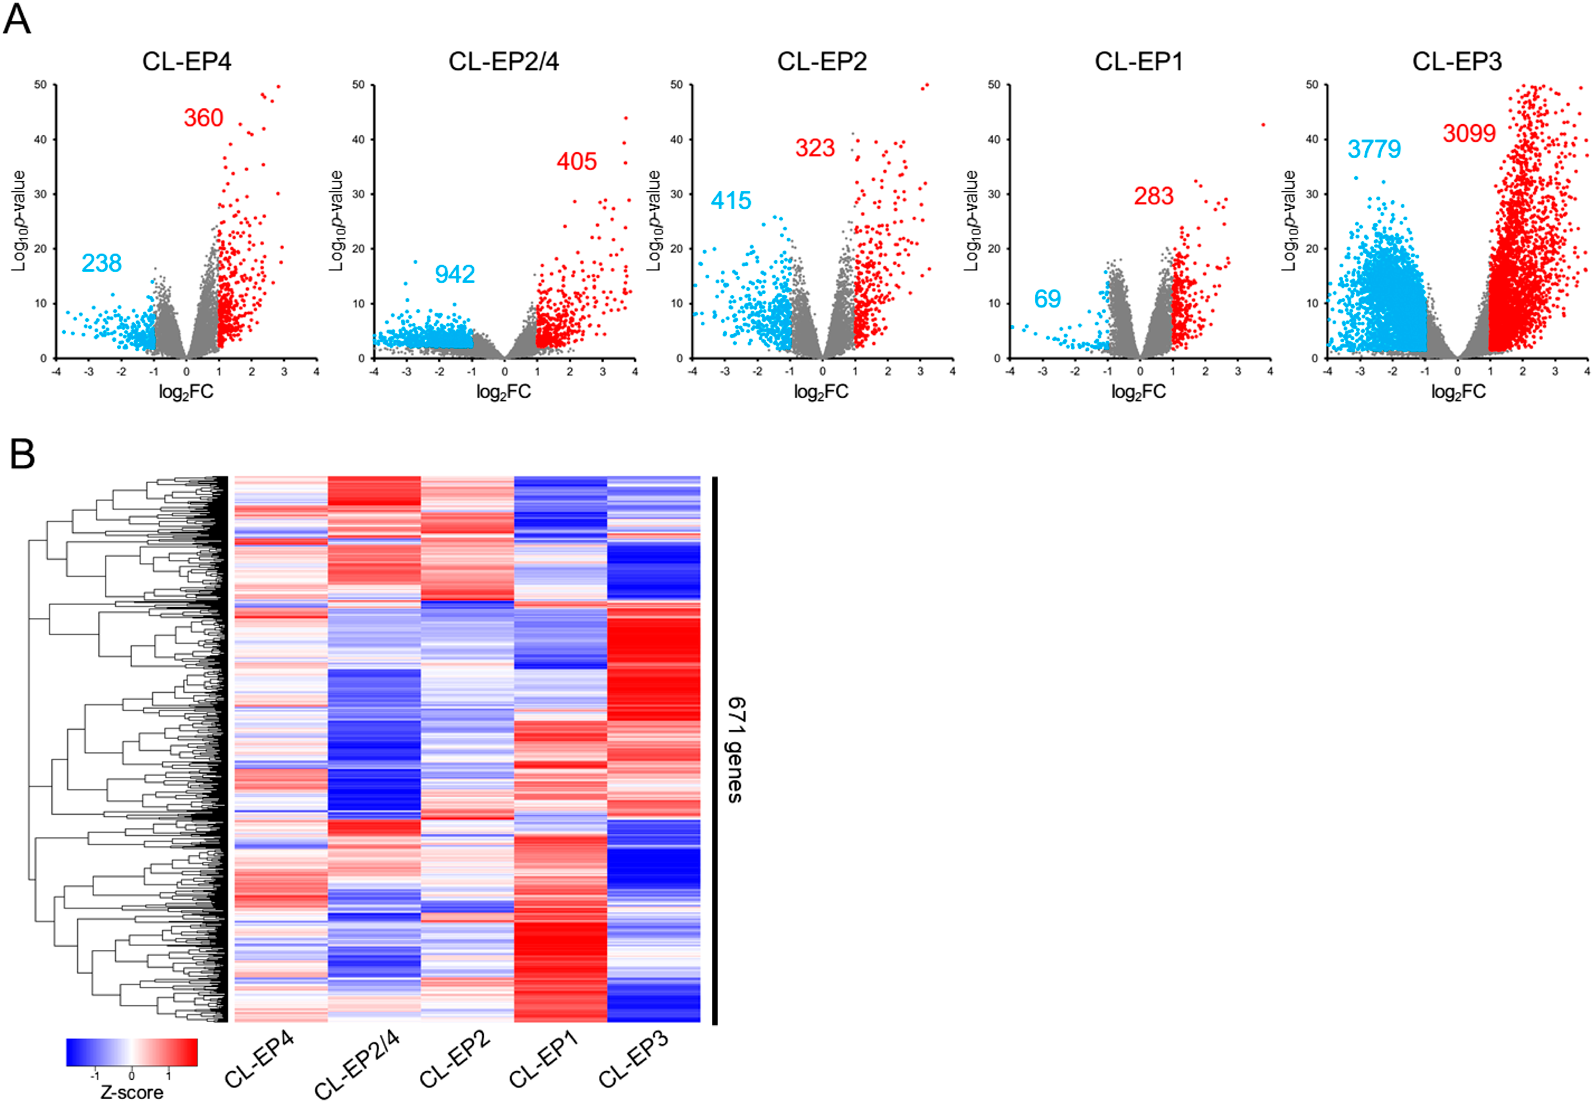
Comparison of Expression Pattern of DEGs in EPhigh ClustersTo compare gene expression patterns among EPhigh clusters, we extracted DEGs, differentially up- or down-regulated genes, of each EPhigh cluster based on the gene expression pattern of CL-EPlow. Volcano plots of identified DEGs indicated that each EPhigh cluster shows a different gene expression pattern (Fig. 2A). A heatmap showed that there was almost no gene commonly up- or down-regulated across all EPhigh clusters (Fig. 2B), indicating that EPhigh clusters showed distinctly different gene expression patterns from each other.
We also analyzed the expression patterns of PGE synthases genes (PTGES, PTGES2 and PTGES3) and cyclooxygenases genes (PTGS1 and PTGS2), which are involved in PGE2 synthesis. Additionally, 15-hydroxyprostaglandin dehydrogenase gene (HPGD), which is involved in metabolism of prostaglandins including PGE2, was also analyzed (Supplementary Fig. 2). Among these genes analyzed, there was no significant differences among the clusters in terms of the expressions of PTGES and HPGD. In the case of the expression levels of PTGES3, all the clusters showed similar expression levels except for CL-EP1, which was significantly lower than CL-EPlow. However, the expression levels of PTGES2, CL-EP1 showed significantly higher, while CL-EP4 and CL-EP3 showed significantly lower than CL-EPlow. In the case of PTGS1 expressions, CL-EP4, CL-EP1 and CL-EP3 showed significantly higher than CL-EPlow, while CL-EP2 and CL-EP3 showed significantly higher expression levels of PTGS2. According to the results shown in Supplementary Fig. 2, each CL-EPhigh cluster has at least one set of PTGES and PTGS. Thus, PGE2 is plausibly synthesized in all the clusters so that, overall, PGE2 may be able to activate its signaling pathway(s) via each highly expressing signature EP receptor subtype of each cluster.
As shown in Fig. 2A, the largest number of DEGs was identified in CL-EP3 (3779 down-regulated genes and 3099 up-regulated genes), indicating that EP3 receptor stimulation may invoke a genetic response different from other forms of CRC. Since we previously reported the stimulation of EP3 receptor subtypes promotes colon cancer-cell migration,5,9,10) we focused on analysis of the biological characteristics of gene expression in CL-EP3 associated with CRC.
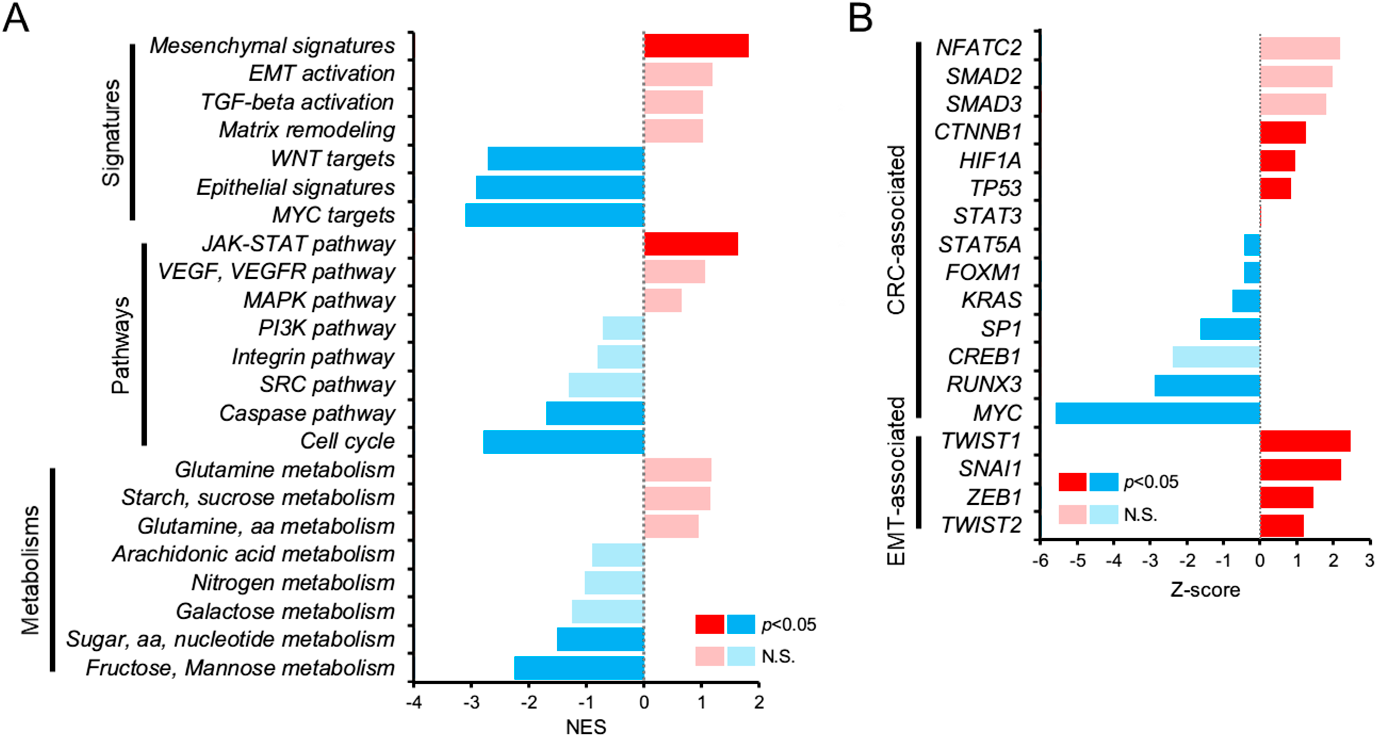
Biological Characterization of Gene Expression of CL-EP3We estimated the up- or down-regulation of gene sets by GSEA (Fig. 3A) and predicted activation or suppression of transcriptional factors by upstream regulator analysis (Fig. 3B) associated with CRC in CL-EP3. As shown in Fig. 3A, gene sets of Mesenchymal signatures, EMT activation, and Matrix remodeling were up-regulated while that of Epithelial signatures was down-regulated in CL-EP3. Additionally, as shown in Fig. 3B, activation of EMT-inducing transcriptional factors, TWIST1, SNAI1, ZEB1, TWIST2, was detected, indicating that CRC in CL-EP3 was characterized as a strongly EMT-induced mesenchymal-type cancer.
Of particular interest, gene set of VEGF, VEGFR pathway was up-regulated in CL-EP3 (Fig. 3A), which is consistent with previous reports including ours that stimulation of the EP3 receptor induces VEGF and VEGFR-1 in EP3 receptor stably-expressing HEK293 cells, human colorectal cancer HCA-7 cells and sarcoma-180 cells.8–10) Additionally, transcriptional factor HIF1A was activated in CL-EP3 (Fig. 3B). We previously reported that human CRC switches from an EP4 receptor-dominant state to EP3 receptor-dominant state through increasing activation of HIF-1α expression as cancer cell proliferation.5) Since the expression of EP4 receptors was down-regulated when HIF-1α expression was up-regulated, PGE2 may switch activities from EP4 to EP3 receptors. Therefore, CRC in CL-EP3 was considered to be an EP3 receptor-dominant progressed cancer following HIF-1α activation.
Activation of the TGF-β pathway was also recognized with up-regulation of TGF-beta activation gene set (Fig. 3A) and activation of downstream transcriptional factors of TGF-β signaling, SMAD2 and SMAD3 (Fig. 3B). It has been reported that inhibition of EP3 receptor viability and migration of non-small cell lung cancer occur through suppression of the TGF-β/Smad signaling pathway.19) Additionally, RUNX3, reported as a tumor inhibitor that is frequently inactivated in human cancers,20) was suppressed in CL-EP3 (Fig. 3B). Since it has been reported that activation of the TGF-β pathway and inhibition of RUNX3 induce EMT in CRC,21,22) cancers in CL-EP3 may have promoted EMT through these pathways.
Gene sets of Cell cycle and Sugar, aa, nucleotide metabolism were significantly down-regulated (Fig. 3A), suggesting the possibility that cell growth of CL-EP3 is lower than for other types of CRC. Interestingly, gene sets of WNT targets and MYC targets were down-regulated (Fig. 3A) and suppression of MYC was also detected (Fig. 3B), indicating that these well-known pathways reported to promote CRC proliferation17) may not be necessary for cancers in CL-EP3. It is widely known that in proliferating early-stage CRC, EP4 receptor signals dominantly regulate β-catenin activity,23) which is a downstream transcriptional factor of the WNT pathway, and that EP4 receptor expression decreases with activation of HIF-1α and/or suppression of MYC.5,24) Again, deactivation of the WNT pathway and MYC activity in CL-EP3 indicated that these cancers may be EP3 receptor-dominant CRC following down-regulation of the EP4 receptor.
As the result of analysis of genetic characteristics, CRC in CL-EP3 was characterized as EMT-induced cancer with inhibition of cell proliferation. Significant suppression of RUNX3 and MYC and activation of SNAI1, ZEB1, and TWIST2 were detected only in CL-EP3 but not in other CL-EPhigh clusters (data not shown), supporting the correlation between EP3 receptor signaling and EMT promotion. It is unclear whether all of these gene responses of CRC in CL-EP3 are due to enhanced signaling of the EP3 receptor. On the other hands, it has been reported that EP3 receptors were down-regulated in colorectal cancer and activation of EP3 receptors could suppress function of CRC cells,6,7) suggesting a tumor-suppressive role for EP3 receptors in CRC.25) However, due to the abundant number of DEGs detected in this cluster, this analysis indicated the possibility of that EP3 receptor stimulation may induce marked genetic responses such as inhibition of RUNX3 or activation of the TGF-β pathway, followed by EMT and CRC metastases.
CONCLUSION
In the present study, we identified 5 types of EPhigh clusters from CRC of the cancer genomic database. Although these CRC made up only one quarter of the total CRC patients, most of these clusters primarily expressed a single EP receptor subtype and showed a different genetic response. Analysis of gene expression of the cluster with high-level expression of the EP3 receptor subtype indicated the possibility that EP3 receptor stimulation induces EMT through signaling such as HIF-1α activation, TGF-β activation, or RUNX3 inhibition. Of note, since in sillico analysis in this study was performed with a limited number of cancer samples, it is necessary to test the hypothesis by performing in vitro/vivo studies. Furthermore, follow-up experiments using appropriate model cells are needed to elucidate the mechanism of the EP3 receptor-related CRC in the future. Nevertheless, these findings shed light on the importance of cancer clustering by gene expression of each EP receptor subtype to elucidate the PGE2-related mechanisms involving at least one quarter of human CRC.
Acknowledgments
This work was supported by a JSPS KAKENHI Grant (Young Scientists, 19K16374). The results shown here are in whole or part based upon data generated by the TCGA Research Network: https://www.cancer.gov/tcga. This study was supported by Support Center for Advanced Medical Sciences, Tokushima University Graduate School of Biomedical Sciences.
Conflict of Interest
The authors declare no conflict of interest.
Supplementary Materials
This article contains supplementary materials. The results of elbow plot and PCA are available in Supplementary Fig. 1. The results of gene expression analysis involved in PGE2 synthesis and metabolism are available in Supplementary Fig. 2.
REFERENCES
- 1) Torre LA, Bray F, Siegel RL, Ferlay J, Lortet-Tieulent J, Jemal A. Global cancer statistics, 2012: Global Cancer Statistics, 2012. CA Cancer J. Clin., 65, 87–108 (2015).
- 2) Hull MA, Ko SCW, Hawcroft G. Prostaglandin EP receptors: targets for treatment and prevention of colorectal cancer? Mol. Cancer Ther., 3, 1031–1039 (2004).
- 3) Sugimoto Y, Narumiya S, Prostaglandin E receptors. J. Biol. Chem., 282, 11613–11617 (2007).
- 4) Funk CD. Prostaglandins and leukotrienes: advances in eicosanoid biology. Science, 294, 1871–1875 (2001).
- 5) Fujino H. The Roles of EP4 prostanoid receptors in cancer malignancy signaling. Biol. Pharm. Bull., 39, 149–155 (2016).
- 6) Zhu J, Trillsch F, Mayr D, Kuhn C, Rahmeh M, Hofmann S, Vogel M, Mahner S, Jeschke U, von Schönfeldt V. Prostaglandin receptor EP3 regulates cell proliferation and migration with impact on survival of endometrial cancer patients. Oncotarget, 9, 982–994 (2018).
- 7) Macias-Perez IM, Zent R, Carmosino M, Breyer MD, Breyer RM, Pozzi A. Mouse EP3 α, β, and γ receptor variants reduce tumor cell proliferation and tumorigenesis in vivo. J. Biol. Chem., 283, 12538–12545 (2008).
- 8) Amano H, Hayashi I, Endo H, Kitasato H, Yamashina S, Maruyama T, Kobayashi M, Satoh K, Narita M, Sugimoto Y, Murata T, Yoshimura H, Narumiya S, Majima M. Host prostaglandin E2-EP3 signaling regulates tumor-associated angiogenesis and tumor growth. J. Exp. Med., 197, 221–232 (2003).
- 9) Taniguchi T, Fujino H, Israel DD, Regan JW, Murayama T. Human EP3I prostanoid receptor induces VEGF and VEGF receptor-1 mRNA expression. Biochem. Biophys. Res. Commun., 377, 1173–1178 (2008).
- 10) Fujino H, Toyomura K, Chen X, Regan JW, Murayama T. Prostaglandin E2 regulates cellular migration via induction of vascular endothelial growth factor receptor-1 in HCA-7 human colon cancer cells. Biochem. Pharmacol., 81, 379–387 (2011).
- 11) Anders S, Pyl PT, Huber W. HTSeq--a Python framework to work with high-throughput sequencing data. Bioinformatics, 31, 166–169 (2015).
- 12) Robinson MD, McCarthy DJ, Smyth GK. edgeR: a Bioconductor package for differential expression analysis of digital gene expression data. Bioinformatics, 26, 139–140 (2010).
- 13) Guinney J, Dienstmann R, Wang X, et al. The consensus molecular subtypes of colorectal cancer. Nat. Med., 21, 1350–1356 (2015).
- 14) Korotkevich G, Sukhov V, Budin N, Shpak B, Artyomov MN, Sergushichev A. Fast gene set enrichment analysis. bioRxiv, 060012 (2021).
- 15) Krämer A, Green J, Pollard J Jr, Tugendreich S. Causal analysis approaches in ingenuity pathway analysis. Bioinformatics, 30, 523–530 (2014).
- 16) Itatani Y, Kawada K, Sakai Y. Transforming growth factor-β signaling pathway in colorectal cancer and its tumor microenvironment. Int. J. Mol. Sci., 20, 5822 (2019).
- 17) The Cancer Genome Atlas Network. Comprehensive molecular characterization of human colon and rectal cancer. Nature, 487, 330–337 (2012).
- 18) Garg M. Epithelial-mesenchymal transition-activating transcription factors-multifunctional regulators in cancer. World J. Stem Cells, 5, 188–195 (2013).
- 19) Li L, Lv Y, Yan D. Inhibition of Ep3 attenuates migration and promotes apoptosis of non-small cell lung cancer cells via suppression of TGF-β/Smad signaling. Oncol. Lett., 16, 5645–5654 (2018).
- 20) Subramaniam MM, Chan JY, Yeoh KG, Quek T, Ito K, Salto-Tellez M. Molecular pathology of RUNX3 in human carcinogenesis. Biochim. Biophys. Acta, 1796, 315–331 (2009).
- 21) Krishnan V, Ito Y. RUNX3 loss turns on the dark side of TGF-beta signaling. Oncoscience, 4, 156–157 (2017).
- 22) Hao Y, Baker D, ten Dijke P. TGF-β-mediated epithelial-mesenchymal transition and cancer metastasis. Int. J. Mol. Sci., 20, 2767 (2019).
- 23) Yokoyama U, Iwatsubo K, Umemura M, Fujita T, Ishikawa Y. The prostanoid EP4 receptor and its signaling pathway. Pharmacol. Rev., 65, 1010–1052 (2013).
- 24) Seira N, Yamagata K, Fukushima K, Araki Y, Kurata N, Yanagisawa N, Mashimo M, Nakamura H, Regan JW, Murayama T, Fujino H. Cellular density-dependent increases in HIF-1α compete with c-Myc to down-regulate human EP 4 receptor promoter activity through Sp-1-binding region. Pharmacol. Res. Perspect., 6, e00441 (2018).
- 25) Mizuno R, Kawada K, Sakai Y. Prostaglandin E2/EP signaling in the tumor microenvironment of colorectal cancer. Int. J. Mol. Sci., 20, 6254 (2019).