MATERIALS AND METHODS
MaterialsPropranolol hydrochloride, dexamethasone, and bis-p-nitrophenyl phosphate (BNPP) were obtained from Nacalai Tesque, Inc. (Kyoto, Japan). Metoprolol tartrate, atenolol, and acyclovir were obtained from Tokyo Chemical Industry Co., Ltd. (Tokyo, Japan). Nadolol and rhodamine 123 were obtained from Sigma-Aldrich Co. (St. Louis, MO, U.S.A.). Tariquidar was obtained from AdooQ BioScience (Irvine, CA, U.S.A.). Temocapril hydrochloride and temocaprilat were obtained from Toronto Research Chemicals, Inc. (North York, ON, Canada). All other chemicals were of the highest available purity.
Fabrication of Microfluidic DevicesThe microfluidic devices consist of two top and bottom blocks and a sandwiched semipermeable membrane. The two blocks, comprising a twice bent microchannel of 1 mm width and 0.3 mm height, were fabricated from polydimethylsiloxane (PDMS) using a soft lithographic technique. Sylgard 184 silicone elastomers (Dow Corning, Midland, MI, U.S.A.) were cast and cured against an SU-8 2150 (Kayaku Advanced Material, Westborough, MA, U.S.A.) photoresist mold pattern with relief features on its surface. Four reservoir holes were instituted against the top PDMS blocks using a 6 mm-biopsy punch. PDMS prepolymer was spin-coated on a glass slide at 500 rpm for 5 s and then at 4000 rpm for 60 s to be used as glue. The top and bottom PDMS blocks were placed with the channel-side surface down onto the PDMS prepolymer spread and allowed to bond, sandwiching a 3.0-µm pore polyethylene terephthalate (PETE) membrane (Sterlitech, Kent, WA, U.S.A.). The cleaved blocks were kept for 5 min in a desiccator to remove air bubbles, and then incubated overnight at 60 °C to cure the PDMS.
The microfluidic devices were sterilized with UV irradiation the day before cell seeding, and then treated in both the top and bottom microchannels with 5% (v/v) Matrigel (Corning Inc., Corning, NY, U.S.A.) and 0.005% (w/v) collagen (Corning Inc.) in phosphate buffered saline (PBS) for 2 h.
Cell CultureCaco-2 cells were obtained from the American Type Culture Collection (CRL-2102; ATCC, Rockville, MD, U.S.A.) and maintained in high-glucose Dulbecco’s modified Eagle’s medium (DMEM) (Nacalai Tesque, Inc.) supplemented with 10% fetal bovine serum (Thermo Fisher Scientific Inc., Waltham, MA, U.S.A.), 1% nonessential amino acids (Thermo Fisher Scientific Inc.), and 1% penicillin/streptomycin in a humidified 37 °C and 5% CO2 incubator. They were suspended at a density of 5 × 10⁶ cells/mL and 20 µL was slowly injected into the top microchannel of the microfluidic device and kept for 30 min in an incubator. The reservoir wells were then filled with culture media. The culture media were refreshed every other day. From day 7 onward, the microfluidic devices were transferred onto a seesaw rocking shaker (WakenBtech Co., Ltd., Kyoto, Japan) to apply shear stress conveniently. The shaker was placed horizontally in the incubator (37 °C, 5% CO2) on an interval rocker switching between a +13° and −13° inclination every 5 s, allowing bi-directional flow. After 14 d from seeding, fluorescein isothiocyanate (FITC)-dextran, a marker for paracellular transport, was used to confirm the absence of permeation from the cell layer (Supplementary Fig. S1).
Morphological AnalysesBright-field microscopic images were routinely monitored and captured during cell culture using a digital camera (DS-Fi3, Nikon Solutions Co., Ltd., Tokyo, Japan) with an imaging software (NIS-Elements D; Nikon Solutions Co., Ltd.) on a microscope (Eclipse Ts2-FL; Nikon Solutions Co., Ltd.). For transmission electron microscopy (TEM) analysis, Caco-2 cells cultured in the microfluidic device were fixed with 4% paraformaldehyde overnight and then the upper and lower PDMS pieces were manually cut into 5-mm blocks, followed by osmium fixation, dehydration, and epoxy resin embedding. TEM imaging was performed using an H-7650 TEM (Hitachi High-Tech Corporation, Tokyo, Japan).
The Apical-to-Basolateral Transport Studies of Drugs Varying in LipophilicityAfter 2 weeks of culture, the culture media were replaced with incubation buffers. The buffer used for the top part was Hanks’ Balanced Salt Solution (HBSS) containing 10 mM MES, adjusted to pH 6.0. The buffer used for the bottom part was HBSS containing 10 mM N-(2-hydroxyethyl)piperazine-N′-2-ethanesulfonic acid (HEPES) adjusted to pH 7.4 with or without 4.5% bovine serum albumin. The incubation buffer volume was 200 µL for both parts. After 30 min in equilibrium, half of the donor-side fluid was replaced with the corresponding drug-containing buffer. The final concentration was 1 mM for acyclovir and 100 µM for the other drugs. The receiver fluid was sampled in 100 µL aliquots at 15, 30, 45, and 60 min after treatment with drugs and replenished with an equal volume of fresh incubation buffer every time. The samples were mixed with an equal volume of acetonitrile, filtered with a 0.45 µm membrane filter, and subjected to LC/MS assay.
In plate-based transport studies, Caco-2 cells were seeded on the Transwell insert (3.0 µm pores, 1.12 cm2 growth area; Costar, Cambridge, MA, U.S.A.) at a density of 7.5 × 10⁴ cells/well. After two weeks of culture, the culture media were replaced with incubation buffers, as described above. The volume of the incubation buffers was 0.5 and 1.5 mL for the apical and basolateral sides, respectively. After 30 min in equilibrium, one-fifth of the volume of the donor-side fluid was replaced with the corresponding drug-containing buffer. The receiver fluid was sampled in 150 µL aliquots at 15, 30, 45, and 60 min after treatment with drugs and replenished with an equal volume of fresh buffer every time. The samples were mixed with an equal volume of acetonitrile, filtered using a 0.45 µm membrane filter and subjected to LC/MS assay.
Transport Studies of P-gp SubstratesAfter 2 weeks of culture, the culture media were replaced with the incubation buffer. The buffer used for both the top and bottom parts was HBSS containing 10 mM HEPES (pH 7.4). The incubation buffer volume was 200 µL for both parts. After 30 min in equilibrium with or without 1 µM tariquidar, an inhibitor of P-gp, half the volume of the donor-side fluid was replaced with the corresponding buffer containing 10 µM rhodamine 123 with or without tariquidar. The receiver fluid was sampled in 100 µL aliquots at 15, 30, 45, and 60 min after treatment with the substrate and replenished with an equal volume of fresh buffer each time. The fluorescence intensities of these samples were measured using a Wallac 1420 ARVO MX multilabel counter (PerkinElmer, Inc., Waltham, MA, U.S.A.) at excitation and emission wavelengths of 485 and 535 nm, respectively.
In Transwell-based studies, Caco-2 cells were cultured as described above. After 30 min in equilibrium with or without 1 µM tariquidar, one-fifth of the donor-side fluid was replaced with the corresponding rhodamine 123 solution with or without tariquidar. The receiver fluid was sampled in 150 µL aliquots at 15, 30, 45, and 60 min after treatment with the substrate and replenished with an equal volume of fresh buffer each time and assayed using a fluorescence microplate reader.
Measurement of Carboxylesterase ActivityAfter 2 weeks of culture, the culture media were replaced with DMEM containing 10 mM HEPES. After 30 min in equilibrium with or without 100 µM BNPP, half of the donor-side fluid was replaced with a temocapril solution at a final concentration of 100 µM with or without BNPP. The donor and receiver fluids were sampled in 100 µL aliquots at 2, 4, and 8 h after treatment with the substrate and replenished with an equal volume of fresh substrate-containing media each time. Because the sampling time was long in this experiment, the seesaw motion was maintained during the sampling in the dynamic fluidic environment group. The collected samples were mixed with an equal volume of acetonitrile, filtered with a 0.45 µm membrane filter and subjected to LC/MS assay.
In Transwell-based studies, Caco-2 cells were cultured as described above. After 30 min in equilibrium with or without 100 µM BNPP, one-fifth of the donor-side fluid was replaced with the corresponding drug-containing buffer with or without BNPP. The donor and receiver fluids were sampled in 150 µL aliquots at 2, 4, and 8 h after treatment with the substrate and replenished with an equal volume of fresh media each time. The samples were mixed with an equal volume of acetonitrile, filtered with a 0.45 µm membrane filter and subjected to LC/MS assay.
LC/MS AnalysesThe LC-MS/MS system (LCMS-8040; Shimadzu, Kyoto, Japan) was operated in multiple-reactions monitoring mode and with an electrospray ionization source in the positive ion mode. The columns were maintained at 40 °C. LabSolutions LCMS software (Shimadzu) was used to moderate the instruments and process the data. The details of the LC conditions and mass spectrometer conditions are listed in Supplementary Tables S1 and S2, respectively.
Real-Time PCR AnalysesTotal RNA was isolated from Caco-2 cells cultured in Transwell and microfluidic devices using the RNeasy Micro Kit (Qiagen, Hilden, Germany). PrimeScrip RT reagent Kit (Perfect Real Time) (TaKaRa Bio Inc., Shiga, Japan) was used to synthesize cDNA from the isolated total RNA. These single-stranded DNA fragments were immediately amplified at 95 °C for 15 s, 60 °C for 60 s, 40 cycles for the target genes, and glyceraldehyde-3-phosphate dehydrogenase (GAPDH). Real-time PCR was performed using TB Green Premix Ex Taq (Tli RNaseH Plus) (TaKaRa Bio Inc.) with Applied Biosystems StepOnePlus Real Time PCR System (Thermo Fisher Scientific Inc.). Specific primer sets for various transporters, metabolic enzymes, and GAPDH are listed in Supplementary Table S3.
Data AnalysesApparent permeability coefficients (Papp) were calculated according to the following equation:
 | (1) |
where dQ/dt is the permeability rate, A is the cell surface area, and C0 is the initial concentration in the donor chamber.
Efflux ratio (ER) was calculated according to the following equation:
 | (2) |
Net ER was calculated according to the following equation:
 | (3) |
Data are expressed as the mean ± standard error of the mean (S.E.M.). Data from transport and metabolism experiments were analyzed using two-way ANOVA followed by Tukey or Bonferroni test. Data from real-time PCR analyses were analyzed using one-way ANOVA followed by Tukey test.
RESULTS
Cell MorphologyWe designed a microfluidic device that comprises two blocks of PDMS and a sandwiched PETE membrane with pores 3.0 µm in diameter (Fig. 1A). Caco-2 cells were cultured for 2 weeks on the top-side microchannel on the membrane coated with Matrigel and collagen. The statically cultured Caco-2 cell layer was flat. By contrast, that cultured in a dynamic fluidic environment formed an undulant surface morphology (Fig. 1B). The cross-sectional structure of the Caco-2 cell layers was further examined using TEM and immunostaining. The cells cultured in a dynamic fluidic environment were multilayered and developed microvilli on the surface (Fig. 1C, Supplementary Fig. S2).
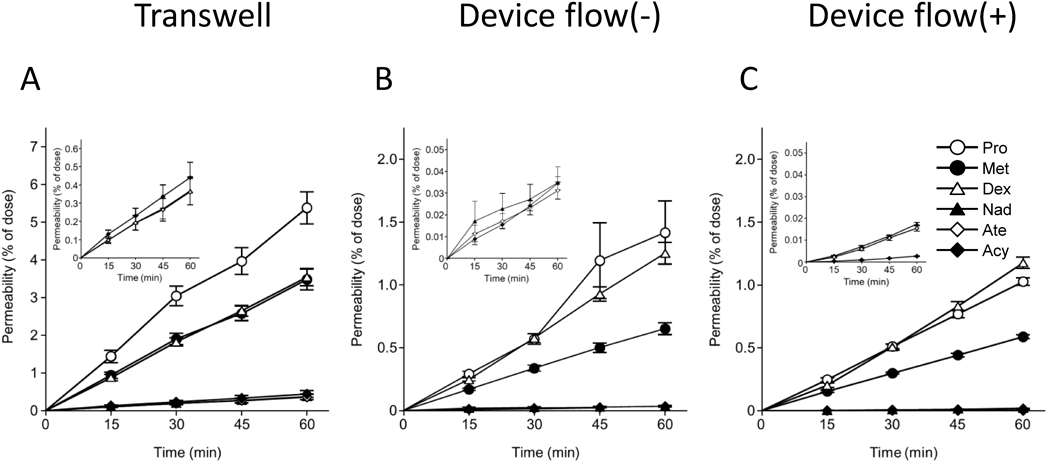
Transport of Drugs Varying in LipophilicityFigure 2 depicts the time–course of transepithelial transport of the six drugs with different lipophilicities. To mimic the physiological environment and more accurately evaluate the permeability of poorly water-soluble compounds in Caco-2 cells, incubation buffer with 4.5% albumin was used for the bottom-side fluid. As the cumulative amount transported increased linearly with time, the Papp for each drug was calculated from the slope of the profile (Fig. 2, Table 1). Table 1 also includes the octanol/water partition coefficient (log P), an indicator of drug lipophilicity, and the protein binding rate of each drug. The more lipophilic drugs exhibited higher permeability across the Caco-2 layers. The effect of the presence or absence of serum albumin in the bottom-side fluid was also investigated in the Caco-2 cells cultured in a dynamic fluidic environment (Table 1). The Papp of drugs was significantly higher in the presence of serum albumin for four of the six drugs: propranolol, nadolol, atenolol, and acyclovir. We further investigated the relationship between drug permeability and lipophilicity in Caco-2 cell layers in microfluidic devices (Supplementary Fig. S3). The permeability in Caco-2 cell layers increases with increased lipophilicity, whereas lipophilicity-insensitive paracellular transport is dominant in drugs with log P less than unity.
Table 1. Log
P and
Papp of Each Compound in Microfluidic Device in a Dynamic Fluidic Environment
| Compounds | Log P | Protein binding rate (%) | Papp (× 10-6 cm/s) |
|---|
| Transwell (with Alb) | Device flow (−) (with Alb) | Device flow (+) (with Alb) | Device flow (+) (without Alb) |
|---|
| Propranolol | 3.18 | 85–96 | 6.32 ± 0.44 | 8.88 ± 2.43 | 5.79 ± 0.18 | 2.51 ± 0.52††† |
| Metoprolol | 2.15 | 11 | 4.12 ± 0.31 | 3.59 ± 0.28 | 3.21 ± 0.12 | 2.51 ± 0.59 |
| Dexamethasone | 1.83 | 77 | 4.38 ± 0.24 | 7.49 ± 0.55* | 7.23 ± 0.24* | 5.10 ± 1.18 |
| Nadolol | 0.81 | 30 | 0.44 ± 0.10 | 0.13 ± 0.02*** | 0.11 ± 0.00*** | 0.05 ± 0.00††† |
| Atenolol | 0.16 | 6–16 | 0.43 ± 0.09 | 0.15 ± 0.02*** | 0.10 ± 0.01*** | 0.05 ± 0.00†† |
| Acyclovir | −1.76 | 9–33 | 0.51 ± 0.11 | 0.19 ± 0.02*** | 0.17 ± 0.01*** | 0.08 ± 0.01††† |
The log P values and protein binding rates of each compound were obtained from DrugBank Online (https://go.drugbank.com/). Each Papp value represents the mean ± S.E.M. (n = 3–4). * p < 0.05, *** p < 0.001, significantly different from Transwell. No significant difference was observed between the device flow (−) and device flow (+). †† p < 0.01, ††† p < 0.001, significantly different from device flow (+) (with Alb). flow (−): static fluidic condition; flow (+): dynamic fluidic condition.
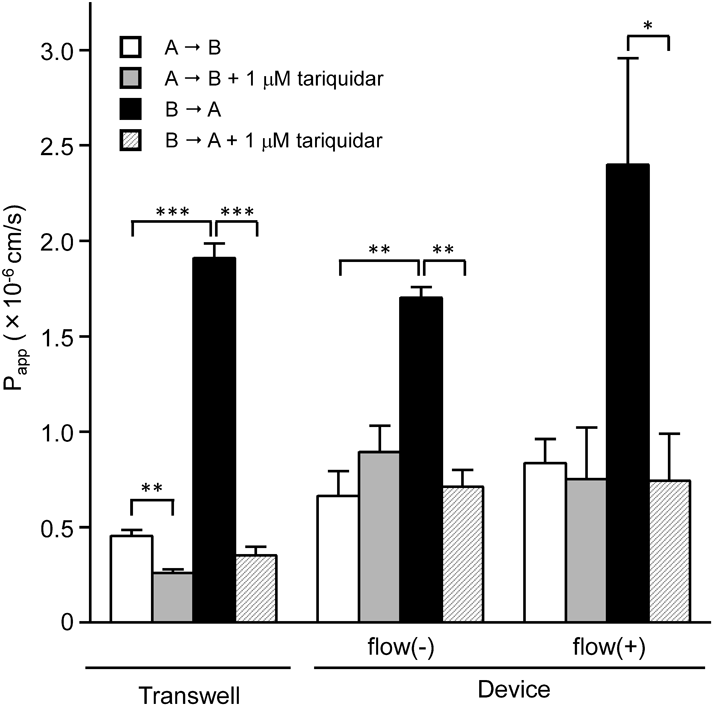
Rhodamine 123 was used to investigate the functional expression of P-gp in Caco-2 cell layers cultured in Transwells and microfluidic devices. For all culture conditions, the basal-to-apical transport of rhodamine 123 was greater than the apical-to-basal transport, and the presence of 1 µM tariquidar almost diminished the asymmetric transport (Fig. 3). Net ER was almost the same for all culture conditions (Table 2).
Table 2. Efflux Ratio of Rhodamine 123 in Caco-2 Cells Cultured in Transwells and Microfluidic Devices
| Control | +Tariquidar | Net ER |
|---|
| B to A Papp (×10−6 cm/s) | A to B Papp (×10−6 cm/s) | ER | B to A Papp (×10−6 cm/s) | A to B Papp (×10−6 cm/s) | ER |
|---|
| Transwell | 1.91 ± 0.08 | 0.45 ± 0.03 | 4.21 | 0.35 ± 0.05 | 0.26 ± 0.02 | 1.36 | 3.10 |
| Device flow (−) | 1.70 ± 0.06 | 0.66 ± 0.13 | 2.56 | 0.71 ± 0.09 | 0.89 ± 0.14 | 0.80 | 3.22 |
| Device flow (+) | 2.40 ± 0.56 | 0.83 ± 0.13 | 2.88 | 0.74 ± 0.25 | 0.75 ± 0.27 | 0.99 | 2.91 |
A, apical; B, basolateral; ER, Efflux Ratio. Each Papp value represents the mean ± S.E.M. (n = 3–4). flow (−): static fluidic condition; flow (+): dynamic fluidic condition.
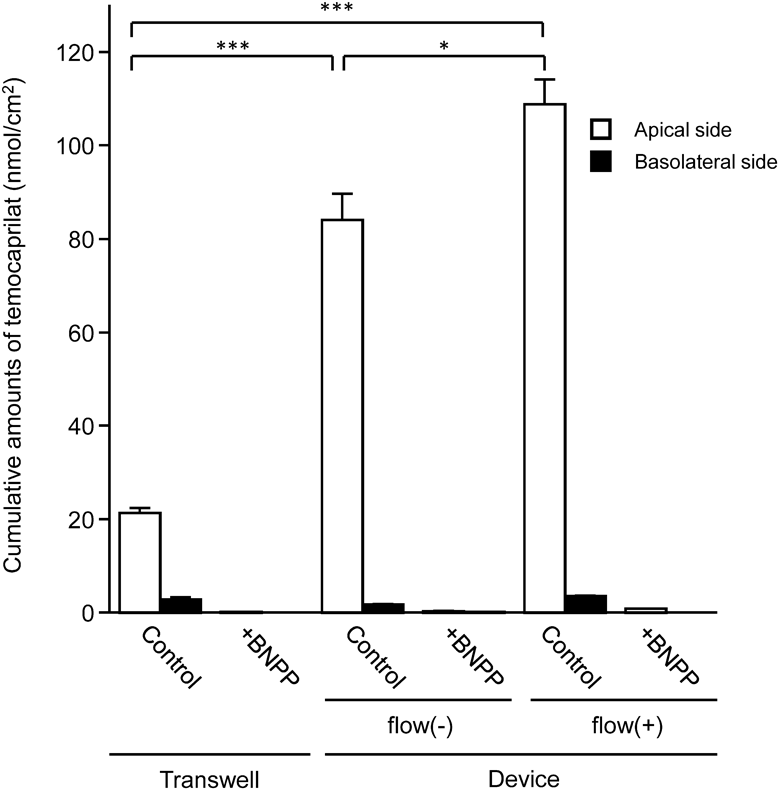
We compared the drug-metabolizing activity of Caco-2 cell layers cultured in Transwells and microfluidic devices. Caco-2 cells were treated with temocapril, a substrate of carboxylesterase (CES). At 2, 4, and 8 h after treatment, the amounts of metabolites generated in the culture medium was measured using LC-tandem mass spectrometry (LC-MS/MS). Temocaprilat, an active metabolite of temocapril, was observed not only on the basolateral side but also on the apical side. The cumulative amount of temocaprilat on the apical side after an 8-h metabolic experiment was much greater than that on the basolateral side. The cumulative amount of temocaprilat was significantly higher in the cell culture in a dynamic fluidic environment than that in a static fluidic environment with the same device. Furthermore, the cumulative amount of temocaprilat was significantly higher in the cell culture in a dynamic and static fluidic environment than that in Transwell. The metabolism of temocapril was almost completely inhibited by the CES inhibitor BNPP (Fig. 4).
Gene Expression of Various Transporters and Metabolic EnzymesThe gene expression levels of transporters and metabolic enzymes were measured in Caco-2 cells cultured in Transwell and microfluidic devices. The mRNA expression levels of ABCB1 and ABCG2 in Caco-2 cells cultured in microfluidic devices were significantly lower than that cultured in Transwells. On the other hand, the mRNA expression levels of UGT1A1, CES1, CES2, and CYP2C9 in Caco-2 cells cultured in microfluidic devices were significantly higher than that cultured in Transwells. No significant differences in fluidic stimuli were observed in the gene expression levels measured in this study (Fig. 5).
DISCUSSION
The purpose of the present study was to evaluate drug transport across Caco-2 cell layers in microfluidic devices, and to investigate the effect of fluid flow on drug transport and metabolism in Caco-2 cells. We demonstrated the evaluation of the permeability of drugs with different lipophilicities and transport by P-gp across the Caco-2 cell layers in microfluidic devices as well as in the conventional method using Transwells (Figs. 2, 3). Furthermore, fluidic conditions promoted the metabolism of temocapril by CES (Fig. 4). On the other hand, we showed that the fluidic conditions have little effect on gene expression of several transporters and metabolic enzymes (Fig. 5). These results provide useful information for the application of microfluidic devices in drug transport and metabolism studies. In the previous studies, our group has developed liver-on-a-chips using a device with almost the same structure as in the present study to contribute to drug discovery research, including drug metabolism and toxicity studies.14) In the future, we think that the gut-on-a-chip developed in this study can be applied to the reproduction of multi-organ linkage by connecting it to other organ-on-a-chips such as liver chips. Therefore, the independence and the ability to easily modify culture and experimental conditions individually would be advantages of our devices compared to the Transwells.
It has been known that Caco-2 cells cultured in microfluidic devices form thicker and denser monolayers than they do in Transwells.8–12) They are associated with a more pronounced expression of F-actin. Under fluidic conditions, actin filaments are expressed not only on the apical side but also along the apical-basal axis.10) We compared the effect of fluid stimuli with that of static stimuli on cell morphology for the same device (Fig. 1). The results showed that Caco-2 cells became more stratified with fluid stimuli. Delon et al. investigated the effect of fluid stimuli using a Hele-Shaw device wherein the shear stress linearly decreases along the flow direction.11) Among their systematic morphological and biochemical characterizations, they found that the expression of junctional proteins such as ZO-1 and occludin, in association with F-actin, increases with an increase in the fluid shear stress depending on its degree. Reasonably, the change in morphology is closely associated with the expression and reorganization of cytoskeletal and junctional proteins.
Among the six drugs used in the present transepithelial transport experiments, propranolol, metoprolol, and dexamethasone are highly lipophilic drugs. It is known that the porous structure of PDMS allows small hydrophobic molecules to diffuse in.15–17) Although alternative materials have been explored to avoid or reduce this problem,18–20) we investigated the effect of albumin that is known to improve sink conditions and solubilize hydrophobic drugs.21) It has been reported that the addition of albumin to the basal fluid remarkably increases the absorptive transport of hydrophobic compounds across Caco-2 cell monolayers cultured in the Transwells, owing to prevention of their adsorption onto the plastic surface.21–23) In the present study, the presence of 4.5% bovine serum albumin on the bottom-side fluid increased the Papp of propranolol, metoprolol, and dexamethasone by 2.3, 1.3, and 1.4 folds, respectively. The most pronounced effect of bovine serum albumin was observed with propranolol that had the highest plasma protein binding and log P value (Table 1). According to Aungst et al.,22) albumin significantly increases the absorptive permeability in Caco-2 cells of only the most lipophilic (log P > 3.0) and highly protein-bound (> 95%) compounds in the Transwells. Despite the differences in the experimental systems, propranolol falls into this category and is therefore likely to cause nonspecific interactions with the device. However, as nadolol, atenolol, and acyclovir are highly hydrophilic drugs, they are unlikely to permeate the cell membranes and are thought to permeate through the paracellular route. The addition of albumin to the receiver side is thought to generate colloid osmotic pressure.24) Therefore, the effect of colloid osmotic pressure causes extracellular flow of water and, thereby, increases the permeation of hydrophilic drugs.
In metabolic experiments, temocaprilat, the hydrolyzed product of temocapril, was observed not only on the basolateral side but also on the apical side. The cumulative amount of temocaprilat on the apical side was much greater than that on the basolateral side (Fig. 4). It has been reported that temocapril is abundantly hydrolyzed to temocaprilat in the cytoplasm after its uptake into Caco-2 cells followed by the efflux of temocaprilat to the apical and basolateral sides.25) Furthermore, temocaprilat has been reported as a good substrate of multidrug resistance protein 2, which is an efflux transporter located on the apical membrane of Caco-2 cells.26) Therefore, the temocaprilat generated from temocapril within Caco-2 cells may be preferentially transported by multidrug resistance protein 2 onto the apical side rather than the basolateral side. In the present study, the cumulative amount of temocaprilat on the apical side was higher in microfluidic devices without flow than in Transwells, even though the same static culture was performed. We think that this is due to the different number of cells per unit area.
In the present study, gene expression levels of two transporters and four metabolic enzymes did not significantly change under dynamic fluidic conditions (Fig. 5). Gene expression of transporters and metabolic enzymes is regulated by various transcription factors. It has been reported that stimulation of endothelial cells by fluidic shear stress changes the activity of transcription factors such as pregnane X receptor (PXR) and aryl hydrocarbon receptor, which in turn changes the expression levels of various downstream genes such as ABCB1 and CYP1A1.27–29) On the other hand, it has been reported that Caco-2 cells had low expression of PXR and no significant induction of ABCB1 by rifampin, a PXR activator.30) In addition, multiple transcription factors regulate the expression of a single transporter or metabolic enzyme, and there is not enough information on the effects of flow stimulation on the activity of transcription factors. Therefore, further studies are needed to determine the effects of shear stress on gene expression in terms of differences in shear stress intensity and cell type. In addition, it will be necessary to determine whether changes in gene expression levels affect protein expression and activity.
In conclusion, we demonstrated that a PDMS-based microfluidic device can be used to evaluate the intestinal permeability of drugs in Caco-2 cells. The drug permeability and P-gp-mediated transport in Caco-2 cells using our microfluidic device were comparable to those of the conventional method using Transwells. Further studies are needed, including the use of several substrates and inhibitors, but overall, this device could be a useful tool for evaluating the intestinal absorption and metabolism of drugs.