Regular Articles
Regulation of Iron-Ion Transporter SLC11A2 by Three Identical miRNAs
2022 Volume 45 Issue 9 Pages 1291-1299
Details
2022 Volume 45 Issue 9 Pages 1291-1299
Here, we searched for microRNAs (miRNAs) in silico that could interact with SLC11A2 mRNA, a solute carrier (SLC) iron-ion transporter, and investigated their effects on SLC11A2 gene expression using the cultured human colon carcinoma cell line, Caco-2. In silico analysis using the miRWalk2.0 database revealed that several types of miRNAs interact with the human SLC11A2 gene; we focused on three miRNAs, miR-149-5p, miR-362-5p, and miR-539-5p as candidates in this study. We first revealed that the three miRNAs interact with the SLC11A2 3′-untranslated region (3′-UTR) using a luciferase assay in a Caco-2 cell line. We then examined whether the expression of each miRNA affected the expression of SLC11A2 mRNAs and their transcribed transporter proteins. We found transiently expressed miRNAs significantly reduced the reporter activity of the SLC11A2 3′-UTR site in Caco-2 cells by significantly decreasing the SLC11A2 gene and protein expression in the miRNA-transfected Caco-2 cells. Subsequently, we investigated the effects of these miRNAs on SLC11A2′s iron-ion transporting activity by measuring iron-ion concentration in Caco-2 cells. Administration of ammonium iron (II) sulfate hexahydrate to Caco-2 cells significantly increased the intracellular iron-ion concentration. However, in iron-ion-pretreated cells, overexpression of each of the three miRNAs resulted in decreased intracellular iron-ion concentration. This indicated that overexpressed miRNAs inhibited iron-ion influx into Caco-2 cells by attenuating SLC11A2 transporting activity. Using in silico analysis, we predicted that three studied miRNAs could bind to the iron-ion influx transporter SLC11A2 and revealed that they regulate SLC11A2 gene expression and iron-ion transporting function in an in vitro system.
Drug-metabolizing enzymes and transporter proteins are two major “influencers” of the pharmacokinetics of administered drugs in the body. Several factors, such as age, gender, body weight, race, administrated xenobiotics, etc., can affect the profiles of these “influencers” and consequently cause the dysfunction of individual health conditions.
In our previous reports, we emphasized that the onset of diseases (we adopted the “infection” as a model disorder) could affect the activity of drug-metabolizing enzymes (using CYP enzymes as representatives) with animal experiments.1,2) In addition to our study, several studies have reported a relationship between disease and activity of “transporters.”3–5) As aforementioned, transporter enzymes are closely related to the drug-metabolizing activity; hence, the increasing interest of “transporter proteins” in other bio-pharmacokinetic studies.
Recently, particularly to elderly patients who tend to have more than one disorder, several kinds of medications are administered, this is called “polypharmacy.” Owing to this, drug-metabolizing enzymes and transporter proteins may affect their biological functions by “xenobiotics,” which could cause “fluctuation of their biological activity.” However, the important thing is, these unprecedented fluctuations could be triggered not only by administrated medicine but also by the disease itself. Thus, several studies that have investigated the mechanisms of fluctuation in drug-metabolizing enzymes in some diseases have revealed that several kinds of microRNAs (miRNAs) have been involved in changes in enzyme capability.6,7)
In this study, we directed our interest toward “transporter proteins.” Nutrients, as well as medicine introduced to the body, are essential to maintain one’s health. It is widely acknowledged that some xenobiotics are taken into the body by specific transporter proteins that are expressed in organs such as small intestine. We are interested in the malfunction of transporters which could cause certain disorders.3–5) Indeed, some studies have indicated that miRNAs regulate both the expression and function of these transporters.8,9) Thus, in this study, we investigated the mutual relation between three factors: a disorder, transporter proteins and miRNAs.
Iron deficiency anemia is a well-known disease especially prevalent in young women. To improve this disorder, iron-ion integration is widely recommended in the field of nutrition science.10,11) In this study, investigated transporters responsible for iron deficiency anemia because some solute carrier transporters are involved in metal-ion integration into the body.12) Based on this information, we focused on the SLC11A2 transporter as a model transporter to conduct our current study. SLC11A2 (also referred to as Divalent Metal Transporter1 (DMT1) or natural resistance-associated macrophage protein 2 (NRAMP2)) is a well-known transporter that intakes divalent metal ions, such as Fe2+ and Mn2+, into cells.13,14) As an iron-ion transporter, SLC11A2 is located mainly at the brush border site in small intestinal epithelial cells. We found a previous study showing that the protein expression levels and iron-transporting activity of SLC11A2 fluctuate during iron-ion deficiency in the body, such as iron deficiency anemia, which are particular interested in this study.15) Therefore, the substrate-transporting activity of SLC11A2 may play an important role in the fluctuations of iron-ion levels in the body. However, we think this is very important, no study has reported that what kind of miRNAs are related in this particular iron-ion transporting activity and resulting anemia disorder, so far as we know.
Accordingly, if we can identify miRNAs associated with SLC11A2 gene expression and affecting its iron-ion transporting activity, it might elucidate our understanding of how iron-ion transporting activity affects iron deficiency anemia from a pathological viewpoint.
All chemicals and reagents for the cell culture experiments, common biochemical experiments [e.g., sodium dodecyl sulfate-polyacrylamide gel electrophoresis (SDS-PAGE), Western blotting, etc.], and molecular biological experiments [for example, RT-PCR] were purchased from domestic or international laboratory reagent suppliers, and their grades were superfine.
The FuGENE HD, pmirGLO vector, and Dual-Glo luciferase assay systems were purchased from Promega (Madison, WI, U.S.A.). The pBAsi-hU6 vector, Dra I, Xho I, BamHI, and HindIII were purchased from TaKaRa Bio (Shiga, Japan). The anti-NRAMP2 antibody was purchased from Santa Cruz Biotechnology, Inc. (TX, U.S.A.). The anti-β-actin antibody was purchased from Imgenex (San Diego, CA, U.S.A.). Horseradish peroxidase (HRP)-conjugated anti-rabbit immunoglobulin G (IgG) and anti-mouse IgG polyclonal antibodies were purchased from R&D Systems Inc. (Minneapolis, MN, U.S.A.). All primers were purchased from Fasmac (Kanagawa, Japan) and Invitrogen (Grand Island, NY, U.S.A.). The primer sequences are listed in Tables 1 and 2.
| Gene | Sequence |
|---|---|
| hsa-miR-149-5p forward | 5′-GAT CCG TCT GGC TCC GTG TCT TCA CTC CCG TGT GCT GTC CGG GAG TGA AGA CAC GGA GCC AGA CTT TTT TA-3′ |
| hsa-miR-149-5p reverse | 5′-AGC TTA AAA AAG TCT GGC TCC GTG TCT TCA CTC CCG GAC AGC ACA CGG GAG TGA AGA CAC GGA GCC AGA CG-3′ |
| hsa-miR-362-5p forward | 5′-GAT CCG AAT CCT TGG AAC CTA GGT GTG AGT GTG TGC TGT CCA CTC ACA CCT AGG TTC CAA GGA TTC TTT TTT A-3′ |
| hsa-miR-362-5p reverse | 5′-AGC TTA AAA AAG AAT CCT TGG AAC CTA GGT GTG AGT GGA CAG CAC ACA CTC ACA CCT AGG TTC CAA GGA TTC G-3′ |
| hsa-miR-539-5p forward | 5′-GAT CCG GGA GAA ATT ATC CTT GGT GTG TGT GTG CTG TCC ACA CAC CAA GGA TAA TTT CTC CCT TTT TTA-3′ |
| hsa-miR-539-5p reverse | 5′-AGC TTA AAA AAG GGA GAA ATT ATC CTT GGT GTG TGG ACA GCA CAC ACA CAC CAA GGA TAA TTT CTC CCG-3′ |
| SLC11A2 3′-UTR (hsa-miR-149-5p binding site) forward | 5′-CGC TTT AAA ACT GGA TTA GTC TGT CTT CTG C-3′ |
| SLC11A2 3′-UTR (hsa-miR-149-5p binding site) reverse | 5′-ATA CTC GAG CCA ACG GTT GAG TCA TAA AC-3′ |
| SLC11A2 3′-UTR (hsa-miR-362-5p binding site) forward | 5′-CGC TTT AAA AGC TGA CAT TTG CTG CTA TC-3′ |
| SLC11A2 3′-UTR (hsa-miR-362-5p binding site) reverse | 5′-ATA CTC GAG GCC TGG TTA AGA ATC ATG C-3′ |
| SLC11A2 3′-UTR (hsa-miR-539-5p binding site) forward | 5′-CGC TTT AAA GAG ACA CCT AGC TCT ATC AGG C-3′ |
| SLC11A2 3′-UTR (hsa-miR-539-5p binding site) reverse | 5′-ATA CTC GAG AGC ACC ACC TAG CGA TGT-3′ |
| Gene | Sequence |
|---|---|
| hsa-miR-149-5p | 5′-TCT GGC TCC GTG TCT TCA CTC CC-3′ |
| hsa-miR-362-5p | 5′-AAT CCT TGG AAC CTA GGT GTG AGT-3′ |
| hsa-miR-539-5p | 5′-GGA GAA ATT ATC CTT GGT GTG T-3′ |
| GAPDH forward | 5′-GCG AGA TCC CTC CAA AAT CA-3′ |
| GAPDH reverse | 5′-ATG GTT CAC ACC CAT GAC GA-3′ |
| SLC11A2 forward | 5′-AGT CAT CCT GTG GCT GAT-3′ |
| SLC11A2 reverse | 5′-GTA TCT GCA ATG GTG ATG AG-3′ |
The human colon carcinoma Caco-2 cell line was maintained in Dulbecco’s modified Eagle’s medium (Wako, Osaka, Japan) supplemented with 10% heat-inactivated fetal bovine serum (FBS; Equitech-Bio, Inc., TX, U.S.A.) and 1 × minimum essential medium (MEM) non-essential amino acid solution, with 5% CO2 at 37 °C. Caco-2 cell lines exhibit morphological structures similar to human small intestinal epithelial cells.16–18) Therefore, we adopted this strain as a representative of cultured colon epidermal cell lines to perform our experiments.
The cells were seeded at 2 × 10⁴ cells/well in 96-well tissue culture plates for the luciferase assay, and 1 × 10⁵ cells/well in 12-well tissue culture plates to extract total RNA for real-time PCR experiments and obtain proteins for Western blotting experiments and intracellular iron-ion assays.
Construction of Reporter Vectors for Luciferase Reporter Assay and miRNA Expression VectorsIn Silico Prediction of miRNAs with the Potential to Bind SLC11A2 GenesFor the screening of miRNAs that could potentially bind to human SLC11A2 and mouse Slc11a2 genes, we used the miRWalk2.0 software (http://zmf.umm.uni-heidelberg.de/apps/zmf/mirwalk2/). Twelve miRNA target prediction algorithms [miRWalk, Microt4, miRanda, miRBridge, miRDB, miRMap, miRNAMap, PicTar2, PITA, RNA22, RNAhybrid, and TargetScan] in the miRWalk software were used for the miRNA vs. human SLC11A2 and mouse Slc11a2 mRNA binding predictions. Our prediction method adopted the following criteria: minimum seed length of miRNA was seven, and a p-value <0.05 was considered significant.
Construction of VectorsTo construct the reporter vectors, the SLC11A2 3′-untranslated region (3′-UTR) region was amplified by PCR as templates using the reverse-transcribed products from the total RNA of Caco-2 cells. The primers used in this experiment, SLC11A2 3′-UTR forward and reverse primers are shown in Table 1. After thermal denaturation at 94 °C for 30 s, the chain reaction was performed with 30 cycles at 98 °C for 10 s, 30 s at 55 °C, and 30 s at 70 °C, followed by an extension reaction at 72 °C for 7 min. The amplified fragments of the SLC11A2 3′-UTR regions and the pmirGLO vector were digested by DraI and XhoI. The inserts were then subcloned into the pmirGLO vector to obtain the pmirGLO/SLC11A2 3′-UTR vector.
To construct the miRNA expression vectors, each miRNA oligonucleotide was produced by PCR using forward and reverse primers for each miRNA (Table 1). The amplified oligonucleotides were then subcloned into the pBAsi-hU6 vector at the BamHI and HindIII sites, resulting in pBA/miRNA vectors.
Luciferase AssayA 20-ng equivalent volume of the luciferase reporter vector and 1- 30-ng equivalent volumes of each miRNA expression vector were co-transfected into Caco-2 cells using FuGENE HD, according to the manufacturer’s recommended protocol. After 48-h of incubation, the cells were harvested and lysed with PLB buffer using a conventional method. Luciferase activity was then measured by SpectraMax L (Molecular Devices, Tokyo, Japan) using the Dual-Glo Luciferase assay system.
Production of cDNA from Total RNAsTotal RNA was isolated from Caco-2 cells using ISOGEN II (Nippon Gene, Tokyo, Japan). Reverse transcription to produce cDNA for each miRNA was conducted using the Mir-X™ miRNA First-Strand Synthesis kit (TaKaRa Bio). Briefly, total RNA (0.5 µg) from Caco-2 cells was suspended in 5 µL of reaction buffer with the mRQ Enzyme and then incubated for 60 min at 37 °C. Reverse transcription was stopped by heating the reaction mixture to 85 °C for 5 min.
The cDNA for SLC11A2 was synthesized from the total RNA of Caco-2 cells using the PrimeScript RT Reagent Kit (TaKaRa Bio). Briefly, total RNA (0.5 µg) was suspended in 2.8 µL of reaction buffer with PrimeScript RT enzyme and incubated for 15 min at 37 °C. Reverse transcription was stopped by denaturing the enzyme at 85 °C for 5 s.
Real-Time PCRThe expression of the three miRNAs (miR-149-5p, miR-362-5p, and miR-539-5p) and of the mRNAs of the SLC11A2 gene were measured by real-time PCR using the ABI 7500 Fast system (Applied Biosystems, CA, U.S.A.).
Real-time PCR for each miRNA expression was carried out using 10 µM of miRNA-specific primers (Table 2) and the TB Green™ Advantage® qPCR Premix (TaKaRa Bio). The reaction was performed according to the manufacturer’s protocol. The initial denaturation was carried out for 10 s at 95 °C, followed by 40 cycles at 95 °C for 10 s and 30 s at 60 °C. The expressed miRNA levels were calculated from a relative standard curve and normalized to that of U6 in the same sample.
The mRNA expression of the SLC11A2 gene was also determined by real-time PCR with 10 µM of SLC11A2-specific forward and reverse primers (Table 2) in the SYBR Premix Ex Taq II (TaKaRa Bio) system. The reaction was performed according to the manufacturer’s protocol. The initial denaturation was run at 95 °C for 30 s, followed by 40 cycles at 95 °C for 5 s and 60 °C for 34 s. The mRNA levels of SLC11A2 were calculated from a relative standard curve and normalized to that of glyceraldehyde-3-phosphate dehydrogenase (GAPDH) in the same sample.
Western BlottingThe extracted total protein from Caco-2 cell lysate (equivalent to 15 µg of protein) was separated by SDS-PAGE (4–15% gradient gel, 200 V, 30 min) and then blotted onto a polyvinylidene difluoride (PVDF) membrane at 0.35 A for 1 h. The membrane was blocked with 1% non-fat dry milk/Tris-buffered saline (TBS)-0.05% Tween-20 (TBS-T) for 1 h, and then incubated with an anti-NRAMP2 (another name of SLC11A2) polyclonal antibody (1 : 2000 dilution) overnight at 4 °C. The membrane was then rinsed three times with TBS-T buffer and incubated with HRP-conjugated anti-mouse IgG polyclonal antibody (1 : 2000 dilution) for 2 h at room temperature (r.t.). Signals were detected with the Clarity Western ECL Substrate (Bio-Rad, Hercules, CA, U.S.A.), and blots were analyzed with Fusion-FX (Vilber, Marne-la-Vallée, France). SLC11A2 protein levels were then normalized to β-actin in the same sample.
Measuring of Iron-Ion Concentration (Ferrozine Assay)Caco-2 cells transfected with miRNA expression vectors were treated with 10 mM ammonium iron (II) sulfate hexahydrate. Cells were washed with phosphate buffered saline (PBS) (−) 1 h post-treatment, and the lysate was extracted from the cells using radio immunoprecipitation assay (RIPA) buffer (50 mM Tris–HCl (pH7.4), 150 mM NaCl, 0.1% SDS, 1% NP-40, and 1% sodium deoxycholate). Finally, the lysate (equivalent to 100 µg of protein) was changed to an acid solution (pH 2.5) using HCl. The kit for measuring iron-ion concentration (Metallogenics, Chiba, Japan) based on the Ferrozine chromogenic method was used to measure intracellular iron-ion concentration according to the manufacturer’s protocol.19) The iron-ion concentration was determined by measuring the absorbance of the Fe2+-ferrozine complex at 560 nm.
Statistical AnalysisAll experimental results were obtained from four to six independent experiments and are presented as the mean± standard error (S.E.). The results from the various experimental groups and their corresponding controls were compared using a student’s t-test, a Dunnett post hoc test and a Tukey–Kramer post hoc test. Differences were considered significant at p < 0.05.
First, to extract miRNA (more precisely, hsa-miRNA) candidates that bind the SLC11A2 gene, we used miRWalk2.0, a miRNA target gene prediction database that is available on the web. This algorithm can predict miRNAs that bind to the 3′-UTR region of a gene of interest, in our case that of the SLC11A2 gene. We successfully extracted three kinds of miRNAs that were bound to the human SLC11A2 gene, and the details are described below.
The actual number of “computer-extracted” miRNAs that could potentially bind to the 3′-UTR of the SLC11A2 gene was 2573. Since the number of predicted miRNAs was enormous, we narrowed them down to obtain plausible candidates. MiRWalk2.0 itself includes 12 kinds of algorithms to detect the direct interaction between a miRNA and the researcher’s target mRNAs. Therefore, we temporarily classified the candidate miRNAs as “tentative-positive” when we identified six or more of the 12 predicted positive bindings between the miRNA and mRNA of SLC11A2. After using this strategy, the number of miRNA candidates was reduced to 357.
The mouse Slc11a2 gene is a member of the human SLC11A2 gene; therefore, we were interested in the miRNAs (more precisely, mmu-miRNA), which also had the potential to bind SLC11A2′s mouse counterpart. For this purpose, we screened miRNAs that could bind to the mouse Slc11a2 gene using miRWalk2.0, as described above. Computer-predicted 1904 miRNAs were shown to have the potential to bind to mouse Slc11a2. Using the same strategy as before, 263 miRNAs were extracted as tentative candidates to bind the mouse Slc11a2 gene.
Subsequently, we compared the 357 hsa-miRNAs that tentatively bound to human SLC11A2 and 263 mmu-miRNAs, which also bound to mouse Slc11A2 mRNA, to reveal whether the same miRNAs or the one that closely resembled sequences (the difference of each sequence is one or less) among these two miRNA groups were present. Based on this process, we selected three miR-149-5p, miR-362-5p, and miR-539-5p. In the case of miR-149-5p, the sequence of hsa-miR-149-5p and its mouse counterpart (mmu-miR-149-5p) was the same, and 8 out of 12 algorithms predicted its binding to human SLC11A2 mRNA, and 7 out of 12 algorithms predicted its binding to mouse Slc11a2. The sequence homology of hsa-miR-362-5p and mmu-miR-362-5p was more than 95% (the difference in the sequence was only 1 base). Hsa-miR-362-5p was predicted to bind to the human SLC11A2 gene by 8 out of 12 algorithms, and binding to mouse Slc11a2 was predicted in 6 out of 12 algorithms. In the case of miR-539-5p, the sequence of hsa-miR-539-5p and its mouse counterpart were identical. Eight out of 12 algorithms predicted its binding to the human SLC11A2 gene and 7 out of 12 algorithms also predicted its binding to mouse the Slc11a2 gene. The results are summarized in Table 3.
| Species | miRNA | miRNA | Gene | Number of algorithms (out of 12) |
|---|---|---|---|---|
| Human | hsa-miR-149-5p | 5′-TCTGGCTCCGTGTCTTCACTCCC-3′ | SLC11A2 | 8 |
| hsa-miR-362-5p | 5′-AATCCTTGGAACCTAGGTGTGAGT-3′ | SLC11A2 | 8 | |
| hsa-miR-539-5p | 5′-GGAGAAATTATCCTTGGTGTGT-3′ | SLC11A2 | 8 | |
| Mouse | mmu-miR-149-5p | 5′-TCTGGCTCCGTGTCTTCACTCCC-3′ | Slc11a2 | 7 |
| mmu-miR-362-5p | 5′-AATCCTTGGAACCTAGGTGTGAAT-3′ | Slc11a2 | 6 | |
| mmu-miR-539-5p | 5′-GGAGAAATTATCCTTGGTGTGT-3′ | Slc11a2 | 7 |
※The numbers appeared in the rightmost column are number of algorithms appered in miRWalk2.0 that can predict the binding of individual of miRNAs and its target SLC11A2 gene
Table 4 shows the predicted binding sites of miR-149-5p, miR-362-5p, and miR-539-5p in human SLC11A2 and mouse Slc11a2 genes, respectively, using the miRmap algorithm. The predicted binding sites of miR-149-5p, miR-362-5p, and miR-539-5p in humans were located at positions 36–42, 301–307, and 579–585 in human SLC11A2 3′-UTR, respectively. Similarly, the predicted binding sites of miR-149-5p, miR-362-5p, and miR-539-5p in the mouse counterpart sequence were located at positions 695–700, 711–717, and 29–34 in mouse Slc11a2 3′-UTR, respectively.
 |
Subsequently, we investigated the interaction between each of the three miRNAs (miR-149-5p, miR-362-5p, and miR-539-5p) and SLC11A2. Therefore, we first examined the intracellular expression of the three miRNAs in the cultured cell system. For this purpose, we constructed three types of miRNA expression vectors (pBA/miRNA) and measured the expression of each miRNA after their introduction into Caco-2 cells by real-time PCR.
Figure 1 shows the results of miRNA expression in Caco-2 cells. MiR-149-5p, miR-362-5p, and miR-539-5p expression increased to 13.19 ± 3.14 (miR-149-5p: Fig. 1A), 8.63 ± 2.92 (miR-362-5p: Fig. 1B), and 306.7 ± 55.50 times (miR-539-5p: Fig. 1C), respectively, higher than the empty vector (pBA). These results indicated that the intracellular expression of these three miRNAs was increased by introducing miRNA expression vectors into Caco-2 cells.

Caco-2 cells were transiently transfected with a 2-µg equivalent volume of each pBA/miRNA vector. Forty-eight hours after transfection, miR-149-5p (A), miR-362-5p (B), or miR-539-5p (C) expression was assayed by real-time PCR. As a control, the empty pBA vector was transfected before the real-time PCR experiment was conducted. The expression levels of each miRNA were normalized to that of U6. The values relative to that of pBA alone, which was arbitrarily set to 1.0, are shown. The results show the mean± S.E. obtained from four independent experiments. * p < 0.05, ** p < 0.01 vs. pBA.
To determine whether miR-149-5p, miR-362-5p, and miR-539-5p were bound to SLC11A2 mRNA, we constructed their reporter vectors (pmirGLO/SLC11A2 3′-UTR) to perform a luciferase assay. One, ten, or 30 times the volume of each miRNA expression vector and 20 ng equivalent volume of the reporter vector were co-transfected into Caco-2 cells, and the expression of the SLC11A2 mRNA was evaluated as the luciferase activity.
When each miRNA expression vector was transfected into Caco-2 cells at different doses (1, 10, or 30 volumes), the mRNA levels of the SLC11A2 gene were significantly reduced in a dose-dependent manner. The ratio of SLC11A2 expression decreased to 93, 79, and 49% according to the dose-dependent introduction of the miR-149-5p expression vector (Fig. 2A). In addition, sequential decreases of 94, 83, and 60% of SLC11A2 mRNA were observed in the case of miR-362-5p expression (Fig. 2B). Finally, as shown in Fig. 2C, the sequential decrease (91, 65, and 45%) of SLC11A2 mRNA expression according to overexpression of miR-539-5p was observed. In these data, the expression ratio was indicated as compared to each volume of the control (pBA vector itself).

Caco-2 cells were transiently co-transfected with a 20 ng equivalent volume of pmirGLO/SLC11A2 3′-UTR (reporter vector) and 1–30 ng equivalent volumes of pBA/miRNA vectors. Forty-eight hours after transfection, cells were harvested, and a luciferase assay was conducted. Luciferase activities by miR-149-5p (A), miR-362-5p (B), or miR-539-5p (C) transfected cells relative to the activity in pBA transfected cells, which was arbitrarily set as 1.0 of each pBA vector volume, are shown. The results show the mean ± S.E. obtained from six independent experiments. ** p < 0.01 vs. 30 ng pBA, Dunnett’s analysis.
From these results, it is clear that three in silico extracted miRNAs (miR-149-5p, miR-362-5p, and miR-539-5p) individually regulated the gene transcription of human SLC11A2 by recognizing and binding to the 3′-UTR of SLC11A2 mRNA.
Effects of Over-Expression of Individual miR-149-5p, miR-362-5p, and miR-539-5p on SLC11A2 mRNA and Protein ExpressionFigure 2 showed that each of the three miRNAs bound to SLC11A2 mRNA, so we investigated how the overexpression of these miRNAs affected SLC11A2 mRNA and protein expression in Caco-2 cells.
Using real-time PCR, mRNA levels of SLC11A2 decreased by 62, 70, and 50% following miR-149-5p, miR-362-5p, and miR-539-5p overexpression, respectively (Fig. 3A). In these experiments, the mRNA levels of SLC11A2 were normalized to “1” as the value of the control pBA vector was transfected.
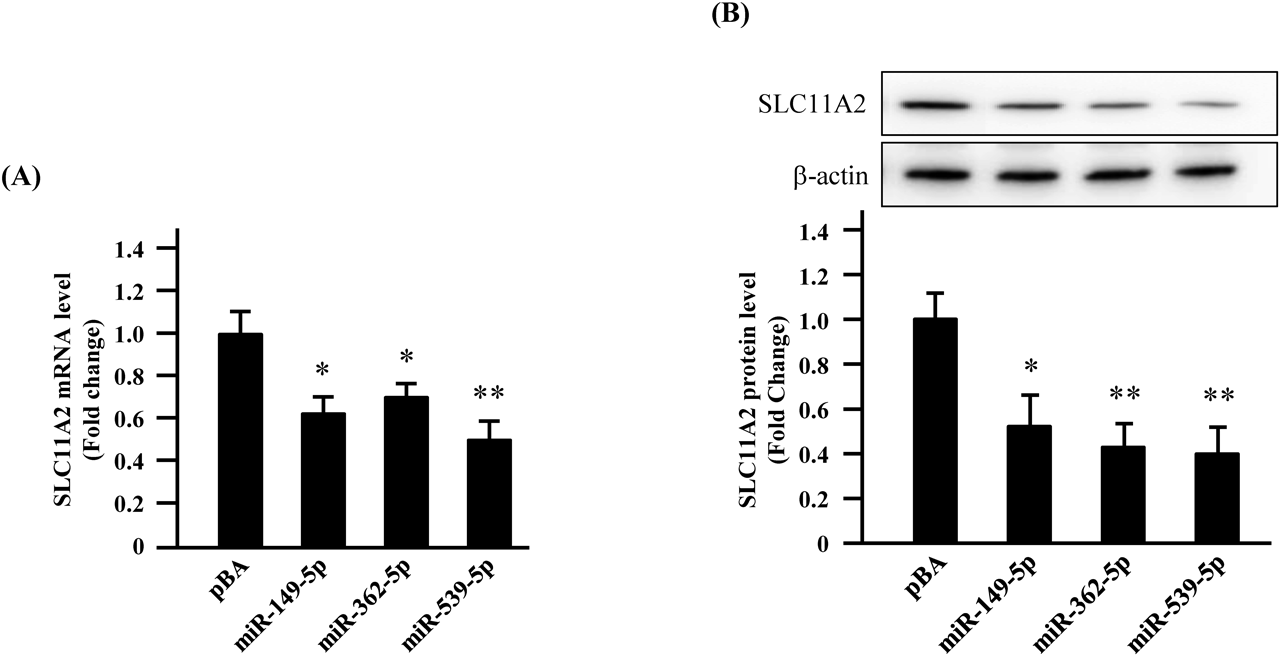
(A) Caco-2 cells were transiently transfected with a 2-µg equivalent volume of each pBA/miRNA vector. Forty-eight hours after transfection, the mRNA levels of SLC11A2 were measured by Real-Time PCR (RT-PCR). As a control, the empty pBA vector was transfected before RT-PCR experiment has conducted. The expression level of SLC11A2 mRNA was normalized to that of U6. The values relative to that of pBA alone, which was arbitrarily set as 1.0, are shown. Results show the mean ± S.E. obtained from 4 independent experiments. * p < 0.05, ** p < 0.01 vs. pBA, Dunnett’s analysis. (B) Caco-2 cells were transiently transfected with a 2-µg equivalent volume of each pBA/miRNA vector. Forty-eight hours after transfection, the total protein of the cells was extracted, and Western blotting was conducted to detect SLC11A2. Panels show the Western blotting results indicating the SLC11A2 expression after the transduction of Caco-2 cells with each miRNA expression vector. Bar graph indicates the relative intensity of SLC11A2 signals shown at panels, quantified with a densitometer. The expression levels of SLC11A2 protein relative to that of pBA alone, which was arbitrarily set as 1.0, are shown. Results show the mean ± S.E. obtained from five independent experiments. Lanes for each sample in the panel show the representative results from five independent experiments. * p < 0.05, ** p < 0.01 vs. pBA, Dunnett’s analysis.
Protein expression of SLC11A2 was also examined by Western blotting (Fig. 3B). We found that the expression of SLC11A2 protein was decreased when the three individual miRNAs were overexpressed (Fig. 3B). To confirm these results, densitometric scanning was also conducted against these data, and the results are shown in the bar graph in the under panel of Fig. 3B. Similar to the results shown in Fig. 3A, SLC11A2 protein expression was normalized to “1” as the value of the control pBA vector was transfected.
The expression of SLC11A2 protein was 40–50% lower than the control following the overexpression of miR-149-5p, miR-362-5p, and miR-539-5p. These Western blotting photos were obtained as representative data from five independent experiments.
Effects of the Overexpression of the Three miRNAs on Iron-Ion Influx into Caco-2 Cells via SLC11A2 TransporterThe results shown in Figs. 1–3 strongly suggested that the three miRNAs (miR-149-5p, miR-362-5p, and miR-539-5p) affected both mRNA and protein expression of the SLC11A2 transporter. To reinforce these results in terms of SLC11A2′s iron-ion transporting function, we administrated Ammonium Iron(II) Sulfate Hexahydrate (hereafter, we call “AISH”) into the culture of Caco-2 cells. Then, using the well-known Ferrozine assay, we measured the intracellular iron-ion concentration following the overexpression of the three individual miRNAs.
As a control experiment, we first measured the intracellular iron-ion concentration in Caco-2 cells after administration of AISH. In this case, iron-ion concentration was 110.37 ± 9.82 µg/dL in cells, which was approximately 11 times higher than in no AISH-administrated Caco-2 cells (9.36 ± 3.21 µg/dL), which means extracellular iron-ion was introduced into Caco-2 cells by SLC11A2 transporter. This result was also consisted with previous reports that iron-ion was taken into Caco-2 cells by SLC11A2 transporter.20)
In contrast, we conducted the same experiment using Caco-2 cells in which each of the miRNAs was overexpressed (hereafter referred to as “miRNA-expressing Caco-2 cells”). After administering AISH to the culture medium, we measured the intracellular iron-ion concentration of “miRNA-expressing Caco-2 cells.” The iron-ion concentration in individual “miRNA-expressing Caco-2 cells” decreased to 65.50 ± 7.02, 66.65 ± 6.09, and 54.18 ± 10.26 µg/dL following miR-149-5p, miR-362-5p, and miR-539-5p overexpression, respectively (Fig. 4). In the control Caco-2 cells, of which only pBA mother vector was transfected instead of miRNA expression vector, intracellular iron-ion concentration was 104.46 ± 10.53 µg/dL, which was nearly equal to that of intact (no-transfection of plasmid was carried out) Caco-2 cells.

Caco-2 cells were transiently transfected with a 2-µg equivalent volume of each pBA/miRNA vector. Forty-eight hours after transfection, the cells were treated with 10 mM ammonium iron (II) sulfate hexahydrate, and then the intracellular iron-ion concentration was measured at 1h post-treatment. The iron concentration was calculated on the basis of the method recommended by the manufacturers’ Iron Assay Kit. Results show the mean ± S.E. obtained from six independent experiments. †† p < 0.01 vs. NT, * p < 0.05, ** p < 0.01 vs. control, Tukey–Kramer’s analysis.
Taking these results into consideration, we concluded that miR-149-5p, miR-362-5p, and miR-539-5p independently directly bound the 3′-UTR of SLC11A2 mRNA, resulting in a decrease in SLC11A2 transporter function as an iron-ion influx transporter.
MicroRNAs are small non-coding RNAs that regulate gene expression through post-transcriptional repression, resulting in the degradation of newborn mRNAs. Based on our and other previous studies, miRNA is a “key regulator” of important gene expression, such as CYP enzymes.6,7) Due to our interest in the “fluctuation of CYP enzyme activity caused by the onset of disease,” in relation to “transporting proteins,” we investigated how miRNAs affected human health through transporter substrates. Elucidating the miRNAs that directly or indirectly regulated the expression of indispensable genes could help us understand how human homeostasis and human health is maintained.
Our research team previously investigated the mechanisms of fluctuation in drug-metabolizing enzymes in infection as a model disease, and then revealed that several kinds of miRNAs affected their expression and capability.1,2,6,7) Following these studies, we shifted our interest from drug-metabolizing enzymes to transporter proteins. As such, we investigated the mechanisms of substrate-transporting activity of transporters, in which transporting functions are influenced by miRNAs in certain diseases. We selected iron-ion deficiency anemia as a model in this study, because some reports say that some metal-ion transporters (e.g., SLC transporters, especially SLC11A2) plays a critical role in this particular disorder.15,21)
For this study, it was important to adopt a cultured cell line that closely resembles human small intestinal epithelial cells, because absorbance of iron-ions is conducted through small intestine. We adopted the Caco-2 cell line, which was originally derived from human colon carcinoma cells, exhibiting a morphological structure similar to human small intestinal epithelial cells.16–18) Some reports have also evaluated that the Caco-2 cell line is convenient to measure the uptake of drugs or ions into the cell.22,23)
Among SLC transporter proteins, we focused on the SLC11A2 transporter in this study because it is an acknowledged metal ion transporter, with iron-ion is its main substrate. Interestingly and importantly, Bannon et al. reported that SLC11A2 expressed in Caco-2 cells took iron-ion up into the cells following the kinetics based on a Michaelis–Menten equation. Also, they revealed that knockdown of SLC11A2 in the cells completely prevented the influx of iron-ion into Caco-2 cells.20) Based on this reason, we adopted SLC11A2 as the model transporter to investigate the malfunction of transporters in anemia.
Using the miRWalk2.0 database, we searched miRNAs that closely interacted with the SLC11A2 transporter expressed Caco-2 cells. Next, using Caco-2 cells, we investigated the interaction between three focused miRNAs (miR-149-5p, miR-362-5p and, miR-539-5p) and the 3′-UTR of SLC11A2 mRNA.
Our first experiment was the expression of each of the three miRNAs in Caco-2 cells. When an individual miRNA expression vector was introduced into the cells, the intracellular expression level of individual miRNAs was higher than in the control (Fig. 1). Thus, we confirmed the authenticity of the constructs. Our second goal was to show the interaction of miRNAs and their target genes, to investigate whether the three miRNAs bound to the 3′-UTR of SLC11A2 mRNA using a luciferase assay. As shown in Fig. 2, miR-149-5p, miR-362-5p, and miR-539-5p significantly attenuated the luciferase activity by binding to the 3′-UTR of SLC11A2 mRNA. These results were consistent with the output of miRWalk’s prediction, and indicated that each miRNA actually bound to the predicted 3′-UTR site of SLC11A2 mRNA. Accordingly, our three miRNAs (miR-149-5p, miR-362-5p, and miR-539-5p) clearly regulated the mRNA expression of SLC11A2 in these experiments.
Binding between the three miRNAs and SLC11A2 mRNA was confirmed in the results of Fig. 2 and the results shown in Fig. 3A by real-time PCR and 3B by Western blotting. These data clearly indicated that the mRNA and protein expression of SLC11A2 was negatively regulated by the overexpression of the three miRNAs. Taken together, miR-149-5p, miR-362-5p, and miR-539-5p directly bind to SLC11A2 mRNA resulting in SLC11A2 translational repression through mRNA degradation.
SLC11A2 is a well-known transporter that influences divalent metal ions in cells and plays an essential role in iron-ion transport.20) Therefore, we further investigated the transport of iron-ions by SLC11A2 using the ferrozine assay, as shown in Fig. 4. The principle of the ferrozine assay is detailed in a previous report.19)
We found, as shown in Fig. 4, that the iron-ion transporting activity of SLC11A2 was affected by the expression of these three miRNAs. Therefore, using the Ferrozine assay, we directly measured the iron-ion concentration in Caco-2 cells after over-expression of each miRNA. Our experiment was based on the premise that the administration of AISH would not affect the viability of Caco-2 cells, and subsequent 3-(4,5-dimethylthiazol-2-yl)-2,5-diphenyltetrazolium bromide (MTT) assays confirmed this (data not shown).
As shown in Fig. 4, when AISH was added to the culture medium of Caco-2 cells, the intracellular iron concentration was significantly higher than that of its non-treated counterpart. Bannon et al.’s report20) revealed that the influx of iron-ions into Caco-2 cells was caused by the SLC11A2 transporter. Columns “NT” and “pBA” in Fig. 4 clearly indicated that iron-ion influx into Caco-2 cells was caused by the normal functioning SLC11A2 transporter. On the other hand, Fig. 4 also shows that in individual miRNA-overexpressed Caco-2 cells, the intracellular iron-ion concentration was significantly lower than that of the control. Taken together, in combination with the results shown in Figs. 3A and B, this clearly indicated that individual miRNAs negatively regulated the iron-ion transporting activity of SLC11A2 via the transcription and subsequent translation of SLC11A2 mRNA.
In this study, we focused on the “iron-ion” transport by SLC11A2 transporter in particular. However, we should recognize that the iron-ion is not the only cation that SLC11A2 transports but others such as zinc or copper ions are also able to be transported by SLC11A2.24) Even though we did not conduct experiments to reveal the transport of other metal cations, we should not abandon the possibility that the three individual miRNAs have the potential to inhibit the transport of other metal cations by SLC11A2.
In this study, we revealed that at least three miRNAs (miR-149-5p, miR-362-5p, and miR-539-5p) individually affected the iron-ion transport function of SLC11A2. However, in addition to SLC11A2, ferroportin (Fpn; SLC40A1), or heme carrier protein1 (HCP1; SLC46A1) are widely known as iron-ion transporters.25,26) Thus, it is possible that three miRNAs (miR-149-5p, miR-362-5p, and miR-539-5p) could bind to SLC40A1 and/or SLC46A1; therefore, we conducted additional in silico experiments.
In silico research with miRWalk2.0 software (which contained 12 algorithms), showed that the number of algorithms that was able to predict the binding of the three individual miRNAs to 3′-UTR of SLC40A1 mRNA was “2,” “1,” and “7” for miR-149-5p, “miR-362-5p, and miR-539-5p, respectively. Furthermore, for SLC46A1 mRNA, the binding-predicted algorithms was “7” in miR-149-5p, “5” in miR-362-5p, and “4” in miR-539-5p, respectively (Data not shown). However, we did not conduct “wet” binding experiments for these three miRNAs to SLC40A1 and SLC46A1 transporters, so there is a possibility that these three miRNAs may also regulate the gene expression of these iron-ion transporters.
Interestingly, the miRNAs (miR-149-5p, miR-362-5p, and miR-539-5p) have been reported to be involved in tumor development and metastasis of various cancers.27–29) Additionally, some studies have reported that miR-149-5p is involved in the accumulation of β-amyloid in Alzheimer’s disease and the promotion of the inflammatory reaction of chondrocytes in osteoarthritis.30,31) Moreover, miR-539-5p plays a role in the formation of choroidal neovascularization.32) However, to the best of our knowledge, no study on the functions identified of the three miRNAs investigated in this study have been previously reported. Therefore, we can emphasize that the results obtained in this study are the new functions of these three miRNAs.
In this study, we revealed that the three computationally extracted miRNAs (miR-149-5p, miR-362-5p, and miR-539-5p) bound SLC11A2 mRNA and regulated its expression, resulting in the regulation of its transport function in a Caco-2 cell culture system.
Our study somewhat revealed the underlying mechanisms of iron-ion transport by the SLC11A2 transporter. However, using these three miRNAs as surrogate biomarkers, there could be further development of therapies for human anemia or diseases caused by the disorder of transporters in the near future. Thus, the proximate experiments for us should be done the similar experiments under in vivo animal conditions.
Yuta Sugino: Conceptualization, project administration, methodology, formal analysis, visualization, and writing—original draft. Reina Uchiyama: Formal analysis, investigation, and visualization. Chihiro Shibasaki: Formal analysis, investigation, visualization. Fumihiko Kugawa: Conceptualization, project administration, supervision, writing—review and editing.
The authors declare no conflict of interest.