Abstract
Evidence from clinical trials suggests that the cardioprotective effects of sodium-glucose cotransporter 2 (SGLT2) inhibitors may arise through non-glycemic control-related mechanisms. Further, the cardiovascular advantages of SGLT2 inhibitors are likely present among non-diabetic patients with known cardiovascular diseases (CVDs). Here, we studied the impact of ipragliflozin, a selective SGLT2 inhibitor, on cardiac histopathology and microRNA (miRNA) expression profiles in a non-diabetic rat model of cardiomyopathy. Ipragliflozin was added to chow (0.01% (w/w)) and given to male DahlS.Z-Leprfa/Leprfa (DS/obese) rats for 6 weeks. Similarly aged male DahlS.Z-Lepr+/Lepr+ (DS/lean) rats were treated as controls. Measurements of systolic blood pressure (SBP) and heart rate (HR) were taken every other week. Following ipragliflozin treatment for 6 weeks, we conducted echocardiography, histopathological examination, and miRNA expression analysis (microarray). The impact of ipragliflozin on blood parameters was additionally examined. In DS/obese rats, ipragliflozin reduced SBP without affecting HR, reduced interventricular septal thickness in echocardiography and left ventricular (LV) organ weight, and improved hypertrophy of cardiomyocytes according to histopathological experiments. Further, ipragliflozin reduced plasma inflammatory cytokine levels in DS/obese rats. Additionally, ipragliflozin treatment altered the expression profile of miRNAs related to cardiac hypertrophy and heart failure in the LV compared to DS/obese control rats. Ipragliflozin prevented LV hypertrophy and altered related miRNA expression profiles in non-diabetic DS/obese rats. These findings suggest that miRNAs may play a partial role in regulating the structure of the heart and that SGLT2 inhibitors may exert cardio-protective effects by changing miRNA expression profiles in non-diabetic patients with CVDs.
INTRODUCTION
Several lines of evidence indicate that sodium-dependent glucose cotransporter 2 (SGLT2) inhibitors improve cardiovascular (CV) outcomes, including CV death, myocardial infarction (MI), and hospitalization for heart failure (HF) in patients with and without type 2 diabetes mellitus (T2DM).1–3) Recent reports have demonstrated that SGLT2 inhibitors have beneficial effects on HF with reduced ejection fraction (HFrEF) along with HF with preserved ejection fraction (HFpEF).4) While studies have suggested that SGLT2 inhibitors may confer cardiovascular benefits through a number of possible mechanisms beyond glycemic control, including SGLT2 inhibitor-mediated diuresis and natriuresis, reducing systemic blood pressure, effects on myocardial sodium and calcium handling, and changing myocardial energetics, how they exert these actions remains to be determined.5–7) Many reports have examined the impact of suppressing SGLT2 on cardiac dysfunction in non-diabetic animal models.8–10) We previously reported a role for the selective SGLT2 inhibitor ipragliflozin in altering cardiac histopathology in DahlS.Z-Leprfa/Leprfa (DS/obese) rats.11) DS/obese rats, which were generated by mating Dahl salt-sensitive rats with Zucker rats possessing a missense mutation in the leptin receptor gene (Lepr),12) have the following notable features: salt-sensitive hypertension, left ventricular (LV) diastolic dysfunction, hypertrophy, and fibrosis, which may be responsible for their premature death.12,13) Although our previous study using this animal model demonstrated that ipragliflozin could attenuate pressure overload or hypertension-induced pathological cardiac remodeling such as LV hypertrophy and fibrosis,11) the underlying molecular mechanisms of these attenuations remain poorly understood.
The actions and mechanisms of microRNAs (miRNAs) in cardiovascular diseases (CVDs) have gained increasing research attention in recent years. Notably, a growing number of studies have examined the utility of miRNAs as novel biomarkers or therapeutic targets for CVDs.14,15) miRNAs are a type of non-coding RNA of 21–25 nucleotides in length found in all eukaryotic cells conserved across a species.16) They play important roles in various pathological and physiological processes. They inhibit the translation of mRNA or facilitate its degradation through total or partial complementary binding to target mRNAs.17) Many miRNAs have been found to be abnormally expressed in the hypertrophic heart, and shown to play a role in regulating cardiac hypertrophy.18) However, it is unclear whether miRNAs contribute to improving cardiac pathology. Recent reports have shown that many miRNAs are dynamically regulated by exercise, diet, and drugs.19,20) To our knowledge, however, no studies have investigated the effects of SGLT2 inhibitors on miRNA expression profiles.
This study explored differences in miRNA expression profiles between DS/lean and DS/obese rats, as well as the impact of ipragliflozin on cardiac miRNA expression profiles in DS/obese rats using miRNA microarray.
MATERIALS AND METHODS
DrugsIpragliflozin L-proline[(1S)-1, 5-anhydro-1-C-[3-[(1-benzothiophen-2-yl) methyl]-4-fluorophenyl]-D-glucitol compound with L-proline (1 : 1)] (PubChem CID: 57339444) was manufactured by Astellas Pharma Inc. (Tsukuba, Japan). It was added to rat chow at a final concentration of 0.01%.
Animal ExperimentsAll animal-related experimental protocols received approval from the Institutional Animal Care and Use Committee of Tsukuba Research Center of Astellas Pharma Inc., which is accredited by the Association for Assessment and Accreditation of Laboratory Animal Care (AAALAC) International. The experiments were performed at CMIC Pharma Science Co., Ltd. (Yamanashi, Japan), which is also accredited by AAALAC International.
Male DahlS.Z-Lepr+/Lepr+ rats (DS/lean rats) and DahlS.Z-Leprfa/Leprfa rats (DS/obese rats) were procured at age five weeks from Japan SLC, Inc. (Shizuoka, Japan). The animals were held in plastic cages with a bedding of autoclave-sterilized wood chips placed in a room with regulated temperature, humidity, and light/dark cycle (lights on 7:00–19:00). All rats had free access to water and standard laboratory diet CE-2 (CLEA Japan, Inc., Tokyo, Japan). The rats were adapted to the laboratory environment for 2 weeks and those lacking abnormal clinical signs were divided into experimental groups at age 7 weeks. Male DS/obese rats were allocated to either the pathological control (DS/obese Control) (n = 15) or ipragliflozin-treated (DS/obese Ipragliflozin) (n = 15) group, ensuring approximately balanced distribution of the average and variance of SBP, body weight, plasma glucose and insulin values. Male DS/lean rats (n = 9) comprised the normal control group. Ipragliflozin was added to the rats’ diet (0.01%, w/w), which was made freely available. The selected dose of ipragliflozin was found by a prior study to facilitate urinary glucose excretion among rats.11,21–23) The amount of food consumed in 24 h was determined once when the rats were aged 6 weeks and then at weekly intervals thereafter.
Analysis of Blood and UrineBlood was taken from unfasted rats at age 6 and 12 weeks from the jugular vein in the morning and at age 13 weeks from the abdominal vena cava following echocardiography assessments while anesthetized with isoflurane. Plasma glucose and serum electrolyte (Na, Cl, K) concentrations were determined with an automatic clinical chemistry analyzer (JCA-BM6010, JEOL Ltd., Tokyo, Japan). Further, plasma insulin was quantified using a rat insulin enzyme-linked immuno-sorbent assay (ELISA) kit (AKRIN-010T, Shibayagi Co., Ltd., Gunma, Japan) at appointed time points. Moreover, plasma angiotensin II (Ang II), aldosterone, B-type natriuretic peptide (BNP), and renin were assessed by a Rat Ang II ELISA Kit (LS-F23256, LifeSpan BioSciences, Inc., WA, U.S.A.), Aldosterone ELISA kit (ab136993, Abcam plc., Cambridge, U.K.), Rat BNP Assay Kit (K153KFD-1, Meso Scale Diagnostics, LLC., MD, U.S.A.), and Rat Renin (REN) ELISA kit (KT-27339, Kamiya Biomedical Company, WA, U.S.A.), respectively. Additionally, plasma interleukin (IL)-1β, IL-6, tumor necrosis factor α (TNF-α), C reactive protein (CRP), and intercellular adhesion molecule (ICAM)-1 were evaluated by employing commercial ELISA kits (RLB00, R6000B, RTA00, DY1744, RIC100, R&D Systems Inc., Minneapolis, MN, U.S.A.).
The volume of urine excreted across a 24-h period was measured at age 6 and 12 weeks in unfasted rats. Each urine sample was subjected to glucose and electrolyte measurements using an automatic clinical chemistry analyzer (JCA-BM6010, JEOL Ltd.).
Measurement of Blood Pressure and Heart RateSBP, mean blood pressure (MBP) and HR were measured non-invasively using a tail-cuff attached to an automatic blood pressure device (BP-98A-L, Softron Co., Ltd., Tokyo, Japan). Rats were first warmed in a thermostatic box (approximately 32 °C) before being transferred to a thermostatic unit (approximately 38 °C) prior to BP and HR measurement.
EchocardiographyEchocardiography was conducted based on an adapted method used in our previous study.11) At the end of the administration period, when rats were aged 13 weeks, the animals were subjected to isoflurane inhalation anesthesia and transferred to a heating pad to regulate their body temperature. With the rats laying in the left lateral position, a linear probe (L64 probe, 18–5 MHz, Hitachi Medical Co., Ltd., Tokyo, Japan) attached to an ultrasonic diagnostic apparatus (ALOKA LISENDO 880, Hitachi, Ltd.) was used to take a cross-sectional image along the LV short-axis at the level of the papillary muscle in M-mode. LV end-diastolic dimension (LVDd), end-systolic dimension (LVDs), along with the thickness of the interventricular septum (IVSTd) and LV posterior wall (LVPWTd) were determined. Further, the relative wall thickness (RWT) was determined using the equation RWT = (LVSTd + LVPWTd)/LVDd and LV mass using the equation LV mass = 1.04 × ((IVSTd + LVDd + LPWTd)3−LVDd3) × 0.8) + 0.14. Calculations to ascertain the LV ejection fraction (EF), fractional shortening (FS), cardiac output (CO) and stroke volume (SV) were additionally performed. Further, LV diastolic function was confirmed by first acquiring an apical five-chamber tomographic image of the heart and then measuring the flow velocity pattern of blood inflow and outflow through the LV according to the pulse Doppler method. E/A and E-wave deceleration times (DecT) were determined in animals showing discrete and well-defined E-waves and A-waves in the echocardiogram. Total peripheral resistance (TPR) was calculated as follows: TPR = MBP/CO.
HistopathologyPromptly following the echocardiogram, the LV was dissected and fixed in 4% paraformaldehyde. After trimming, the tissue specimen was transferred to a cassette and embedded using an automatic fixed embedding device (ETP-150 CV and VIP-J0, Sakura Finetek Japan Co, Ltd., Tokyo, Japan) before being cut into thin sections. Each tissue section was reacted with hematoxylin-eosin (H&E) to allow the myocardial cross-sectional area to be measured; with mouse monoclonal anti-CD68 antibody/anti-mouse antibody (ab31630, Abcam plc.) to identify macrophages, and with terminal deoxynucleotidyl transferase (TdT)-mediated deoxyuridine triphosphate (dUTP) Nick End Labeling (TUNEL) (Apop Tag® Peroxidase In Situ Apoptosis Detection Kit, S7100, EMD Millipore Corporation, CA, U.S.A.) to measure the extent of apoptosis. An image analysis program (WinRoof 2013, Mitani Corporation, Tokyo, Japan) was used to determine the LV myocardial cross-sectional area, cardiac fibrosis, and number of CD68-positive and apoptotic (TUNEL-positive) cells. Briefly, the LV myocardial cross-sectional area was determined by counting the cell number in 3 randomly selected fields at 40× magnification. The average LV myocardial cross-sectional area was calculated by dividing the total area of the 3 selected fields by the cell number. To determine the number of CD68-positive cells, the number of CD68-positive cells was counted in 5 randomly selected fields at 40× magnification and summed. The average number of CD68-positive cells was then calculated by dividing this sum by 5 (the number of fields). The average number of TUNEL-positive cells was calculated in the same manner as CD68-positive cells.
RNA Extraction and Microarray Analysis of microRNA ExpressionRNA extraction, RNA labeling, and hybridization to miRNA microarray chips were performed by TaKaRa-Bio Inc. (Shiga, Japan). Total RNA was extracted from LV samples using QIAzol Lysis Reagent and an RNeasy® Mini Kit (Qiagen, Hilden, Germany) according to the manufacturer’s instructions. The quality of the total RNA was analyzed using a NanoDrop (Nano Drop; Thermo Fisher Scientific, Inc., Wilmington, DE, U.S.A.) and the Agilent 2100 Bioanalyzer (Agilent Technologies, Inc., CA, U.S.A.). Cyanine 3 (Cy3) labeling was performed using a miRNA Complete Labeling and Hybridization Kit (Agilent Technologies, Inc.) according to the manufacturer’s instructions. Briefly, 100 ng of total RNA was dephosphorylated and then subjected to 3′-end labeling with Cy3 fluorescence using T4 RNA Ligase. Labeling Spike-In from a miRNA Spike-In Kit (Agilent Technologies, Inc.) was added to perform the reaction. After Cy3 labeling, hybridization to microarrays was conducted with a miRNA Complete Labeling and Hybridization Kit (Agilent SurePrint Rat miRNA Microarray, Release 21.0, Agilent Technologies, Inc.). Hybridization Spike-In from a miRNA Spike-In Kit (Agilent Technologies, Inc.) was added during hybridization. After hybridization, the microarray was washed, and images were taken and signals detected using an Agilent SureScan Microarray Scanner (Agilent Technologies, Inc.) controlled by Agilent Scan Control software. The images were digitalized using Agilent Feature Extraction software (Agilent Technologies, Inc.), and raw data were created. We confirmed that there were no problems in the image data using the QC report generated by the Agilent Scan Control software (Agilent Technologies, Inc.). Based on the QC report, we also confirmed that the percentage of feature non-uniformity outliers did not exceed 1.0%. Raw data from all samples obtained from the Agilent Feature Extraction software were normalized using Agilent GeneSpring 14.8 (Agilent Technologies, Inc.). The individual miRNA expression values obtained from the Agilent miRNA microarray were normalized and filtered, and the miRNA groups showing variations in Student's t-test (t-test) were extracted. Data with low reliability were removed based on quantification of spot signals by the Agilent Feature Extraction software (Agilent Technologies, Inc.) for each sample. The corrected log expression level of miRNA in each sample (Log2 normalized signal) was used for the t-test, and the p-value was calculated. After correcting the p-value using Benjamini-Hochberg multiple testing correction, miRNA groups with significant differences were assessed. Significantly altered miRNAs were identified based on a corrected p value (false discovery rate [FDR]) < 0.05. Expression ratios were calculated using average expression levels of miRNAs (Average Log2 Signal) showing a significant difference and compared with each Log2 fold change (Log2FC) as the critical point (Log2FC ≥ 2, FDR ≤ 0.05).
Statistical AnalysisQuantitative findings are reported as mean ± standard error of the mean (S.E.M.). An F test for homogeneity of variance was adopted to analyze differences between DS/lean and DS/obese control groups, and DS/obese control and ipragliflozin-treated groups. Meanwhile, Student’s t-test or Aspin-Welch’s t-test was used to analyze heterogeneous data. Further, the Wilcoxon rank sum test was employed for comparison of histopathological findings between the DS/lean and DS/obese control groups, and DS/obese and ipragliflozin-treated groups. Finally, the log rank test was utilized to examine differences in survival rate between the DS/lean and DS/obese control groups, and DS/obese and ipragliflozin-treated groups. p-Values less than 0.05 were used to indicate statistical significance. All analyses were performed with SAS for Windows, version 9.3. (SAS Institute Japan Ltd., Tokyo, Japan).
RESULTS
Body Weight and Survival RateFigure 1A shows the variation in body weight in all groups. Across all ages except 13 weeks, rats in the DS/obese control group had greater average body weight than those in the DS/lean group. The ipragliflozin-treated group had significantly higher body weight than the DS/obese control group at age 11, 12, and 13 weeks. In terms of survival rate, 4 of 15 DS/obese rats did not survive through the study period. According to the log rank test, DS/obese rats showed significantly reduced survival rate compared to DS/lean rats and those in the ipragliflozin-treated group (Fig. 1B). No deaths occurred in either of the latter groups (Fig. 1B).
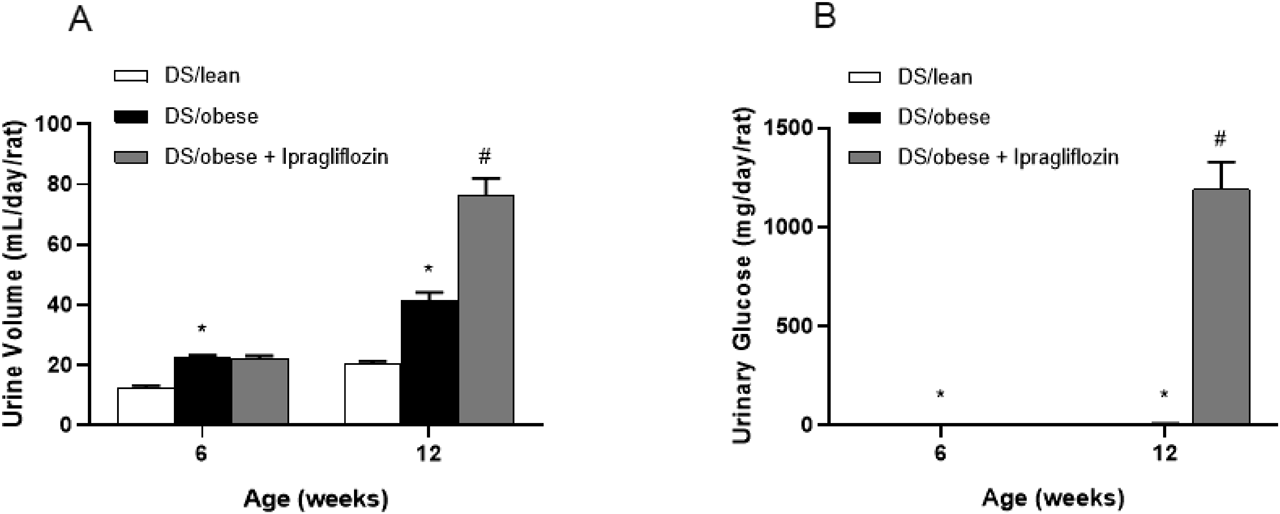
Urine Volume and Urinary Glucose ExcretionFigure 2 presents the average daily urine volume and urinary glucose excretion measured at age 6 and 12 weeks. The DS/obese control group produced a greater average urine volume than the DS/lean group at both 6 and 12 weeks. While neither the DS/lean nor DS/obese control group demonstrated measurable levels of urinary glucose, ipragliflozin treatment elevated both urine volume and urinary glucose excretion.
Blood Pressure and Heart RateTable 1 shows the results for SBP, MBP and HR. In the DS/obese control group, average SBP and MBP became progressively elevated with age. Compared to the DS/obese control group, the ipragliflozin-treated group had lower SBP at age 9, 11 and 13 weeks, and lower MBP at age 9 and 11 weeks. In contrast, the DS/obese control group had mildly reduced HR compared to the DS/lean group across all ages. In contrast, the ipragliflozin-treated and DS/obese control groups showed comparable HR.
Table 1. Systolic Blood Pressure, Mean Blood Pressure and Heart Rate of DS/Lean and DS/Obese Rats
| Age (weeks) | DS/lean | DS/obese |
|---|
| Control n = 9 | Control n = 15 | Ipragliflozin n = 15 |
|---|
| SBP (mmHg) | 6 | 133 ± 3 | 140 ± 2 | 140 ± 3 |
| 9 | 144 ± 2 | 187 ± 3* | 158 ± 4# |
| 11 | 153 ± 2 | 210 ± 3* | 185 ± 4# |
| 13 | 151 ± 1 | 226 ± 7* (11) | 201 ± 6# |
| MBP (mmHg) | 6 | 112 ± 3 | 114 ± 2 | 119 ± 3 |
| 9 | 124 ± 1 | 157 ± 3* | 134 ± 3# |
| 11 | 132 ± 2 | 180 ± 4* | 159 ± 4# |
| 13 | 133 ± 2 | 191 ± 7* (11) | 176 ± 6 |
| HR (beats/min) | 6 | 436 ± 8 | 424 ± 6 | 422 ± 7 |
| 9 | 423 ± 5 | 392 ± 7* | 390 ± 5 |
| 11 | 407 ± 8 | 393 ± 7 | 396 ± 8 |
| 13 | 412 ± 9 | 404 ± 10 (11) | 396 ± 8 |
SBP, systolic blood pressure; MBP, mean blood pressure; HR, heart rate. Values in parentheses indicate the number of animals. Data are mean ± S.E.M. * p < 0.05 relative to DS/lean control group, # p < 0.05 relative to DS/obese control group, Student’s t-test or Aspin-Welch’s t-test.
Table 2 summarizes the echocardiography findings acquired at age 13 weeks following 6 weeks of ipragliflozin administration. The LV wall and lumen-related parameters, LVDd, LVDs and RWT, were comparable, while IVSTd, LVPWTd and LV mass were higher in DS/obese control relative to DS/lean rats. While treatment with ipragliflozin had no effect on LVDd, LVDs, LVPWTd, RWT or LV mass, it significantly reduced IVSTd compared to DS/obese control. Meanwhile, the systolic function-related variables, EF, FS, CO and SV, were comparable between DS/obese control and DS/lean rats. In contrast, TPR was higher in the DS/obese control group than the DS/lean group. Treatment with ipragliflozin had no effect on these variables. Similarly, the diastolic function-related measures, E/A and DecT, an indicator of LV relaxation, were comparable between DS/obese control and DS/lean rats. Ipragliflozin had no impact on these measures.
Table 2. Echocardiography Variables in DS/Lean and DS/Obese Rats Following 6 Weeks of Ipragliflozin
| DS/lean | DS/obese |
|---|
| Control n = 8 | Control n = 11 | Ipragliflozin n = 14 |
|---|
| Left ventricle wall and lumen |
| LVDd (mm) | 7.67 ± 0.18 | 7.98 ± 0.16 | 8.06 ± 0.11 |
| LVDs (mm) | 3.66 ± 0.23 | 3.85 ± 0.25 | 3.78 ± 0.15 |
| IVSTd (mm) | 2.01 ± 0.04 | 2.22 ± 0.04* | 2.08 ± 0.04# |
| LVPWTd (mm) | 2.06 ± 0.06 | 2.26 ± 0.07* | 2.16 ± 0.08 |
| RWT | 0.534 ± 0.021 | 0.564 ± 0.019 | 0.527 ± 0.015 |
| LV mass (mg) | 972.1 ± 29.7 | 1188.9 ± 39.9* | 1115.0 ± 42.1 |
| Systolic function |
| EF (%) | 87.4 ± 1.7 | 86.6 ± 1.7 | 87.7 ± 1.2 |
| FS (%) | 52.6 ± 2.0 | 52.2 ± 2.3 | 53.2 ± 1.5 |
| CO (L/min) | 0.33 ± 0.02 | 0.32 ± 0.02 | 0.34 ± 0.01 |
| SV (mL) | 0.9 ± 0.0 | 1.0 ± 0.0 | 1.0 ± 0.0 |
| TPR (mmHg/L/min) | 410 ± 29 | 610 ± 45* | 523 ± 34 |
| Diastolic function |
| E/A | 1.02 ± 0.08 (5) | 1.02 ± 0.02 (10) | 1.04 ± 0.03 (12) |
| DecT (ms) | 45 ± 1 | 44 ± 1 | 44 ± 1 |
Values in parentheses indicate the number of animals. LVDd, left ventricle dimensions at end-diastole; LVDs, left ventricle dimensions at end-systole; IVSTd, interventricular septal thickness at end-diastole; LVPWTd, left ventricle posterior wall thickness; RWT, relative wall thickness; EF, ejection fraction; FS, fractional shortening; CO, cardiac output; SV, stroke volume; TPR, total peripheral resistance; E/A, index of the diastolic function of the left ventricle; DecT, E-wave deceleration time; LV mass, left ventricle mass. E/A and DecT were determined in animals showing discrete and well-defined E-waves and A-waves in the echocardiogram. LV mass = 1.04 × ((IVSTd + LVDd + LPWTd)3–LVDd3) × 0.8) + 0.14; RWT = (LVSTd + LVPWTd)/LVDd; TPR = MBP/CO. Data are mean ± S.E.M. * p < 0.05 relative to DS/lean control group, # p < 0.05 relative to DS/obese control group, Student’s t-test.
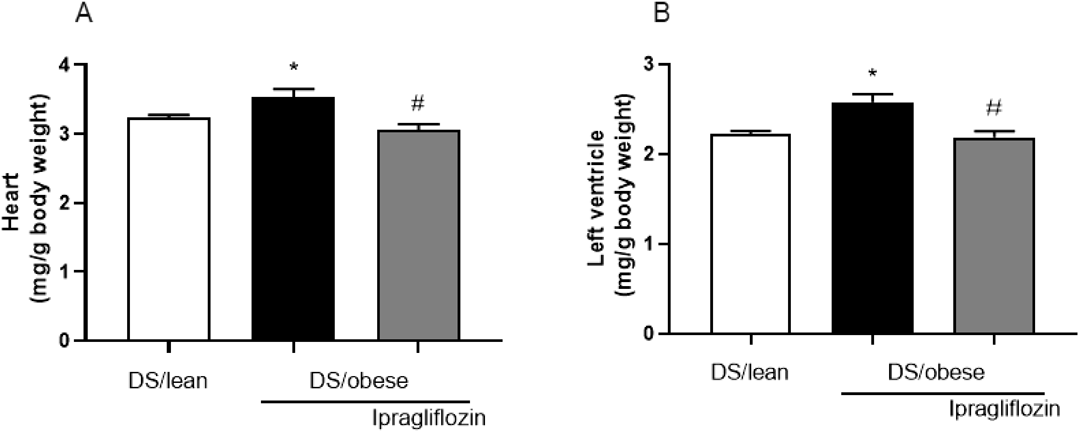
Figure 3 displays the rats’ heart weight and LV weight relative to body weight. The DS/obese control group had significantly higher average heart weight and LV weight relative to body weight than the DS/lean group. The corresponding weights in the ipragliflozin-treated group were significantly lower than those in the DS/obese control group.
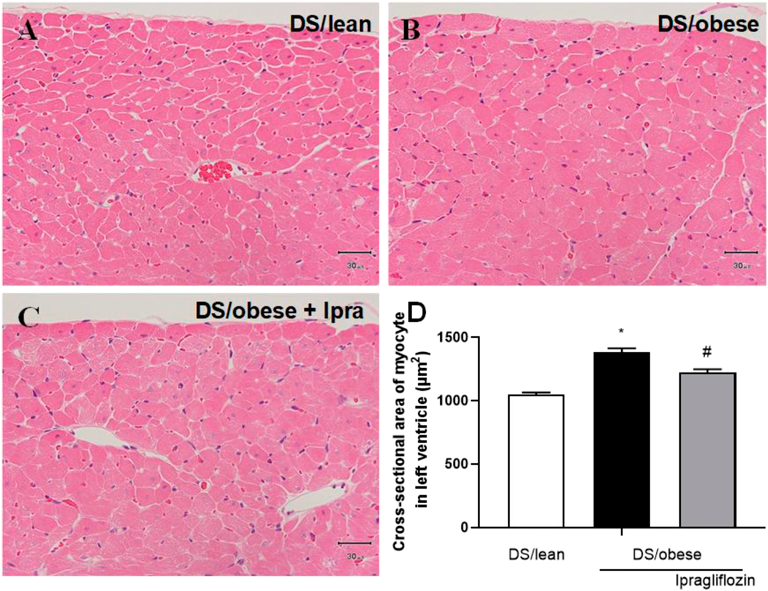
Histopathological ExaminationFigure 4 shows representative images of H&E-stained sections of the LV used to measure the myocardial cross-sectional area. According to microscopic analysis, the DS/obese control group had a larger cross-sectional area of cardiomyocytes than the DS/lean group. Treatment with ipragliflozin led to a significant reduction in the cross-sectional area relative to DS/obese control rats.
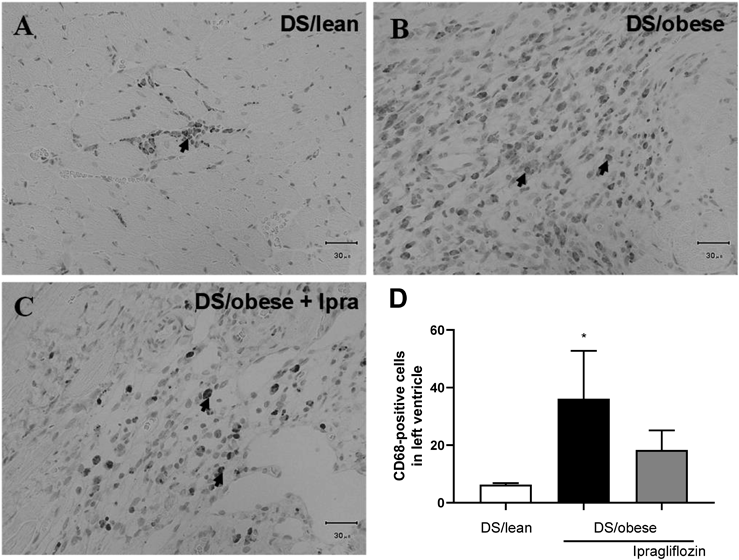
Figure 5 presents micrographs of LV sections labeled with the monocyte-macrophage marker CD68. On average, there were more CD68-positive cells in the DS/obese control group relative to the DS/lean group. Ipragliflozin-treated rats had a slightly, but not significantly, lower average number of CD68-positive cells compared to DS/obese control animals (p = 0.222).
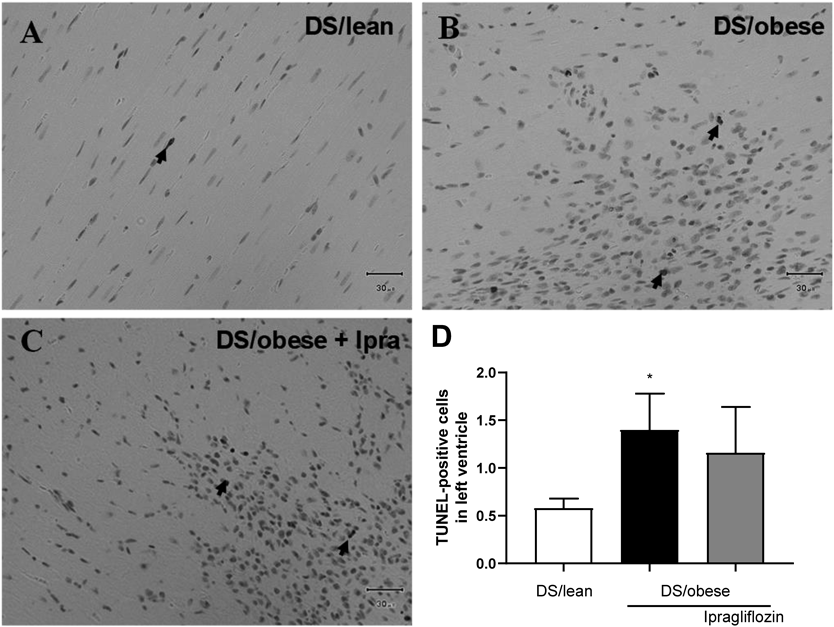
Figure 6 shows immunostaining for TUNEL-positive cells in the LV. The DS/obese control group had a higher average number of TUNEL-positive cells than the DS/lean group. Ipragliflozin treatment decreased the average number of TUNEL-positive cells, although not significantly so, relative to DS/obese control rats (p = 0.085).
Blood Chemical AnalysisTable 3 summarizes the blood chemistry and serum electrolyte findings in 6- and 12-week-old rats. While average plasma glucose was similar between the groups at 6 and 12 weeks, average plasma insulin levels in the DS/obese control group were higher than those in the DS/lean group at age 6 weeks. Ipragliflozin treatment had no effect on plasma insulin. Average serum Na levels in the DS/lean group and DS/obese control group were comparable at both age points. Treatment with ipragliflozin decreased serum Na levels. Average serum Cl levels were lower in 6-week-old DS/obese control relative to DS/lean rats. Treatment with ipragliflozin decreased serum Cl levels compared to DS/obese control animals. While average serum K levels were elevated in the DS/obese control group relative to the DS/lean group at age 6 weeks, they were lower at age 12 weeks. Ipragliflozin had no impact on serum K.
Table 3. Blood Parameters and Serum Electrolyte Concentrations in DS/Lean and DS/Obese Rats Aged 6 and 12 Weeks
| Age (weeks) | DS/lean | DS/obese |
|---|
| Control n = 9 | Control n = 15 | Ipragliflozin n = 15 |
|---|
| Glucose (mg/dL) | 6 | 135 ± 2 | 140 ± 3 | 140 ± 3 |
| 12 | 117 ± 2 | 125 ± 5 (13) | 110 ± 5 |
| Insulin (ng/mL) | 6 | 1.6 ± 0.2 | 14.0 ± 1.5* | 14.2 ± 2.1 |
| 12 | 3.0 ± 0.5 | 4.4 ± 0.8 (13) | 9.0 ± 4.5 |
| Na (mEq/L) | 6 | 142 ± 0 | 142 ± 1 | 142 ± 1 |
| 12 | 143 ± 0 | 142 ± 4 (13) | 127 ± 2# |
| Cl (mEq/L) | 6 | 107 ± 1 | 104 ± 1* | 103 ± 1 |
| 12 | 103 ± 0 | 100 ± 4 (13) | 85 ± 2# |
| K (mEq/L) | 6 | 5.9 ± 0.1 | 6.2 ± 0.1* | 6.2 ± 0.1 |
| 12 | 5.4 ± 0.1 | 4.6 ± 0.1* (13) | 4.7 ± 0.1 |
Values in parentheses indicate the number of animals. Data are mean ± S.E.M. * p < 0.05 relative to DS/lean control group, # p < 0.05 relative to DS/obese control group, Student’s t-test or Aspin-Welch’s t-test.
Table 4 displays blood pressure-related hormone and plasma inflammatory cytokine concentrations measured at age 13 weeks. While DS/obese control rats showed significantly higher plasma renin, BNP, IL-1β, IL-6, TNF-α, CRP and ICAM-1, they had comparable plasma Ang II and aldosterone concentrations to DS/lean animals. Ipragliflozin reduced plasma renin, Ang II, aldosterone, IL-1β, IL-6, TNF-α, CRP and ICAM-1 levels compared with the DS/obese control group.
Table 4. Blood Parameters in DS/Lean and DS/Obese Rats Aged 13 Weeks
| DS/lean | DS/obese |
|---|
| Control n = 9 | Control n = 13 | Ipragliflozin n = 15 |
|---|
| Renin (pg/mL) | 6.0 ± 4.2 (8) | 58.8 ± 5.2* (11) | 26.9 ± 7.8# (14) |
| Angiotensin II (pg/mL) | 38.2 ± 1.8 (8) | 43.3 ± 3.2 (11) | 26.9 ± 1.8# (14) |
| Aldosterone (pg/mL) | 444.2 ± 48.7 (8) | 390.7 ± 47.0 (11) | 195.2 ± 23.9# (14) |
| BNP (pg/mL) | 20.8 ± 3.2 (8) | 68.2 ± 10.9* (11) | 65.0 ± 8.1 (14) |
| IL-1β (pg/mL) | 204.8 ± 7.8 | 349.9 ± 21.4* | 242.5 ± 15.6# |
| IL-6 (pg/mL) | 244.5 ± 28.4 | 727.2 ± 34.1* | 537.9 ± 42.6# |
| TNF-α (pg/mL) | 115.5 ± 9.3 | 208.2 ± 7.1* | 173.5 ± 9.6# |
| CRP (ng/mL) | 309.0 ± 27.8 | 494.7 ± 39.2* | 395.5 ± 18.7# |
| ICAM-1 (pg/mL) | 293.0 ± 48.1 | 2015.9 ± 178.2* | 1505.6 ± 109.6# |
Values in parentheses indicate the number of animals. BNP, B-type natriuretic peptide; IL-1β, interleukin-1β; IL-6, interleukin-6; TNF-α, tumor necrosis factor-α; CRP, C reactive protein; ICAM-1, intercellular adhesion molecule-1. Data are mean ± S.E.M. * p < 0.05 relative to DS/lean control group, # p < 0.05 relative to DS/obese control group, Student’s t-test or Aspin-Welch’s t-test.
Analysis of LV miRNA microarray results showed that 32 miRNAs were upregulated in DS/obese control relative to DS/lean animals. Of these, 28, namely miR-208b-3p, miR-132-3p, miR-148a-3p, miR-582-5p, miR-190a-5p, miR-31a-5p, miR-340-5p, miR-3584-5p, miR-466-2-3p, miR-222-3p, miR-3084a-3p, miR-350, miR-202-3p, miR-201-5p, miR-34c-5p, miR-18a-5p, miR-3102, miR-362-5p, miR-3584-3p, miR-425-3p, miR-1839-3p, miR-34b-5p, miR-5132-3p, miR-339-3p, miR-144-3p, miR-668, miR-1843a-5p, and miR-674-5p, were significantly downregulated in the ipragliflozin-treated DS/obese group compared with the DS/obese control group. One miRNA, namely miR-9a-3p, was downregulated in DS/obese control relative to DS/lean rats, but was not detected in the ipragliflozin-treated DS/obese group (Table 5).
Table 5. miRNAs Identified in the LV of DS/Lean Rats
versus DS/Obese Rats and DS/Obese Rats
versus DS/Obese Rats Treated with Ipragliflozin
| miRNA | DS/lean vs. DS/obese | DS/obese vs. Ipragliflozin-treated DS/obese |
|---|
| Log2FC | FDR | Log2FC | FDR |
|---|
| Upregulated | | | Downregulated | |
| rno-miR-208b-3p | 8.61 | ** | −0.64 | * |
| rno-miR-132-3p | 6.39 | ** | −4.73 | ** |
| rno-miR-148a-3p | 6.13 | ** | −2.72 | * |
| rno-miR-582-5p | 6.09 | ** | −4.49 | ** |
| rno-miR-190a-5p | 5.69 | ** | −2.50 | * |
| rno-miR-31a-5p | 5.64 | ** | −3.79 | * |
| rno-miR-340-5p | 4.95 | ** | −2.49 | * |
| rno-miR-3584-5p | 4.87 | ** | −3.76 | ** |
| rno-miR-141-3p | 4.66 | ** | 0.55 | |
| rno-miR-466b-2-3p | 4.47 | ** | −6.33 | ** |
| rno-miR-222-3p | 4.39 | ** | −0.86 | ** |
| rno-miR-3084a-3p | 4.38 | ** | −2.82 | ** |
| rno-miR-350 | 4.34 | ** | −1.97 | * |
| rno-miR-202-3p | 3.89 | ** | −4.09 | ** |
| rno-miR-201-5p | 3.78 | ** | −2.21 | * |
| rno-miR-34c-5p | 3.63 | ** | −2.99 | * |
| rno-miR-18a-5p | 3.50 | ** | −2.70 | ** |
| rno-miR-3102 | 3.39 | ** | −5.50 | ** |
| rno-miR-142-5p | 3.32 | ** | −1.69 | |
| rno-miR-362-5p | 3.12 | ** | −3.31 | ** |
| rno-miR-143-5p | 3.00 | ** | −0.19 | |
| rno-miR-3584-3p | 2.99 | * | −3.94 | ** |
| rno-miR-425-3p | 2.93 | ** | −5.51 | ** |
| rno-miR-1839-3p | 2.85 | ** | −2.81 | ** |
| rno-miR-34b-5p | 2.80 | ** | −0.58 | ** |
| rno-miR-5132-3p | 2.58 | * | −3.51 | ** |
| rno-miR-339-3p | 2.56 | ** | −1.64 | * |
| rno-miR-144-3p | 2.36 | ** | −1.12 | ** |
| rno-miR-668 | 2.31 | ** | −4.68 | ** |
| rno-miR-1843a-5p | 2.24 | * | −2.37 | * |
| rno-miR-30d-3p | 2.19 | * | −1.92 | |
| rno-miR-674-5p | 2.02 | * | −2.79 | ** |
| Downregulated | | | | |
| rno-miR-9a-3p | −4.48 | ** | NaN | |
FC, fold change; FDR, false discovery rate; miRNA/miR, microRNA; NaN, not a number. miRNAs were treated as confidently dysregulated if they showed either a |log2FC| ≥ 2 or statistically significant dysregulation between groups. Asterisks represent a log2FC that reached FDR-corrected statistical significance (* p < 0.05, ** p < 0.01, Student’s t-test).
DISCUSSION
The cardio-protective effectiveness of SGLT2 inhibitors and their underlying molecular mechanisms beyond glycemic control have gain widespread attention in recent years. Although some cardio-protective mechanisms of SGLT2 inhibitors have been suggested,24,25) details of these mechanisms remain unclear. Recently, several reports have demonstrated the involvement of miRNAs in heart diseases such as cardiac hypertrophy and HF, and suggested their potential as biomarkers and therapeutic targets.15,18,26) However, changes in the expression profiles of miRNAs involved in cardiac hypertrophy and HF due to SGLT2 inhibitor administration have not been reported. Thus, we examined the cardio-protective role of the selective SGLT2 inhibitor ipragliflozin in cardiac hypertrophy and miRNA expression profiles in DS/obese rats, a non-diabetic model of cardiomyopathy.
We showed that ipragliflozin prevented cardiac hypertrophy and improved the survival rate in DS/obese rats, in the absence of any impact on glycemic levels. DS/obese rats are characterized by salt-sensitive hypertension, LV diastolic dysfunction, hypertrophy, and fibrosis, features that could explain their premature death.12,13) Consistent with previous reports,12,13) 4 of 15 DS/obese rats did not survive until the end of the experimental period. Unfortunately, we were unable to identify the cause of death, although it is likely that the aforementioned characteristics of DS/obese rats were contributing factors. In contrast, all ipragliflozin-treated DS/obese rats survived the study period, suggesting that the drug’s cardio-protective actions, including the reduction in SBP and prevention of cardiac hypertrophy, may contribute to survival. The reduction in SBP observed following ipragliflozin administration possibly underlies the drug’s cardio-protective actions. Lower blood pressure, probably arising from ipragliflozin-induced osmotic diuresis, is expected to decrease the cardiac pressure load and cardiac volume load. In addition, treatment with ipragliflozin decreased renin-angiotensin aldosterone system (RAAS)-related hormones, which may also have contributed to ameliorating SBP. Easing of the cardiac burden could play a role in cardio-protection and survival. In addition, several studies have reported the beneficial effects of SGLT2 inhibitors including ipragliflozin on endothelial dysfunction in animal models of diabetes.27–29) In the present study, we calculated TPR from the MBP and CO. HF is distinguished by a rise in TPR to compensate for the fall in CO.30) Long-term upregulation of TPR tends to harm cardiac performance and tissue perfusion, eventually leading to a quickening of HF progression. TPR levels were higher in DS/obese rats and ipragliflozin decreased these levels, albeit not to a statistically significantly extent (p = 0.1306). Ipragliflozin may have improved the stiffness of the vessel wall and reduced vascular resistance. Elevated levels of inflammatory cytokines are also correlated with increased arterial stiffness associated with hypertension.31)
Chronic systemic inflammation plays a critical role in the development of CVDs.32) Increased levels of TNF-α, IL-6, IL-1β and CRP have been reported in patients with HF,33) suggesting that proinflammatory cytokines could be major contributors to the pathogenesis of HF. A previous study proposed that SGLT2 inhibitors may reduce inflammatory markers and improve cardiovascular outcomes and mortality.34) Consistent with this, ipragliflozin reduced inflammatory marker levels in this study, which could constitute a major mechanism by which SGLT2 inhibitors exert their cardiovascular actions. Several studies have shown significant elevation of CD68 expression in macrophages in response to inflammatory stimulation.35) In this study, DS/obese control rats showed elevated CD68-positive cell numbers in the LV and, albeit not significantly so, ipragliflozin reduced this number slightly.
Cardiac cell death or apoptosis has also been linked to cardiovascular hypertrophy and the progression of HF,36) with myocardial cell apoptosis having been reported in several animal models of cardiac hypertrophy.37) We showed that TUNEL-positive cells were increased in the LV of DS/obese control rats and, albeit not significantly so, ipragliflozin administration decreased this number slightly.
Increasing evidence is showing that miRNAs act as important regulators in cardiac hypertrophy.18,38) Upregulation of several of miRNAs has been linked to cardiac hypertrophy, cardiac fibrosis, HF, MI, the inflammatory response, and apoptosis.18,39) The present study identified markedly different LV miRNA expression profiles in DS/obese control relative to DS/lean rats, suggesting that miRNAs may play important roles in the transition from hypertension to the onset of cardiac hypertrophy. Further, ipragliflozin reduced SBP and relative LV weight in DS/obese rats, and induced different miRNA expression profiles, suggesting that miRNAs may play important roles in the progression or inhibition of cardiac hypertrophy. Similar to a previous study that used aged spontaneously hypertensive rats (SHRs), we found that upregulation of miR-208b-3p, miR-132-3p, miR-31a-5p, and miR-222-3p was associated with cardiac hypertrophy.40) miR-208 is one of the most important cardiac-enriched miRNAs, playing a crucial role in CV health and diseases. Meanwhile, miR-208b is a proposed a marker for cardiac hypertrophy41) and MI,42) and may be associated with LV remodeling events after MI.43) In genetic and pharmacological in vitro and in vivo models, miR-132 has been shown to induce cardiac hypertrophy.44) Recent studies have reported the inhibitory effects of antimiR-132 on cardiomyocyte hypertrophy in cardiac hypertrophy model animals45) and the safety and potential first efficacy signals of antimiR-132 in patients with HF.46) HF is a complex disease in which cardiomyocyte injury leads to activation of a cascade of inflammatory and fibrosis pathways.47) Cardiac expression of miR-31a-5p is upregulated in rats suffering from post-infarction HF.48) Meanwhile, miR-222-3p plays a role in cardiac hypertrophy and HF.49) Increased expression of miR-223-3p in the LV of left coronary artery ligation-induced MI rats after surgery may predict the development of HF. In addition to these miRNAs, upregulation of miR-350 and downregulation of miR-9 were identified as being involved in cardiac hypertrophy in this study. miR-350 has been implicated in cardiomyocyte hypertrophy and apoptosis of cardiac cells in rat models of transverse aortic constriction HF. In heart-derived H9c2 cells, overexpression of miR-350 induces hypertrophy of cardiomyocytes.50) A previous study reported a decrease in miR-9 in the heart of a mouse model of cardiac hypertrophy established by administering isoproterenol or aldosterone, and that administration of miR-9 attenuated cardiac hypertrophy and ameliorated cardiac function.51) Thus, the present study identified several miRNAs related to cardiac hypertrophy in DS/obese rats, and showed that ipragliflozin altered their expression profiles.
The present study clearly showed that ipragliflozin ameliorated LV hypertrophy, improved DS/obese rat survival, and reversed the expression profiles of miRNAs previously linked to cardiac hypertrophy and HF. Our results suggest that ipragliflozin-mediated changes to miRNA expression profiles may help to suppress cardiac hypertrophy.
However, several limitations warrant mention. First, while there was a correlation between the results of qualitative analysis of miRNAs by microarray and the results of quantitative analysis using RT-PCR, RT-PCR analysis is needed to verify the data.52) Second, while we showed that ipragliflozin treatment altered the miRNA profile, it remains unclear whether these changes were specifically brought about by SGLT2 inhibition or were the result of suppressed myocardial remodeling. Third, further studies are needed to explore the regulatory mechanisms and signaling pathways through which miRNAs mediate the cardio-protective actions of SGLT2 inhibitors. Finally, although miRNAs have been reported to be conserved across species,16) whether or not similar changes in expression occur in human samples requires confirmation.
In summary, ipragliflozin improved LV hypertrophy and LV wall thickness in a non-diabetic cardiomyopathy rat model in the absence of any impact on plasma glucose. This study identified different miRNA expression profiles in DS/lean rats, DS/obese rats, and DS/obese animals administered ipragliflozin, indicating that miRNAs may play an important role in cardiac hypertrophy. Although further studies are needed to determine the role of miRNAs, the molecular targets of ipragliflozin, and the signaling pathways involved, this research suggests that miRNAs may play a partial role in regulating the structure of the heart, and that SGLT2 inhibitors may exert cardio-protective effects by changing miRNA expression profiles in non-diabetic patients with CVDs.
Acknowledgments
We thank the staff at CIMIC Pharma Science Co., Ltd. and TaKaRa Bio Inc. for providing technical assistance. This research did not receive any specific grant from funding agencies in the public, commercial, or not-for-profit sectors.
Conflict of Interest
T. Takasu is an employee of Astellas Pharma Inc. The study was funded by Astellas Pharma Inc.
REFERENCES
- 1) Perkovic V, Jardine MJ, Neal B, et al. Canagliflozin and renal outcomes in type 2 diabetes and nephropathy. N. Engl. J. Med., 380, 2295–2306 (2019).
- 2) McMurray JJV, Solomon SD, Inzucchi SE, et al. Dapagliflozin in patients with heart failure and reduced ejection fraction. N. Engl. J. Med., 381, 1995–2008 (2019).
- 3) Packer M, Anker SD, Butler J, et al. Cardiovascular and renal outcomes with empagliflozin in heart failure. N. Engl. J. Med., 383, 1413–1424 (2020).
- 4) Pabel S, Hamdani N, Luedde M, Sossalla S. SGLT2 Inhibitors and their mode of action in heart failure-has the mystery been unravelled? Curr. Heart Fail. Rep., 18, 315–328 (2021).
- 5) Verma S, McMurray JJV. SGLT2 inhibitors and mechanisms of cardiovascular benefit: a state-of-the-art review. Diabetologia, 61, 2108–2117 (2018).
- 6) Inzucchi SE, Kosiborod M, Fitchett D, Wanner C, Hehnke U, Kaspers S, George JT, Zinman B. Improvement in cardiovascular outcomes with empagliflozin is independent of glycemic control. Circulation, 138, 1904–1907 (2018).
- 7) Cowie MR, Fisher M. SGLT2 inhibitors: mechanisms of cardiovascular benefit beyond glycaemic control. Nat. Rev. Cardiol., 17, 761–772 (2020).
- 8) Byrne NJ, Parajuli N, Levasseur JL, Boisvenue J, Beker DL, Masson G, Fedak PWM, Verma S, Dyck JRB. Empagliflozin prevents worsening of cardiac function in an experimental model of pressure overload-induced heart failure. JACC. Basic Transl. Sci., 2, 347–354 (2017).
- 9) Lee TM, Chang NC, Lin SZ. Dapagliflozin, a selective SGLT2 Inhibitor, attenuated cardiac fibrosis by regulating the macrophage polarization via STAT3 signaling in infarcted rat hearts. Free Radic. Biol. Med., 104, 298–310 (2017).
- 10) Yurista SR, Sillje HHW, Oberdorf-Maass SU, Schouten EM, Pavez Giani MG, Hillebrands JL, van Goor H, van Veldhuisen DJ, de Boer RA, Westenbrink BD. Sodium-glucose co-transporter 2 inhibition with empagliflozin improves cardiac function in non-diabetic rats with left ventricular dysfunction after myocardial infarction. Eur. J. Heart Fail., 21, 862–873 (2019).
- 11) Takasu T, Takakura S. Effect of ipragliflozin, an SGLT2 inhibitor, on cardiac histopathological changes in a non-diabetic rat model of cardiomyopathy. Life Sci., 230, 19–27 (2019).
- 12) Hattori T, Murase T, Ohtake M, Inoue T, Tsukamoto H, Takatsu M, Kato Y, Hashimoto K, Murohara T, Nagata K. Characterization of a new animal model of metabolic syndrome: the DahlS.Z-Lepr(fa)/Lepr(fa) rat. Nutr. Diabetes, 1, e1 (2011).
- 13) Murase T, Hattori T, Ohtake M, Abe M, Amakusa Y, Takatsu M, Murohara T, Nagata K. Cardiac remodeling and diastolic dysfunction in DahlS.Z-Lepr(fa)/Lepr(fa) rats: a new animal model of metabolic syndrome. Hypertens. Res., 35, 186–193 (2012).
- 14) Kumar S, Vijayan M, Bhatti JS, Reddy PH. MicroRNAs as peripheral biomarkers in aging and age-related diseases. Prog. Mol. Biol. Transl. Sci., 146, 47–94 (2017).
- 15) Zhou SS, Jin JP, Wang JQ, Zhang ZG, Freedman JH, Zheng Y, Cai L. miRNAS in cardiovascular diseases: potential biomarkers, therapeutic targets and challenges. Acta Pharmacol. Sin., 39, 1073–1084 (2018).
- 16) Vishnoi A, Rani S. MiRNA biogenesis and regulation of diseases: an overview. Methods Mol. Biol., 1509, 1–10 (2017).
- 17) O’Brien J, Hayder H, Zayed Y, Peng C. Overview of microRNA biogenesis, mechanisms of actions, and circulation. Front. Endocrinol., 9, 402 (2018).
- 18) Wehbe N, Nasser SA, Pintus G, Badran A, Eid AH, Baydoun E. MicroRNAs in cardiac hypertrophy. Int. J. Mol. Sci., 20, 4714 (2019).
- 19) McGregor RA, Poppitt SD, Cameron-Smith D. Role of microRNAs in the age-related changes in skeletal muscle and diet or exercise interventions to promote healthy aging in humans. Ageing Res. Rev., 17, 25–33 (2014).
- 20) Skála M, Hanouskova B, Skalova L, Matouskova P. MicroRNAs in the diagnosis and prevention of drug-induced cardiotoxicity. Arch. Toxicol., 93, 1–9 (2019).
- 21) Yokono M, Takasu T, Hayashizaki Y, Mitsuoka K, Kihara R, Muramatsu Y, Miyoshi S, Tahara A, Kurosaki E, Li Q, Tomiyama H, Sasamata M, Shibasaki M, Uchiyama Y. SGLT2 selective inhibitor ipragliflozin reduces body fat mass by increasing fatty acid oxidation in high-fat diet-induced obese rats. Eur. J. Pharmacol., 727, 66–74 (2014).
- 22) Tahara A, Kurosaki E, Yokono M, Yamajuku D, Kihara R, Hayashizaki Y, Takasu T, Imamura M, Qun L, Tomiyama H, Kobayashi Y, Noda A, Sasamata M, Shibasaki M. Pharmacological profile of ipragliflozin (ASP1941), a novel selective SGLT2 inhibitor, in vitro and in vivo. Naunyn Schmiedebergs Arch. Pharmacol., 385, 423–436 (2012).
- 23) Iuchi H, Sakamoto M, Matsutani D, Suzuki H, Kayama Y, Takeda N, Minamisawa S, Utsunomiya K. Time-dependent effects of ipragliflozin on behaviour and energy homeostasis in normal and type 2 diabetic rats: continuous glucose telemetry analysis. Sci. Rep., 7, 11906 (2017).
- 24) Lahnwong S, Chattipakorn SC, Chattipakorn N. Potential mechanisms responsible for cardioprotective effects of sodium-glucose co-transporter 2 inhibitors. Cardiovasc. Diabetol., 17, 101 (2018).
- 25) Nakagawa Y, Kuwahara K. Sodium-glucose cotransporter-2 inhibitors are potential therapeutic agents for treatment of non-diabetic heart failure patients. J. Cardiol., 76, 123–131 (2020).
- 26) Gomes CPC, Schroen B, Kuster GM, Robinson EL, Ford K, Squire IB, Heymans S, Martelli F, Emanueli C, Devaux Y. Regulatory RNAs in heart failure. Circulation, 141, 313–328 (2020).
- 27) Salim HM, Fukuda D, Yagi S, Soeki T, Shimabukuro M, Sata M. Glycemic control with ipragliflozin, a novel selective SGLT2 inhibitor, ameliorated endothelial dysfunction in streptozotocin-induced diabetic mouse. Front. Cardiovasc. Med., 3, 43 (2016).
- 28) Lee DM, Battson ML, Jarrell DK, Hou S, Ecton KE, Weir TL, Gentile CL. SGLT2 inhibition via dapagliflozin improves generalized vascular dysfunction and alters the gut microbiota in type 2 diabetic mice. Cardiovasc. Diabetol., 17, 62 (2018).
- 29) Oelze M, Kroller-Schon S, Welschof P, Jansen T, Hausding M, Mikhed Y, Stamm P, Mader M, Zinssius E, Agdauletova S, Gottschlich A, Steven S, Schulz E, Bottari SP, Mayoux E, Munzel T, Daiber A. The sodium-glucose co-transporter 2 inhibitor empagliflozin improves diabetes-induced vascular dysfunction in the streptozotocin diabetes rat model by interfering with oxidative stress and glucotoxicity. PLOS ONE, 9, e112394 (2014).
- 30) Kroetsch JT, Bolz SS. The TNF-α/sphingosine-1-phosphate signaling axis drives myogenic responsiveness in heart failure. J. Vasc. Res., 50, 177–185 (2013).
- 31) Barbaro NR, Fontana V, Modolo R, De Faria AP, Sabbatini AR, Fonseca FH, Anhê GF, Moreno H. Increased arterial stiffness in resistant hypertension is associated with inflammatory biomarkers. Blood Press., 24, 7–13 (2015).
- 32) Furman D, Campisi J, Verdin E, Carrera-Bastos P, Targ S, Franceschi C, Ferrucci L, Gilroy DW, Fasano A, Miller GW, Miller AH, Mantovani A, Weyand CM, Barzilai N, Goronzy JJ, Rando TA, Effros RB, Lucia A, Kleinstreuer N, Slavich GM. Chronic inflammation in the etiology of disease across the life span. Nat. Med., 25, 1822–1832 (2019).
- 33) Liu M, Chen J, Huang D, Ke J, Wu W. A meta-analysis of proinflammatory cytokines in chronic heart failure. Heart Asia, 6, 130–136 (2014).
- 34) Bonnet F, Scheen AJ. Effects of SGLT2 inhibitors on systemic and tissue low-grade inflammation: the potential contribution to diabetes complications and cardiovascular disease. Diabetes Metab., 44, 457–464 (2018).
- 35) Chistiakov DA, Killingsworth MC, Myasoedova VA, Orekhov AN, Bobryshev YV. CD68/macrosialin: not just a histochemical marker. Lab. Invest., 97, 4–13 (2017).
- 36) Ouyang C, You J, Xie Z. The interplay between autophagy and apoptosis in the diabetic heart. J. Mol. Cell. Cardiol., 71, 71–80 (2014).
- 37) Hasenfuss G. Animal models of human cardiovascular disease, heart failure and hypertrophy. Cardiovasc. Res., 39, 60–76 (1998).
- 38) Kastner N, Zlabinger K, Spannbauer A, Traxler D, Mester-Tonczar J, Hašimbegović E, Gyöngyösi M. New insights and current approaches in cardiac hypertrophy cell culture, tissue engineering models, and novel pathways involving non-coding RNA. Front. Pharmacol., 11, 1314 (2020).
- 39) Maries L, Marian C, Sosdean R, Goanta F, Sirbu IO, Anghel A. MicroRNAs-the heart of post-myocardial infarction remodeling. Diagnostics (Basel), 11, 1675 (2021).
- 40) Wang J, Zhang J, Ding X, Wang Y, Li Z, Zhao W, Jia J, Zhou J, Ge J. Differential microRNA expression profiles and bioinformatics analysis between young and aging spontaneously hypertensive rats. Int. J. Mol. Med., 41, 1584–1594 (2018).
- 41) Hupfeld J, Ernst M, Knyrim M, Binas S, Kloeckner U, Rabe S, Quarch K, Misiak D, Fuszard M, Grossmann C, Gekle M, Schreier B. miR-208b Reduces the expression of Kcnj5 in a cardiomyocyte cell line. Biomedicines, 9, 719 (2021).
- 42) Corsten MF, Dennert R, Jochems S, Kuznetsova T, Devaux Y, Hofstra L, Wagner DR, Staessen JA, Heymans S, Schroen B. Circulating microRNA-208b and microRNA-499 reflect myocardial damage in cardiovascular disease. Circ. Cardiovasc. Genet., 3, 499–506 (2010).
- 43) Shyu KG, Wang BW, Cheng WP, Lo HM. MicroRNA-208a increases myocardial endoglin expression and myocardial fibrosis in acute myocardial infarction. Can. J. Cardiol., 31, 679–690 (2015).
- 44) Ucar A, Gupta SK, Fiedler J, et al. The miRNA-212/132 family regulates both cardiac hypertrophy and cardiomyocyte autophagy. Nat. Commun., 3, 1078 (2012).
- 45) Hinkel R, Batkai S, Bähr A, et al. AntimiR-132 attenuates myocardial hypertrophy in an animal model of percutaneous aortic constriction. J. Am. Coll. Cardiol., 77, 2923–2935 (2021).
- 46) Täubel J, Hauke W, Rump S, Viereck J, Batkai S, Poetzsch J, Rode L, Weigt H, Genschel C, Lorch U, Theek C, Levin AA, Bauersachs J, Solomon SD, Thum T. Novel antisense therapy targeting microRNA-132 in patients with heart failure: results of a first-in-human Phase 1b randomized, double-blind, placebo-controlled study. Eur. Heart J., 42, 178–188 (2021).
- 47) Shrivastava A, Haase T, Zeller T, Schulte C. Biomarkers for heart failure prognosis: proteins, genetic scores and non-coding RNAs. Front. Cardiovasc. Med., 7, 601364 (2020).
- 48) Liu X, Meng H, Jiang C, Yang S, Cui F, Yang P. Differential microRNA expression and regulation in the rat model of post-infarction heart failure. PLOS ONE, 11, e0160920 (2016).
- 49) Schmitz B, Brand SM. Commentary: microRNA-221/222 family counteracts myocardial fibrosis in pressure overload-induced heart failure. Front. Cardiovasc. Med., 5, 95 (2018).
- 50) Ge Y, Pan S, Guan D, Yin H, Fan Y, Liu J, Zhang S, Zhang H, Feng L, Wang Y, Xu R, Yin JQ. MicroRNA-350 induces pathological heart hypertrophy by repressing both p38 and JNK pathways. Biochim. Biophys. Acta BBAMol. Basis Dis., 1832, 1–10 (2013).
- 51) Wang K, Long B, Zhou J, Li PF. miR-9 and NFATc3 regulate myocardin in cardiac hypertrophy. J. Biol. Chem., 285, 11903–11912 (2010).
- 52) Siddika T, Heinemann IU. Bringing microRNAs to light: methods for microRNA quantification and visualization in live cells. Front. Bioeng. Biotechnol., 8, 619583 (2021).