Abstract
In therapeutic drug monitoring of vancomycin (VCM), the area under the concentration–time curve (AUC) is related to clinical efficacy and toxicity. Determining the maintenance for patient is necessary since VCM concentrations are affected by factors such as renal function. We constructed a machine learning-based model to estimate the maintenance dose to target an AUC of 400–600 mg⋅h/L in each combination of patient’s factors. This retrospective observational study was conducted at two hospitals. Patients who received VCM intravenously with measured trough and another point (e.g., peak) concentrations within the November 2011 to March 2019 period were enrolled. We extracted the factors that affect VCM concentration and constructed a decision tree model using a classification and regression tree algorithm. Of the 1380 patients, 822 were included. Training data were split up to four times and included 24 subgroups. The average corrected VCM daily doses ranged 17.6–59.4 mg/kg. Estimated glomerular filtration rate, age, and body mass index were selected as predictive variables that affected the recommended daily dose. In the validation data, our model had slightly higher proportions of AUC of 400–600 mg⋅h/L than other nomograms. However, our model was based only on limited patients. Thus, further clinical studies are needed to develop a general-purpose model in the future. We successfully constructed a model that recommends VCM maintenance daily doses with AUC of 400–600 mg⋅h/L for each combination of independent variables. Our model has the potential for application as a simple decision-making tool for medical staff.
INTRODUCTION
Vancomycin (VCM) is a glycopeptide antibiotic that is administered against Gram-positive bacterial infections, such as methicillin-resistant Staphylococcus aureus. The concentration of VCM is related to its clinical efficacy, toxicity, and appearance of resistant bacteria. Hence, therapeutic drug monitoring (TDM) is important for increasing the efficacy and decreasing side effects associated with VCM therapy.1) The primary pharmacokinetics/pharmacodynamics parameter of VCM is the ratio of the area under the concentration–time curve/minimum inhibitory concentration (AUC/MIC). Although clinical guidelines have recommended using a trough concentration instead of AUC/MIC,1,2) trough concentrations in the range 15–20 mg/L, even though, show efficacy against serious infections, have been reported to increase the risk of VCM-induced nephrotoxicity.3) Recently, several studies reported that targeting the AUC was more effective for successful treatment and suppression of side effects.4,5) Thus, the new guidelines of the Infectious Diseases Society of America is recommended for AUC-guided TDM.6) The guideline targets infections with MIC ≤ 1 mg/L. However, the MIC may not be noted during the initial VCM administration. An AUC of 400–600 mg⋅h/L may be used as a clinical target.6) AUC-guided TDM by Bayesian prediction was reported to reduce the incidence of nephrotoxicity as compared to trough-guided TDM in a Japanese study.7) Thus, AUC-guided TDM is assumed to be more important in clinical practice.8) In addition, it may be important to design a simple dosing regimen that considers a combination of factors that affect AUC (age, obesity, serum albumin, creatinine clearance (Ccr), underlying diseases, and concomitant drugs).9–12)
In our previous study, we constructed an algorithm optimized for dose setting of targeted VCM trough concentration of 10–20 mg/L using decision tree (DT) analysis.13) DT analysis is a machine learning method used to construct classification and regression models. In the medical field, DT analysis is used to predict disease onset and identify the causes of disease,14,15) because it produces a flowchart-like model that makes it easy to obtain the relationship between independent variables.16) Our algorithm included some factors to predict VCM daily dose (i.e., age, body mass index (BMI), and estimated glomerular filtration rate (eGFR)). The algorithm was constructed for use in patients with eGFR >50 mL/min and body weight >40 kg. The recommended daily doses ranged from 20.0 to 58.1 mg/kg. The proportion of recommended trough concentration was higher than that obtained using the software of the Japanese PPK parameter (vancomycin MEEK TDM analysis software ver. 2.0 and SHIONOGI-VCM-TDM ver. 2009), which had been previously used for dose setting.17,18) However, our algorithm was based on trough-guided TDM, and it did not correspond for use under AUC-guided TDM. Thus, it is necessary to construct a new model of AUC-guided TDM, as recommended by the guidelines.6) In the initial dose setting until implementation of TDM, the maintenance and loading doses for each patient have to be determined. Considering that the loading dose is almost administered only once at treatment initiation, it is important to set an optimized VCM maintenance dose to attain an AUC of 400–600 mg⋅h/L. Additionally, the establishment of a maintenance dose might be helpful as a reference for some facilities where measurement of VCM concentrations are outsourced, and early implementation of TDM have been difficulty under recommended conditions according to the guidelines.6,8)
In this study, by using DT analysis, we aimed to construct a model for estimating the VCM maintenance dose to target an AUC of 400–600 mg⋅h/L. Moreover, new guidelines recommend the AUC should be calculated by 2 points of VCM concentration. We conducted research in two facilities to collect applicable patient data.8)
MATERIALS AND METHODS
Study DesignThis retrospective observational study was conducted at Hokkaido University Hospital (944 beds) and Sunagawa City Medical Center (498 beds). Some cases of Hokkaido University Hospital from our previous study were also included.13)
SubjectsPatients who were administered VCM intravenously and both trough concentration and another point (e.g., peak) concentration measured were enrolled from November 2011 to March 2019. The period was set considering the introduction of the electronic TDM system for VCM in the Hokkaido University Hospital. Exclusion criteria were as follows: (i) age < 18 years; (ii) TDM implementation within 3 d of VCM administration; (iii) acute kidney injury (AKI) between the initial administration of VCM and the implementation of TDM. AKI was defined as the increase in serum creatinine (Scr) of “50% within 7 d” or “0.3 mg/dL within 48 h at the initiation of VCM administration19); (iv) patients with missing data; (v) eGFR (at initial VCM administration) < 30 mL/min/1.73 m2; and (vi) patients who underwent hemodialysis, renal replacement therapy, and plasma exchange. Exclusion of eGFR < 30 mL/min/1.73 m2 was based on the Japanese Society of Chemotherapy guidelines that does not recommend VCM administration.2)
Data CollectionAll data were collected from the patients’ electronic records from each hospital. Data were collected on the following: age, sex, body height, body weight, Scr, serum albumin, blood urea nitrogen, whether the patient was treated in an intensive care unit, underlying disease (heart failure, hypertension, cerebrovascular disease, hepatological cancer, hepatic tumor, diabetes, sepsis, febrile neutropenia), concomitant drugs (non-steroidal anti-inflammatory drugs, vasopressor drugs, furosemide, other diuretics, angiotensin II receptor blocker, angiotensin converting enzyme inhibitor, tazobactam/piperacillin, amphotericin B, and aminoglycoside antibiotics). Vasopressor drugs included etilefrine, noradrenaline, olprinone, milrinone, dopamine, and dobutamine. BMI was calculated based on body height and body weight. Based on the criteria of the Japanese Society for the Study of Obesity, we defined BMI ≥ 25 kg/m2 as obesity and BMI < 18.5 kg/m2 as underweight.20,21) Information on initial VCM dosage, VCM concentrations (trough concentration and another point concentration), administration interval, measurement time of another point concentration, and implementation TDM day were collected from the record of TDM implementation. eGFR was calculated using the Japanese formula22):
The pharmacokinetic parameters of VCM (VCM clearance, volume of distribution, and elimination half-life), and Ccr (calculated using the Cockcroft–Gault equation)23) were calculated using Bayesian software [Practical AUC guided TDM for vancomycin (PAT) ver.1.2].24) PAT is a free web software constructed by the Japanese Society of Chemotherapy. The AUC calculated by PAT was based on the population pharmacokinetics parameters reported by Yasuhara et al.17) To calculate the AUC, we collected the data on the trough and another point concentrations of VCM. Generally, the peak concentration, which was measured 1 or 2 h after VCM administration, was used to calculate the AUC.6) However, PAT is determined using Bayesian methods and AUC can be presumed based on trough and another point concentrations.24) Thus, patients in whom VCM concentration was measured at other time points after administration were also included in this study.
The corrected daily dose for AUC of 500 mg⋅h/L was calculated using the following formula:
Data SettingWe randomly divided the corrected patient data into training and validation data using SPSS ver.25 (IBM, Tokyo, Japan). The Mann–Whitney U test was used to analyze continuous variables. Pearson’s chi-square test or Fisher’s exact probability test was used to analyze the nominal variables.
Model ConstructionFor the training group, the model was constructed using “classification and regression tree (CART) algorithm” which is one of DT analysis method.16) CART algorithm can use continuous variables as dependent variables and the Gini coefficient is used as a criterion for splitting the two groups. The data were branched based on the independent variable with the largest difference in the Gini index between the parent and child nodes. The model was built in a setting where the data could be branched up to five times.
In DT analysis, the corrected VCM daily dose with target AUC of 500 mg⋅h/L was used as the dependent variable and the patient characteristics [i.e., age (continuous variable), eGFR (continuous variable), BMI < 18.5 kg/m2, BMI ≥ 25 kg/m2, underlying diseases, concomitant drugs] were used as the independent variable. Based on the 2016 TDM Guidelines in Japan, eGFR was used instead of the Ccr.2)
Model EvaluationThe accuracy of this model was evaluated using training data and validation data. We evaluated the proportions of AUC < 400 mg⋅h/L, AUC of 400–600 mg⋅h/L, and AUC >600 mg⋅h/L using the following formula:
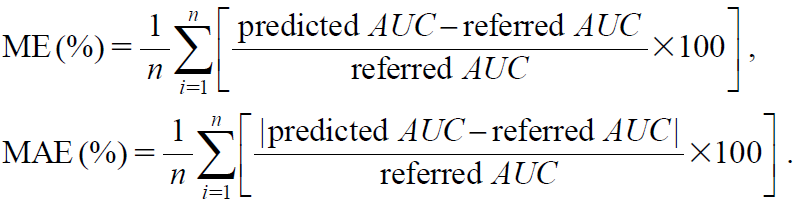
The recommended daily dosage was calculated using the dosage of each subgroup and actual body weight (Table 1). To compare the proportions of the AUC, we used two nomograms from Thomson et al.25) and Oda et al.26) Additionally, we evaluated the error range between referred AUC 500 mg·h/L and predictive AUC of each nomogram using the mean prediction error (ME) and mean absolute prediction error (MAE) as follows27):
To assess the extent to which the extracted factors affected the model, another model with different combinations of factors was constructed and compared for validity.
Table 1. Calculation of Defined VCM Daily Dose
| Recommended VCM dose (mg/d) | Defined VCM dose (mg/d) | Example of dose setting |
|---|
| < 625 | 500 | 500 mg once daily |
| 625–875 | 750 | 750 mg once daily |
| 875–1125 | 1000 | 1000 mg once daily |
| 1125–1375 | 1250 | 1250 mg once daily |
| 1375–1750 | 1500 | 750 mg twice daily |
| 1750–2250 | 2000 | 1000 mg twice daily |
| 2250–2750 | 2500 | 1250 mg twice daily |
| 2750–3250 | 3000 | 1500 mg twice daily |
| > 3250 | 3500 | 1750 mg twice daily |
Statistical analyses and model construction were performed using SPSS ver.25 (IBM, Tokyo, Japan). Results with p ≤ 0.05 were considered statistically significant.
EthicsThis study was conducted in accordance with the guidelines for the care of human studies. Each ethics committee of the Hokkaido University Hospital and Sunagawa City Medical Center approved the study protocol (No. 020-0348 and No. 2020-22). Consent from patients was obtained using the opt-out approach.
RESULTS
Patient CharacteristicsOf the 1380 patients whose trough and another point concentrations of VCM concentration were available, 822 were included in this study (Fig. 1). Additionally, the VCM concentrations were measured in 787 out of 822 patients (95.7%) from 1 to 2 h after administration (Table 2); this was considered as the peak concentration. In the comparison of patients’ characteristics between training data (n = 661) and validation data (n = 161), only one variable (in the cases measured 2 h after administration) showed a significant difference (Tables 2, 3).
Table 2. Measured Timing after VCM Administration
| Measured timing after administration, n (%) | Training data (n = 661) | Validation data (n = 161) | p-Value |
|---|
| 0.0 h | 4 (0.61) | 2 (1.24) | 0.334b) |
| 0.25 h | 1 (0.15) | 0 (0) | 1.000b) |
| 0.5 h | 18 (2.72) | 3 (1.86) | 0.781b) |
| 1.0 h | 538 (81.4) | 123 (76.4) | 0.152a) |
| 1.5 h | 6 (0.91) | 1 (0.62) | 1.000b) |
| 2.0 h | 87 (13.2) | 31 (19.3) | 0.048a)* |
| 2.5 h | 2 (0.30) | 0 (0) | 1.000b) |
| 3.0 h | 2 (0.30) | 0 (0) | 1.000b) |
| 3.5 h | 1 (0.15) | 1 (0.62) | 0.354b) |
| 4.0 h | 1 (0.15) | 0 (0) | 1.000b) |
| 6.0 h | 1 (0.15) | 0 (0) | 1.000b) |
VCM: vancomycin. a) Pearson’s chi-squared test; b) Fishers exact test. * p ≤ 0.05 was considered statistically significant.
Table 3. Patient Characteristics
| Patient characteristics | Training data (n = 661) | Validation data (n = 161) | p-Value |
|---|
| Age (years), median (range) | 66.8 (19–93) | 66.2 (20–95) | 0.482a) |
| Male, n (%) | 428 (64.8) | 109 (67.7) | 0.278b) |
| Body height (cm), median (range) | 162.0 (120.0–187.0) | 161.8 (138.5–184.4) | 0.860a) |
| Body weight (kg), median (range) | 56.2 (27.1–107.0) | 56.6 (29.1–87.5) | 0.807a) |
| BMI (kg/m2), median (range) | 21.6 (11.0–40.6) | 21.0 (12.2–35.1) | 0.379a) |
| ≥ 25 kg/m2, n (%) | 112 (16.9) | 36 (22.4) | 0.109b) |
| < 18.5 kg/m2, n (%) | 123 (18.6) | 40 (24.8) | 0.075b) |
| S–Alb (g/dL), median (range) | 2.80 (0.6–5.6) | 2.8 (1.4–4.7) | 0.411a) |
| BUN (mg/dL), median (range) | 16.0 (2.0–83.0) | 16.0 (4.0–85.0) | 0.942a) |
| Scr (mg/dL), median (range) | 0.67 (0.18–1.79) | 0.65 (0.18–1.71) | 0.438a) |
| Ccr (mL/min), median (range) | 83.5 (22.4–506.3) | 84.7 (27.6–348.1) | 0.860a) |
| eGFR (mL/min/1.73 m2), median (range) | 83.8 (31.2–358.0) | 87.2 (31.6–368.9) | 0.482a) |
| Initial VCM dose (mg/d), median (range) | 2000 (500–3000) | 2000 (500–3750) | 0.565a) |
| Administration interval (h), median (range) | 12 (6–36) | 12 (7–48) | 0.138a) |
| Implementation TDM day (days), Median (range) | 3 (3–10) | 4 (3–7) | 0.735a) |
| TDM |
| Trough concentration (µg/mL), median (range) | 10.6 (2.2–34.5) | 10.1 (1.9–39.4) | 0.647a) |
| One another point concentration (µg/mL), median (range) | 26.0 (7.2–68.4) | 25.6 (6.6–61.6) | 0.480a) |
| Pharmacokinetics parameters |
| CLVCM (L/h), median (range) | 3.8 (1.1–12.2) | 4.0 (1.1–10.1) | 0.725a) |
| Vd (L), median (range) | 62.1 (36.5–76.3) | 61.7 (50.8–73.5) | 0.181a) |
| Vd per body weight (L/kg), median (range) | 1.1 (0.7–1.3) | 1.1(0.8–1.7) | 0.990a) |
| t1/2 (h), median (range) | 13.8 (5.9–39.3) | 13.6 (6.9–37.1) | 0.751a) |
| AUC (mg⋅h/L), median (range) | 427.5 (152.3–1061.1) | 416.3 (132.1–1203.1) | 0.379a) |
| ICU, n (%) | 84 (12.7) | 14 (8.7) | 0.146b) |
| Underlying disease |
| Hypertension, n (%) | 157 (23.8) | 30 (18.6) | 0.165b) |
| Heart failure, n (%) | 29 (4.4) | 9 (5.6) | 0.515b) |
| Cerebrovascular disease, n (%) | 71 (10.7) | 18 (11.2) | 0.872b) |
| Hematological cancer, n (%) | 53 (8.0) | 16 (9.9) | 0.431b) |
| Hepatic tumor, n (%) | 83 (12.6) | 16 (9.9) | 0.360b) |
| Sepsis, n (%) | 38 (5.7) | 11 (6.8) | 0.603b |
| FN, n (%) | 12 (1.8) | 3 (1.9) | 1.000c) |
| Diabetes, n (%) | 116 (17.5) | 20 (12.4) | 0.116b) |
| Concomitant drug |
| Furosemide, n (%) | 130 (19.7) | 39 (24.2) | 0.200b) |
| Other diuretics, n (%) | 106 (16.0) | 23 (14.3) | 0.584b) |
| Vasopressor drugs, n (%) | 58 (8.8) | 11 (6.8) | 0.425b) |
| ARB, n (%) | 82 (12.4) | 18 (11.2) | 0.670b) |
| ACEi, n (%) | 33 (5.0) | 8 (5.0) | 0.990b) |
| NSAIDs, n (%) | 262 (39.6) | 71 (44.1) | 0.301b) |
| TAZ/PIPC, n (%) | 88 (13.3) | 27 (16.8) | 0.257b) |
| Aminoglycoside, n (%) | 12 (1.8) | 2 (1.2) | 1.000c) |
| AMPH–B, n (%) | 4 (0.6) | 1 (0.6) | 1.000c) |
TDM: therapeutic drug monitoring, BMI: body mass index, S-Alb: serum albumin, BUN: blood urea nitrogen, Scr: serum creatinine, Ccr: creatinine clearance, eGFR: estimated glomerular filtration rate, VCM: vancomycin, CLVCM: clearance of vancomycin, Vd: volume of distribution, t1/2: elimination half-life, AUC: area under the concentration curve, ICU: intensive care unit, FN: febrile neutropenia, ARB: angiotensin II receptor blocker, ACEi: angiotensin converting enzyme inhibitor, NSAIDs: non-steroidal anti-inflammatory drugs, TAZ/PIPC: piperacillin-tazobactam, AMPH–B: amphotericin B. a) Mann–Whitney U test; b) Pearson’s chi-square test; c) Fischer’s exact test. * p ≤ 0.05 was considered statistically significant.
Using the training data, the DT model was constructed using the CART algorithm (Fig. 2). eGFR, age, and BMI ≥25 kg/m2 were selected as the predictive variables. In this model, training data were split up to four times and included 24 subgroups, and the average corrected VCM daily doses ranged from 17.6 to 59.4 mg/kg. Based on the terminal subgroups of the DT model, we constructed a nomogram of recommended VCM daily dose (Table 4). In training data, ME and MAE were 1.05 and 4.60%, respectively (Supplementary Table 1).
Table 4. Nomogram of Recommended VCM Maintenance Dose Based on DT Model
| Predictive variable | Recommended VCM daily dose (mg/kg) |
|---|
| eGFR (mL/min/1.73 m2) | Age (years) | BMI ≥25 (kg/m2) |
|---|
| > 166.3 | Unconditional | Unconditional | 59.4 |
| 119.0–163.3 | Unconditional | Unconditional | 48.6 |
| 90.3–119.0 | ≤ 41 | Unconditional | 49.6 |
| 90.3–119.0 | 42–66 | No | 43.3 |
| 90.3–119.0 | ≥ 67 | No | 39.0 |
| 90.3–119.0 | ≥ 42 | Yes | 33.8 |
| 75.8–90.3 | ≤ 66 | Unconditional | 37.7 |
| 75.8–90.3 | 67–76 | Unconditional | 34.7 |
| 75.8–90.3 | ≥ 77 | Unconditional | 27.8 |
| 49.8–75.8 | Unconditional | Unconditional | 27.5 |
| < 49.8 | ≤ 56 | Unconditional | 24.7 |
| 46.4–49.8 | ≥ 57 | Unconditional | 22.4 |
| ≤ 46.4 | ≥ 57 | Unconditional | 17.6 |
DT: decision tree, eGFR: estimated glomerular filtration rate, BMI: body mass index, VCM: vancomycin. The nomogram is assumed to be used in patients with eGFR ≥30 mL/min/1.73 m2. The daily dose should not exceed 3500 mg/d (Table 1).
Using the validation data, the proportion of AUC of 400–600 mg⋅h/L was 54.7% (88 out of 161 patients). Compared with other nomograms, the proportion of AUC of 400–600 mg⋅h/L was nearly 50% (Table 5). Additionally, the proportions of AUC < 400 mg⋅h/L and AUC > 600 mg⋅h/L were 18.0% (29 out of 161 patients) and 27.3% (44 out of 161 patients), respectively. To determine the nomogram accuracy, we calculated ME and MAE based on the differences in referred AUC 500 mg·h/L and predicted AUC of each nomogram. Our DT model showed that ME was 10.0% with an MAE of 26.7% (Table 5). To validate whether the predictive factors of our DT model interinfluenced or not, we constructed other models by DT analysis, and compared their validity. Constructed models were as follows: Model A was constructed with the eGFR and BMI ≥ 25 as the independent factors, Model B was constructed using eGFR and age as the independent factors, and Model C was constructed by eGFR as the independent factor (Supplementary Figs. 1–3). Model A included 14 terminal subgroups, where the proportion of the AUC 400–600 mg⋅h/L was 54.0% (87 of 161 patients). ME and MAE were 9.26% and 26.4%, respectively. Model B included 14 terminal subgroups and the proportion of the AUC 400–600 mg⋅h/L was 52.8% (85 of 161 patients). ME and MAE were 9.55 and 27.7%, respectively. Model C included 18 terminal subgroups and the proportion of the AUC 400–600 mg⋅h/L was 54.0% (87 of 161 patients). ME and MAE were 9.84 and 27.3%, respectively (Supplementary Table 2).
Table 5. Model Evaluation Using Validation Data (
n = 161)
| Predicted AUC (mg⋅h/L) | DT model | Nomogram Oda et al.26) | Nomogram Thomson et al.25) |
|---|
| < 400, n (%) | 29 (18.0) | 50 (31.1) | 32 (19.9) |
| 400–600, n (%) | 88 (54.7) | 79 (49.1) | 83 (51.6) |
| > 600, n (%) | 44 (27.3) | 32 (19.9) | 46 (28.6) |
| Evaluated function | DT model | Nomogram Oda et al.26) | Nomogram Thomson et al.25) |
|---|
| ME ± S.D., (%) | 10.0 ± 37.0 | −0.77 ± 36.3 | 8.67 ± 39.5 |
| MAE ± S.D., (%) | 26.7 ± 27.5 | 26.6 ± 24.6 | 26.5 ± 30.4 |
AUC: area under the concentration curve, DT: decision tree, ME: mean prediction error, MAE: mean absolute prediction error, S.D.: standard deviation.
DISCUSSION
Based on the recent guideline of VCM therapy, AUC can be used to evaluate efficacy and safety.6) The optimal maintenance dose for each patient must also be considered in terms of the initial dose setting; however, the consensus of dose setting for referred AUC remains lacking. Pharmacokinetics of VCM is affected by patients’ age, renal function, ethnic background, and underlying diseases, hence it is complex; therefore, it is important to construct dose setting models (included nomogram) for each patient factor.
As a method, DT analysis has the potential to construct VCM dose setting model from patients record; for example, we have previously constructed a dose setting model for trough guided TDM.13) Additionally, Yamaguchi et al. constructed a simple flowchart to set VCM dose to mitigate nephrotoxicity28) using DT analysis, as in our model, which can aid in better clinical decisions by minimalizing factors influencing VCM dose selection. In this study, we constructed dose setting model targeting AUC using DT analysis, which was included patients with eGFR < 50 mL/min/1.73 m2 that was excluded in our previous study.13) “eGFR, age, and BMI ≥ 25 kg/m2” were selected as predictive variables that affected dose setting, which have been reported to affect VCM trough concentration or AUC. A lower recommended daily dose per body weight is associated with lower eGFR, older age, and BMI ≥ 25 kg/m2. Compared to the reported nomograms,25,26) errors in the predicted AUC were comparable, while the accuracy of the model was reasonable.
For the dependent variable of DT analysis, we used the corrected dose required to achieve an AUC of 500 mg⋅h/L based on the AUC calculated by PAT. In our model, the lower recommended dose in the subgroup corresponding to a lower eGFR was consistent with the dose recommended in our previous study.13) The lowest recommended daily dose of VCM was 17.6 mg/kg in the subgroup of patients aged ≥ 57 years and eGFR 30.0–46.4 mL/min/1.73 m2. In other nomograms with similar eGFR, 15 mg/kg/d was recommended.26) Patients with chronic kidney disease (CKD) have been reported to have increased nephrotoxicity. As VCM is a renally excreted drug, decreasing renal function is accompanied by increased VCM concentrations and AUC. Thus, attention should be paid to the dose setting when CKD patients are administered VCM. Using DT analysis, we constructed a model that showed the recommended dose based on the renal function. This might be useful for designing more appropriate VCM dosage methods.
In this model, the recommended daily doses differed by age within patients with the same eGFR. Patient age has been reported to affect the pharmacokinetics of VCM. Owing to a decrease in muscle mass and an increase in fat percentage with aging, the total body water content decreases.29) VCM is a hydrophilic agent, the blood concentrations of which may increase with a decrease in the total body water content. Thus, it is possible that the recommended daily doses differ with the age of patients, although they exhibit a similar renal function.
Obesity affects the distribution of VCM and decreases its serum concentration when fixed dose of VCM is administered, as compared to normal patients. However, with patients obesity should be cautioned about the risk of overdose when increase in VCM concentrations is anticipated.30) In particular, VCM dose greater than 4000 mg has been reported to increase the risk of nephrotoxicity.6,30–32) Previous studies defined patients with BMI > 30 kg/m2 as obese.30–32) In contrast, the percentage of body fat or the risk of underlying disease in the Asian population was reported to differ from that of the Caucasian population with the same BMI.21) In Japan, BMI ≥ 25 kg/m2 was defined as obesity in the criteria of the Japanese Society for the Study of Obesity.20) In fact, few patients with BMI > 30 kg/m2 were included (24 out of 882 patients). To validate whether BMI ≥ 25 kg/m2 affected maintenance dose, we used BMI ≥ 25 kg/m2 as the factor for constructing the model. In our model, BMI ≥ 25 kg/m2 was included as a predictive variable in the subgroup of patients with eGFR 90.3–119.0 mL/min/1.73 m2 and age ≥ 42 years. Hashimoto et al. reported that obese patients (BMI ≥25) required lower doses of VCM to target trough concentrations of 15–20 mg/L than standard patients.33) Additionally, another machine learning model for initial dose planning included the BMI as a factor,34) which our results may support. However, BMI ≥ 25 kg/m2 as a predictive variable did not show other ranges of eGFR. Pan et al. reported that VCM concentration is related to both BMI and Ccr. It is necessary to verify whether the recommended daily doses are affected by obesity in patients with lower or higher eGFR.35)
The recommended daily doses of eGFR >166.3 mL/min/1.73 m2 and eGFR 119.0–166.3 mL/min/1.73 m2 were shown to be 59.4 and 48.6 mg/kg/d, respectively. The IDSA guidelines recommended 15–20 mg/kg every 8–12 h for most patients with normal renal function6); our results were close to the recommended concentrations. In contrast, patients with high eGFR may have augmented renal clearance (ARC). ARC has been observed in patients with sepsis, trauma, and burns. The risk of VCM treatment failure is increased by ARC, as the general dosage is insufficient to achieve adequate blood concentrations for increased renal clearance.36) Our data did not discriminate between ARC and non-ARC, and the recommended daily doses may be different.
In the validation data, our model tended to have slightly higher proportions of targeting AUC than the other nomograms. This might be because our model included a combination of factors. As the AUC was calculated based on the VCM concentration at two points (trough and another point), which had been presumed to be in the steady state, it could replace the recommended daily dose of our model as the maintenance dose. Additionally, we compared the DT model with other models with different independent factors to evaluate whether extracted factors were interinfluenced or not. Model A was constructed without BMI ≥25. It seemed show clinical validity in the combination of the factors and referred daily doses. However, with the proportion of the AUC 400–600 mg⋅h/L, ME and MAE did not show superiority. Model B was constructed without age, and Model C was constructed without age and BMI ≥ 25. In both models, some subgroups showed a lower recommended daily dose for high-eGFR patients. Those results were difficult to explain with clinical validity. Based on these results and previous studies, it might be valid that three predictive factors (eGFR, age and BMI ≥ 25) were selected in our DT model. However, this should be evaluated in further studies.
Our study has several limitations. First, the number of included variable factors was limited in our model, although more variable factors of AUC have been reported. For example, in a recent study, furosemide was reported to affect the trough concentration in a multivariate analysis.37) Age, eGFR, and BMI ≥ 25 kg/m2 were extracted as predictive variables of our model, and these factors may have been affected by other variables such as disease history and concomitant drugs. Using all factors of patient in DT analysis, may result in unknown combinations; however, it is difficult to determine whether those combinations correspond to clinical background; hence, for better clinical interpretation, we used factors shown to change VCM concentration in previous studies.9–12) Second, our model was assumed to show the initial VCM dose targeting an AUC of 400–600 mg⋅h/L. The recommended timing of new guidelines was 24–48 h after the initial VCM administration.6) In addition, the loading dose is considered to target an AUC of 400–600 mg⋅h/L in early treatment. We collected data from a few patients on the implementation of TDM early and administration of VCM loading dose. Thus, it was difficult to obtain the recommended VCM dose to the target AUC24-48. Third, the data used to construct our model were collected from two hospitals based only on Japanese patients. Since renal functions are different among ethnic groups,38) fitting our model only to a limited number of patients was a disadvantage. Fourth, our model showed that nearly 50% of the validation data were AUC < 400 mg⋅h/L or AUC > 600 mg⋅h/L. Data mining, which includes DT analysis, depends on the characteristics of the collected data and the possibility of over- or underfitting.16) Hence, we evaluated the model by comparing it with other nomograms.
Despite these limitations, we constructed a model that predicted maintenance daily doses targeting AUC of 400–600 mg⋅h/L using DT analysis. The model showed a combination of independent factors for each recommended daily dose. Our results might be help constructing clinical models for dose setting of initial VCM administration. It has the potential of serving as a simple decision-making tool for medical staff. A clinical study in more facilities is needed to develop a general-purpose model in the future.
Conflict of Interest
The authors declare no conflict of interest.
Supplementary Materials
This article contains supplementary materials.
REFERENCES
- 1) Rybak M, Lomaestro B, Rotschafer JC, Moellering R Jr, Craig W, Billeter M, Dalovisio JR, Levine DP. Therapeutic monitoring of vancomycin in adult patients: a consensus review of the American Society of Health-System Pharmacists, the Infectious Diseases Society of America, and the Society of Infectious Diseases Pharmacists. Am. J. Health Syst. Pharm., 66, 82–98 (2009).
- 2) Japanese Society of Chemotherapy. The Japanese Society of Therapeutic Drug Monitoring. Koukinyaku TDM guideline kaiteiban. Tokyo: Japanese Society of Chemotherapy, Japan, pp. 39–62 (2016).
- 3) Neely MN, Kato L, Youn G, Kraler L, Bayard D, van Guilder M, Schumitzky A, Yamada W, Jones B, Minejima E. Prospective trial on the use of trough concentration versus area under the curve to determine therapeutic vancomycin dosing. Antimicrob. Agents Chemother., 62, e02042-17 (2018).
- 4) Meng L, Wong T, Huang S, Mui E, Nguyen V, Espinosa G, Desai J, Holubar M, Deresinski S. Conversion from vancomycin trough concentration-guided dosing to area under the curve-guided dosing using two sample measurements in adults: implementation at an Academic Medical Center. Pharmacotherapy, 39, 433–442 (2019).
- 5) Tsutsuura M, Moriyama H, Kojima N, Mizukami Y, Tashiro S, Osa S, Enoki Y, Taguchi K, Oda K, Fujii S, Takahashi Y, Hamada Y, Kimura T, Takesue Y, Matsumoto K. The monitoring of vancomycin: a systematic review and meta-analyses of area under the concentration-time curve-guided dosing and trough-guided dosing. BMC Infect. Dis., 21, 153 (2021).
- 6) Rybak MJ, Le J, Lodise TP, Levine DP, Bradley JS, Liu C, Mueller BA, Pai MP, Wong-Beringer A, Rotschafer JC, Rodvold KA, Maples HD, Lomaestro BM. Therapeutic monitoring of vancomycin for serious methicillin-resistant Staphylococcus aureus infections: a revised consensus guideline and review by the American Society of Health-System Pharmacists, the Infectious Diseases Society of America, the Pediatric Infectious Diseases Society, and the Society of Infectious Diseases Pharmacists. Am. J. Health Syst. Pharm., 77, 835–864 (2020).
- 7) Oda K, Jono H, Nosaka K, Saito H. Reduced nephrotoxicity with vancomycin therapeutic drug monitoring guided by area under the concentration-time curve against a trough 15–20 µg/mL concentration. Int. J. Antimicrob. Agents, 56, 106109 (2020).
- 8) Matsumoto K, Oda K, Shoji K, Hanai Y, Takahashi Y, Fujii S, Hamada Y, Kimura T, Mayumi T, Ueda T, Nakajima K, Takesue Y. Clinical practice guidelines for therapeutic drug monitoring of vancomycin in the framework of model-informed precision dosing: a consensus review by the Japanese Society of Chemotherapy and the Japanese Society of Therapeutic Drug Monitoring. Pharmaceutics, 14, 489 (2022).
- 9) Alshehri N, Ahmed AE, Yenugadhati N, Javad S, Al Sulaiman K, M Al-Dorzi H, Aljerasiy M, Badri M. Vancomycin in ICU patients with gram-positive infections: initial trough levels and mortality. Ther. Clin. Risk Manag., 16, 979–987 (2020).
- 10) Alzahrani AM, Naeem A, Alwadie AF, Albogami K, Alzhrani RM, Basudan SS, Alzahrani YA. Causes of vancomycin dosing error; problem detection and practical solutions; a retrospective, single-center, cross-sectional study. Saudi Pharm. J., 29, 616–624 (2021).
- 11) Fujii A, Kitagawa S, Kaya S, Sumida H, Doi Y, Katsumura T, Ninomiya Y, Kouguchi Y, Ishimatsu M, Tamura M, Hirata S, Oishi T, Terada K. Risk factors for high trough values of vancomycin hydrochloride. Jpn. J. Chemother., 67, 51–56 (2019).
- 12) Smit C, Wasmann RE, Goulooze SC, Wiezer MJ, van Dongen EPA, Mouton JW, Brüggemann RJM, Knibbe CAJ. Population pharmacokinetics of vancomycin in obesity: Finding the optimal dose for (morbidly) obese individuals. Br. J. Clin. Pharmacol., 86, 303–317 (2020).
- 13) Imai S, Takekuma Y, Miyai T, Sugawara M. A new algorithm optimized for initial dose settings of vancomycin using machine learning. Biol. Pharm. Bull., 43, 188–193 (2020).
- 14) Kavakiotis I, Tsave O, Salifoglou A, Maglaveras N, Vlahavas I, Chouvarda I. Machine learning and data mining methods in diabetes research. Comput. Struct. Biotechnol. J., 15, 104–116 (2017).
- 15) Momenyan S, Baghestani AR, Momenyan N, Naseri P, Akbari ME. Survival prediction of patients with breast cancer: comparisons of decision tree and logistic regression analysis. Int. J. Cancer Manag., 11, e9176 (2018).
- 16) Song YY, Lu Y. Decision tree methods: applications for classification and prediction. Shanghai Arch. Psychiatry , 27, 130–135 (2015).
- 17) Yasuhara M, Iga T, Zenda H, Okumura K, Oguma T, Yano Y, Hori R. Population pharmacokinetics of vancomycin in Japanese adult patients. Ther. Drug Monit., 20, 139–148 (1998).
- 18) Yamamoto M, Kuzuya T, Baba H, Yamada K, Nabeshima T. Population pharmacokinetic analysis of vancomycin in patients with gram-positive infections and the influence of infectious disease type. J. Clin. Pharm. Ther., 34, 473–483 (2009).
- 19) Kellum JA, Lameire N, Aspelin P, et al. KDIGO clinical practice guideline for acute kidney injury. Kidney Int. Suppl., 2, 1–138 (2012).
- 20) Examination committee of criteria for ‘Obesity Disease’ in Japan; Japan Society for the Study of Obesity. New criteria for ‘obesity disease’ in Japan. Circulation Journal, 66, 987–992 (2002).
- 21) WHO Expert Consultation. Appropriate body-mass index for Asian populations and its implications for policy and intervention strategies. Lancet, 363, 157–163 (2004).
- 22) Matsuo S, Imai E, Horio M, Yasuda Y, Tomita K, Nitta K, Yamagata K, Tomino Y, Yokoyama H, Hishida A. Revised equations for estimated GFR from serum creatinine in Japan. Am. J. Kidney Dis., 53, 982–992 (2009).
- 23) Cockcroft DW, Gault MH. Prediction of creatinine clearance from serum creatinine. Nephron, 16, 31–41 (1976).
- 24) Oda K, Hashiguchi Y, Kimura T, Tsuji Y, Shoji K, Takahashi Y, Matsumoto K, Kawamura H, Saito H, Takesue Y. Performance of area under the concentration-time curve estimations of vancomycin with limited sampling by a newly developed web application. Pharm. Res., 38, 637–646 (2021).
- 25) Thomson AH, Staatz CE, Tobin CM, Gall M, Lovering AM. Development and evaluation of vancomycin dosage guidelines designed to achieve new target concentrations. J. Antimicrob. Chemother., 63, 1050–1057 (2009).
- 26) Oda K, Katanoda T, Hashiguchi Y, Kondo S, Narita Y, Iwamura K, Nosaka K, Jono H, Saito H. Development and evaluation of a vancomycin dosing nomogram to achieve the target area under the concentration-time curve. A retrospective study. J. Infect. Chemother., 26, 444–450 (2020).
- 27) Toda T, Watanabe H, Kurosawa N, Owada E, Achiwa K, Yuhki Y, Tadano K, Takahashi Y, Harada H, Seki T, Hirano T. Limited sampling strategy for estimating area under the concentration curve for mycophenolic acid in renal transplant recipients with co-administration of tacrolimus. Jpn. J. Pharm. Health Care Sci., 30, 1–7 (2004).
- 28) Yamaguchi R, Kani H, Yamamoto T, Tanaka T, Suzuki H. Development of a decision flowchart to identify the patients need high-dose vancomycin in early phase of treatment. J. Pharm. Health Care Sci., 8, 3 (2022).
- 29) Mangoni AA, Jackson SH. Age-related changes in pharmacokinetics and pharmacodynamics: basic principles and practical applications. Br. J. Clin. Pharmacol., 57, 6–14 (2004).
- 30) D’Amico H, Wallace KL, Burgess D, Burgess DS, Cotner S, Mynatt R, Li N, Stromberg A, VanHoose J. Acute kidney injury associated with area under the curve versus trough monitoring of vancomycin in obese patients. Antimicrob. Agents Chemother., 66, e0088621 (2022).
- 31) Crass RL, Dunn R, Hong J, Krop LC, Pai MP. Dosing vancomycin in the super obese: less is more. J. Antimicrob. Chemother., 73, 3081–3086 (2018).
- 32) Cusumano JA, Klinker KP, Huttner A, Luther MK, Roberts JA, LaPlante KL. Towards precision medicine: Therapeutic drug monitoring-guided dosing of vancomycin and β-lactam antibiotics to maximize effectiveness and minimize toxicity. Am. J. Health Syst. Pharm., 77, 1104–1112 (2020).
- 33) Hashimoto M, Iketani O, Ichinose N, Enoki Y, Taguchi K, Uno S, Uwamino Y, Hasegawa N, Matsumoto K. Evaluation for optimal dosing of vancomycin in patients with different physical types. J. Infect. Chemother., 25, 735–737 (2019).
- 34) Matsuzaki T, Kato Y, Mizoguchi H, Yamada K. A machine learning model that emulates experts’ decision making in vancomycin initial dose planning. J. Pharmacol. Sci., 148, 358–363 (2022).
- 35) Pan Y, He X, Yao X, Yang X, Wang F, Ding X, Wang W. The effect of body mass index and creatinine clearance on serum trough concentration of vancomycin in adult patients. BMC Infect. Dis., 20, 341 (2020).
- 36) Mahmoud SH, Shen C. Augmented renal clearance in critical illness: An important consideration in drug dosing. Pharmaceutics, 9, 36 (2017).
- 37) Hirai T, Hanada K, Iwamoto T, Itoh T. Involvement of the effect of renal hypoperfusion medications on vancomycin trough concentration: a secondary analysis using a retrospective observational data. Basic Clin. Pharmacol. Toxicol., 129, 376–384 (2021).
- 38) Peralta CA, Katz R, DeBoer I, Ix J, Sarnak M, Kramer H, Siscovick D, Shea S, Szklo M, Shlipak M. Racial and ethnic differences in kidney function decline among persons without chronic kidney disease. J. Am. Soc. Nephrol., 22, 1327–1334 (2011).