Regular Articles
Pachymic Acid Inhibits Growth and Metastatic Potential in Liver Cancer HepG2 and Huh7 Cells
2023 年 46 巻 1 号 p. 35-41

詳細
2023 年 46 巻 1 号 p. 35-41
Pachymic acid (PA), exacted from Polyporaceae, has been known for its biological activities including diuretic, dormitive, anti-oxidant, anti-aging, anti-inflammatory and anticancer properties in several types of diseases. Recently, studies have demonstrated that PA could suppress cell growth and induce cell apoptosis in different kinds of cancer cells. But the underlying mechanisms remain poorly elucidated. In the current study, we investigated the effect of pachymic acid on liver cancer cells and its underlying mechanisms. Our results evidenced that pachymic acid effectively inhibited the cell growth and metastatic potential in HepG2 and Huh7 cells. Mechanistically, we revealed that pachymic acid triggered cell apoptosis by increasing caspase 3 and caspase 9 cleavage, upregulating Bax and cytochrome c expression, while reducing the expression of Bcl2. Besides, pachymic acid could markedly inhibit the cell invasion and migration and cell metastatic potential by mediating epithelial-to-mesenchymal transition (EMT) markers and metastasis-associated genes in HepG2 and Huh7 cells. In addition, we demonstrated that FAK-Src-Jun N-terminal kinase (JNK)-matrix metalloproteinase 2 (MMP2) axis was involved in PA-inhibited liver cell EMT. Together, these results contribute to our deeper understanding of the anti-cancer effects of pachymic acid on liver cancer cells. This study also provided compelling evidence that PA might be a potential therapeutic agent for liver cancer treatment.
Liver cancer is one of the most prevalent cancer around the world with prominent morbidity and mortality.1) It is reported that deaths from liver cancer are predicted to have over one million in 2030 according to the recent study.2) Effective treatments are required to prevent the recurrence, metastasis, and complexities of liver cancer.3) So far, surgery and liver transplants are the most effective treatments, but these two therapies are restricted in application because of the late diagnosis and the rapid progression for most patients with liver cancer.4) Drug administration is one of the most widely used method for liver cancer treatment, such as molecular targeted therapy, chemotherapy, biotherapy and traditional Chinese medicine therapy.5) But the therapeutic outcomes are still limited because of the high recurrence rate and drug resistance.6) However, the development of effective drugs against liver cancer with less side effects has progressed dramatically.
In recent years, the research on anti-cancer activity of traditional Chinese medicines have attracted wide attention because of their strong efficacy, high availability and little side effects.7) Numerous studies have shown the promising anti-tumor effect of traditional Chinese medicine extracts such as phenolics, triterpenoids, flavonoids, alkaloids. And some of them have already been used clinically to treat liver cancer.8)
Polyporaceae is a kind of well-known traditional Chinese medicine with numerous pharmacological bioactivities.9) Pachymic acid (PA), the chemical structure shown in Fig. 1A, is a component isolated from Polyporaceae. It has been demonstrated that PA possesses diuretic, dormitive, anti-oxidant, anti-aging, anti-inflammatory and anticancer properties.10,11) Additionally, the cell growth inhibition and cell apoptosis induction in breast cancer, lung cancer, ovarian cancer, pancreatic cancer, and gastric cancer cells have been extensively reported.12–15) PA was able to regulate phosphatase and tensin homolog deleted on chromosome ten/protein kinase B (PTEN/AKT) signaling pathway and the activity of caspase-3/7 on osteosarcoma cells,16) and decrease the protein level of matrix metalloproteinase-7 (MMP-7) in pancreatic cancer.17) Moreover, PA could impair glucose metabolism in SK-BR-3 breast cancer cells by serving as an activator of pyruvate kinase M2 (PKM2) and an inhibitor of hexokinase II (HK2).18) However, the potential antitumor activity of PA on liver cancer cells was still absent. Therefore, the objectives of our present study were to explore the effect of PA on liver cancer and reveal its underlying mechanisms.

(A) The chemical structure of Pachymic acid; (B) The effects of PA on cell ability were determined by MTT assay. (C) The effects of PA on colony formation in HepG2 and Huh7 cells. (D) Quantitative histograms of colony formation results. Results are expressed as mean ± standard deviation (S.D.). * p < 0.05 compared with the control group without PA treatment.
To investigate the cytotoxicity of PA on liver cancer cells, HepG2 and Huh7 cells were exposed to increase concentrations (0, 2.5, 5, 10, 20, 40, 60, 80 µM) of PA for 48 h. The cell viability after PA treatment was examined by Thiazolyl Blue Tetrazolium Bromide (MTT) assay. As the data shown in Fig. 1B, PA reduced the cell growth of both liver cancer HepG2 and Huh7 cells dose-dependently with the IC50 value at 41.07 and 60.41 µM, respectively. Additionally, colony formation assay was performed to confirm the inhibition ability of PA on HepG2 and Huh7 cells. As shown in Fig. 1C, the number of colonies formed after PA treatment was significantly reduced as compared with those in the control group (dimethyl sulfoxide (DMSO)). Together, these findings evidenced that PA exerted cell proliferation inhibitory effect on liver cancer cells.
PA Induced HepG2 and Huh7 Cells Apoptosis in VitroTo investigate whether the cell viability inhibition effect of PA was associated with cell apoptosis, we evaluated the activity of caspase-3 following PA treatment in HepG2 and Huh7 cells. As the data shown in Fig. 2A, PA dose-dependently increased caspase-3 activity, indicating the cell apoptosis induction after PA treatment. To further verify the PA-induced cell apoptosis, the expression of apoptosis-related proteins was measured by using Western blot. As indicated in Fig. 2B, PA significantly increased the expression level of cytochrome C and pro-apoptotic protein Bax, while attenuated the expression level of anti-apoptotic protein Bcl-2. Besides, PA remarkably up-regulated the expressions of cleaved-caspase-3 and 9. These results suggested that PA could promote cell apoptosis in liver cancer HepG2 and Huh7 cells.

(A) The caspase 3 activity after PA treatment was evaluated. (B) The expression level of apoptosis related proteins after PA treatment were examined by Western blot analysis. (C) The protein expressions after PA treatment were analyzed with ImageJ and normalized against β-actin; All data are expressed as mean ± S.D. * p < 0.05; ** p < 0.01 compared to the control group without PA treatment.
To assess the effect of PA on HepG2 and Huh7 cell mobility, a wound healing assay was applied. It showed that PA markedly inhibited wound field gap closure, as determined by the migration area of the two kind of cell lines (Fig. 3A). In addition, the invasive inhibition ability was further evaluated by in vitro transwell assay. As indicated in Fig. 3B, PA dose-dependently inhibited the invasion viability of HepG2 and Huh7 cells. These findings evidenced the inhibitory effect of PA against migration and invasion of liver cancer cells.
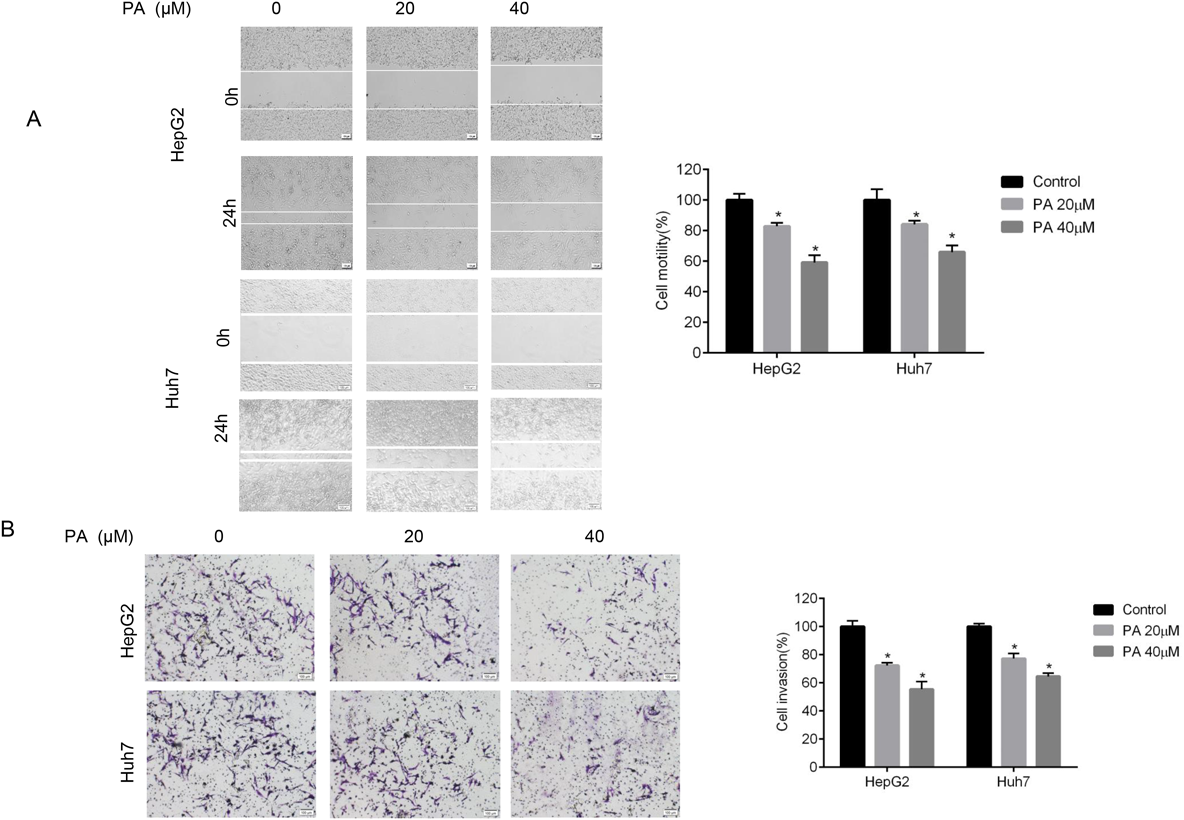
(A) The cellular motility after PA treatment were measured by wound healing assay in HepG2 and Huh7 cells. (B) The invasion ability after PA treatment was evaluated by transwell assay. Quantification results were normalized to the control group. Data are indicated as mean ± S.D. from triplicate trials. * p < 0.05 compared with untreated cells. Scale bars = 100 µm.
EMT is a key process mediated tumor cell migration, invasion, and metastasis. To further explore the mechanisms of PA-mediated inhibition of liver cancer cell migration and invasion, we examined the expression of EMT related markers in PA-treated cells. Our results showed that the mRNA expression of E-cadherin was significantly upregulated and the expression of N-cadherin was downregulated. We also found PA significantly decreased the mRNA levels of MMP-2 and MMP-9 in HepG2 and Huh7 cells as compared to the control groups (Fig. 4A). Consistent with the mRNA expressions, the protein levels of E-cadherin were increased while N-cadherin, MMP-2 and MMP-9 were dose-dependently decreased in HepG2 and Huh7 cells (Fig. 4B). In addition, several genes reported to suppress liver cancer metastasis like deleted in liver cancer-1 (DLC1)19) and tissue inhibitor of metalloproteinase 2 (Timp2)20) were all increased after PA treatment (Fig. 4C). These results provided molecular evidence suggesting that PA inhibited liver cancer cell migration and metastatic potential.
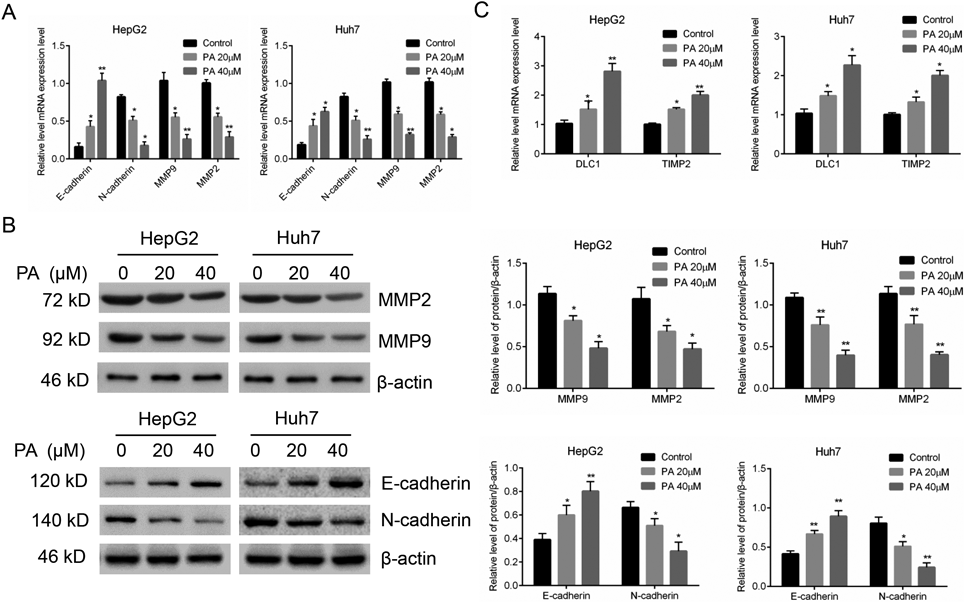
(A) The mRNA expressions level of EMT markers after PA treatment were analyzed by qRT-PCR. (B) The EMT-related protein expressions were determined by Western blot. Quantification results were normalized to β-action and expressed as histogram. (C) DLC1 and TIMP2 mRNA expressions after PA treatment were analyzed by qRT-PCR. Results are expressed as mean ± S.D. * p < 0.05, ** p < 0.01 compared with untreated cells.
In order to further investigate the underlying mechanism of cell metastatic potential inhibitory effect, we analyzed the effect of PA treatment on integrin β1/FAK/Src signal pathway, which is critical to acquire metastatic competence in cancer cells.21) As shown in Fig. 5, PA displayed a dramatic reduction in the protein expressions of FN1, integrin β1 and p-Src (Src autophosphorylation at Y416). Besides, the expression of p-FAK (FAK autophosphorylation at Y397) and phosphorylation of Jun N-terminal kinase (p-JNK) were also significantly downregulated following exposure to PA treatment. These data indicated that the integrin β1/FAK/Src signal pathway was directly interfered after PA treatment in HepG2 and Huh7 cells, thus inhibiting cell metastatic potential.
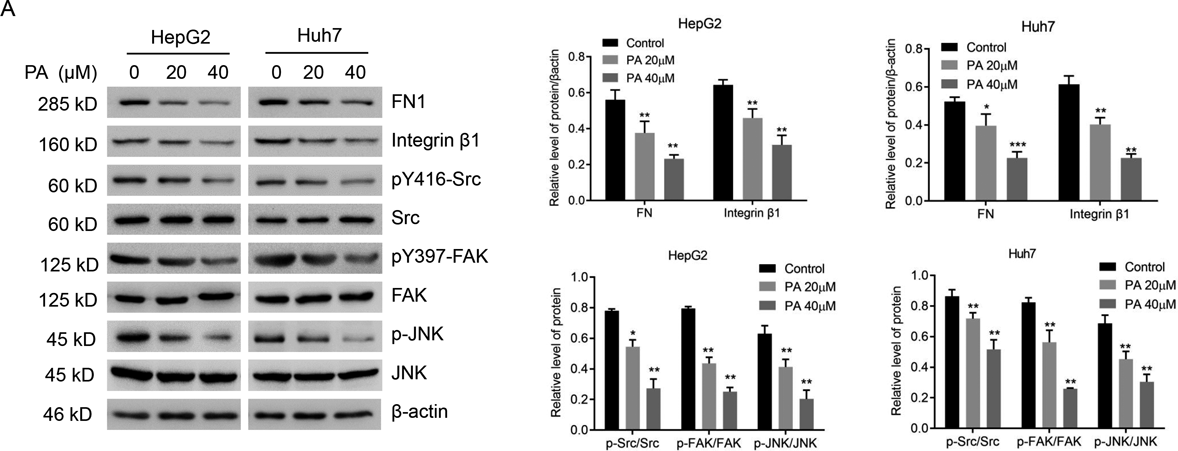
(A) The protein expression of FN1, Integrin β1, Src, p-Src, FAK, p-FAK, JNK, p-JNK were measured by Western blotting. Results are presented as mean ± S.D. of three independent trials. * p < 0.05, ** p < 0.01, *** p < 0.001 compared with the untreated cells.
To further elucidate the role of PA on integrin β1/FAK/Src signaling cascade in liver cancer cells migration and invasion, SB-273005, an integrin inhibitor, was used. As shown in Figs. 6A and B, PA combined with SB273005 treatment exerted a more significant reduction of MMP-2 and p-Src as compared with PA treatment group. Consistent with this result, cell invasion assay showed the augmented invasive inhibition effects was observed in combined treatment group (Fig. 6C). Taken together, our data suggested that integrin β1/FAK/Src signaling pathway was involved in PA-inhibited metastatic potential in liver cancer.
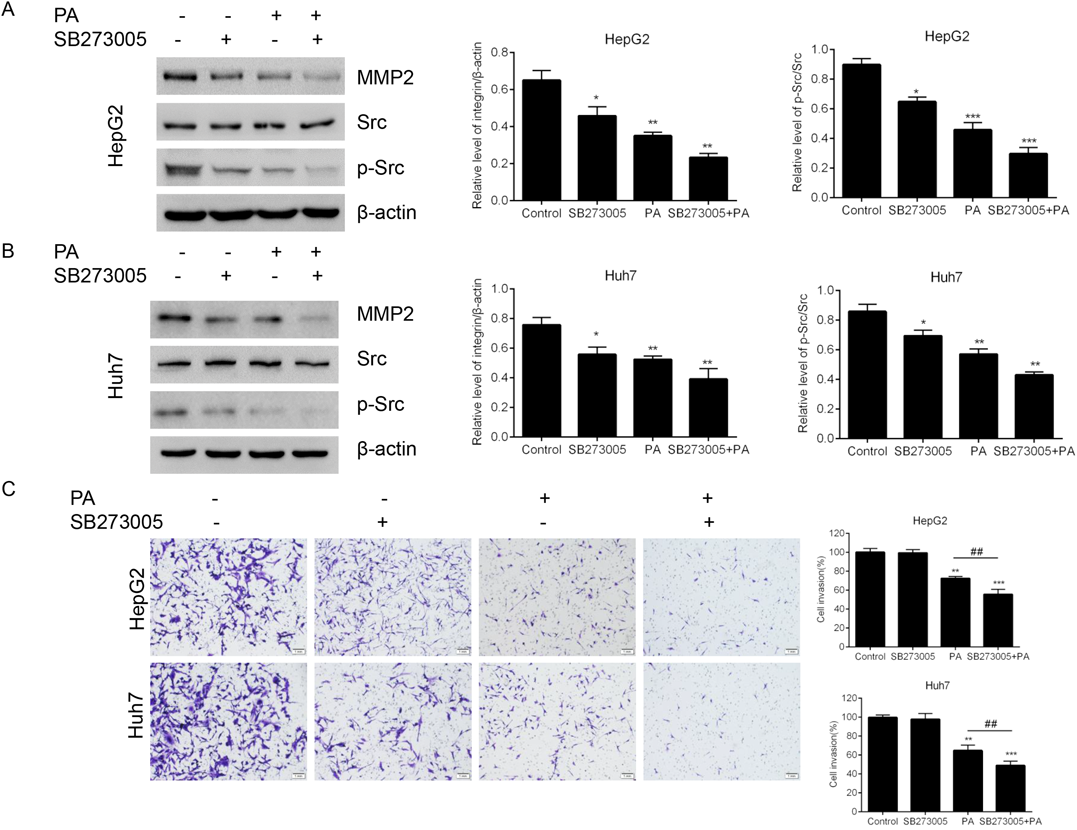
(A) The protein expressions of MMP-2, Src and p-Src after treatment with PA, SB273005 or a combination of both were measured by Western blotting in (A) HepG2 cells and (B) Huh7 cells. The relative expression levels were analyzed with ImageJ and the data were normalized to β-actin. (C) The invasion ability of after treatment with PA, SB273005 or a combination of both was evaluated by transwell assay. All the results are represented as mean ± S.D. * p < 0.05; ** p < 0.01; *** p < 0.001 compared with the untreated cells.
Although PA is a promising nature compound to exert anti-tumor effects in different kind of cancer cells,22–24) its biological activity in liver cancer is poorly understood. In the present study, we showed that PA could inhibit the growth of human liver cancer HepG2 and Huh7 cells in a dose-dependent manner. As apoptosis can occur dependently or independently of caspase-3, we found that PA activated caspase-3 and increased caspase-3 cleavage in HepG2 and Huh7 cells.25) During the apoptosis, cytochrome c binded with Apaf1 and pro-caspase 9 to form apoptosome complex and then activated caspase-9. In addition, Bax and Bcl-2 could regulate the release of cytochrome c from mitochondria through alteration of mitochondrial membrane permeability.26,27) Our data showed the upregulation of caspase 9 cleavage, Bax and cytochrome c and the downregulation of Bcl2 in PA-treated liver cancer cells, suggesting that the mitochondrial pathway was involved in PA triggered HepG2 and Huh7 cells apoptosis. This finding was consistent with the previous reports that PA could induce apoptosis in different types of cancer cells11,28) and indicated the anti-tumor effects of PA on liver cancer cells.
The metastatic dissemination is a lethal hallmark of cancer and a principal cause of death in liver cancer patients.29) However, there is still no ideal therapeutic strategies for liver cancer metastasis. Our results showed that PA significantly inhibited liver cancer cells HepG2 and Huh7 migration and invasion. EMT has been reported as a key process in cancer migration, invasion and metastasis, which triggered tumor cells dissociation from primary carcinomas, then migration and dissemination to distant sites.30) The epithelial phenotypic markers like E-cadherin and mesenchymal markers like N-cadherin help us to identify EMT at the molecular level. MMP-9 and MMP-2 degraded extracellular matrix (ECM) and promote cancer cell local-to-distant infiltration and played pivotal roles in tumor invasion and metastasis in malignant liver cancer.31) In addition, the tissue inhibitors of metalloproteinases (TIMP2) can inhibit the activation of MMP2 and tumor cell metastasis. Deleted in liver cancer 1 (DLC1) was reported as a Rho GTPase activator and played a tumor metastasis suppressor role in liver cancer.19) In the present study, we showed that PA dose-dependently downregulated expression of N-cadherin, MMP2 and MMP9 while upregulated the expression of E-cadherin, DLC1 and Timp2. Thus, these findings suggested that PA suppresses human liver cancer cell migration, invasion and metastatic potential through targeting multiple mechanisms.
Integrin signaling pathway is a main pathway function in mediating cell migration and invasion.32,33) FAK is a non-receptor tyrosine kinase downstream of integrin. Integrin promote FAK autophosphorylation at Y397 and then ineteracts with Src. The FAK/Src complex then trigger downstream signaling pathways to regulate various cellular process like migration.34) Previous study reported that FAK signaling pathway could activate JNK1 and upregulate MMP2 expression and cell migration and invasion ability. In the present study, we found that PA reduced integrin β1 expression and inhibited the phosphorylation of FAK and Src. This suppression further downregulated MMP2 expression and prevent the cell migration and invasion in PA treated liver cells. In addition, PA combined with SB273005 had more pronounced inhibition on p-Src and MMP2 protein expression. The results suggested that FAK/Src signal pathway was involved in the inhibition effect of PA on cell migration and invasion.
Collectively, our results revealed that PA downregulates MMP-2 expression and inhibits liver cell migration and invasion. These findings of this research provide new insights for understanding how PA exerts inhibitory effects against liver cancer metastatic potential.
Pachymic acid (CAS No. 29070-92-6) was purchased from MedChemExpress (Monmouth Junction, NJ, U.S.A.); the Dulbecco’s modified Eagle’s medium (DMEM) cell culture medium and fetal bovine serum (FBS) were obtained from HyClone (UT, U.S.A.); 1% penicillin-streptomycin was purchased from Gibco (NY, U.S.A.); MTT kit and enzyme-linked immunosorbent assay (ELISA) kit were purchased from Sigma (St. Louis, MO, U.S.A.); PrimeScript TM RT reagent Kit was obtained from TaKaRa Bio Inc. (Kusatsu, Japan); SB273005 was obtained from Selleck Chemical (Huston, TX, U.S.A.); Primary antibodies specific for Bax, Bcl-2, Cyto C, cleaved-caspase 3/9, MMP-2/9, Integrin β1, Src, p-Src, FAK, p-FAK, JNK, p-JNK were all obtained from Cell Signaling Technology (Beverly, MA, U.S.A.); antibody specific for FN1 and β-actin were obtained from Abcam (MA, U.S.A.).
Cell CultureLiver cancer HepG2 and Huh7 cells were obtained from ATCC (VA, U.S.A.) and used for this study. Cells were cultured in DMEM medium contains 10% heat-inactivated FBS and penicillin (100 U/mL) and streptomycin (100 µg/mL), and incubated in a CO2-regulated incubator at 37 °C with 5% CO2 infusion and 95% humidity.
MTT AssayMTT assay was applied to determine the effect of PA on liver cancer cell viability. Briefly, HepG2 and Huh7 cells were plated into 96-well plates (1.0 × 10⁴ cells/well) and incubated for 24 h. Then the cells were administrated with increasing concentration of PA (0, 2.5, 5.0, 10.0, 20.0, 40.0, 60.0, and 80.0 µmol/L) for 72 h. At the end of the treatment, each well was added by 100 µL MTT solution (final concentration 0.5 mg/mL) and incubated for 4 h at 37 °C. Then the supernatant was discarded followed by 200 µL DMSO added. After shaking the plate for 5 min, the absorbance was read by a microplate reader at 570 nm and the cell viability was calculated.
Colony Formation AssayLiver cancer HepG2 and Huh7 cells were seeded into six-well plates with 800 cells/well. Following 24 h of cultivation, the cells were subjected to medium containing with or without PA (20 µM) for another 24 h. Then the culture medium was replaced with normal medium to cultivate for about 2 weeks until cell colonies were formed. At the end of the incubation, cells were washed with ice-cold phosphate buffered saline (PBS) for 3 times, fixed in 70% ethanol solution, and stained with 1% crystal violet solution for 20 min. Then the colonies were imaged and the number of colonies was counted.
Caspase-3 Activity MeasurementWe measured the activity of caspase-3 by using Caspae-3 Assy kit (colorimetric) (Abcam, ab39401) according to the manufacturer’s instruction. Briefly, HepG2 and Huh7 cells were plated into 24-well plates with 3.0 × 10⁵ cells per well and cultivated for 24 h. Then the cells were subjected to the treatment of PA (0, 20, and 40 µM). At the end of the treatment, the cells were lysed and the supernatant was transfer to a fresh tube. Then the supernatant was incubated with substrate in the reaction buffer for 2 h at 37 °C and measured at 400–405 nm by a microplate reader (Bio-Tek, VT, U.S.A.).
Western BlotPA-treated cells were harvested and washed by ice-cold PBS, and then cracked by lysis buffer supplemented with protease inhibitor on ice for thirty minutes. After the debris and insoluble materials were removed by centrifugation, the total protein concentration of each sample was quantified by bicinchoninic acid (BCA) method. For Western blotting procedure, equal amount of protein lysates of each sample was resolved by polyacrylamide gels. After separation, and proteins were electroblotted onto nitrocellulose (NC) membrane subsequently been blocked by 5% non-fat dry milk in Tris Buffered Saline with Tween (TBST) buffer at room temperature for 1 h, following incubation with primary antibodies at 4 °C overnight. HRP-conjugated secondary antibody was incubated at room temperature for 2 h. Finally, the designated protein bands were visualized by enhanced chemiluminescence (ECL) kit, and the experimental data were statistically analyzed by Image J software.
Wound Healing AssayCells were plated into a six-well plate with 4 × 10⁵ cells per well and cultured in DMEM medium for 12 h. Wounds were slowly and gently made by scratching perpendicular to the dish with a 20 µL sterile pipette tip. Then the cells were washed 3 times with PBS to remove the detached ones and the remaining cells were further cultivated in DMEM medium (without serum) containing different concentrations of PA (0, 20, and 40 µM) in a 37 °C incubator. The cell wounds were photographed every 12 h post-wounding via a phase-contrast microscopy system. The cell migration rate was quantified by width of scratch area at different time points relative to the original width of scratch.
Cell Invasion AssayThe cell invasion assay was assessed using 50 µL pre-coated matrigel transwell chambers. Briefly, 750 µL DMEM cell culture medium with 10% FBS was placed in the lower chamber, HepG2 or Huh7 cells in serum-free culture medium contained with indicated concentrations of PA (0, 20, and 40 µM) were added to the upper chamber and then cultivated at a 37 °C incubator containing 5% CO2. After 48 h, the invaded cells which passed through matrigel-coated membrane were fixed with 4% formaldehyde, followed by stained with 0.1% crystal violet solution. Then the cells were counted and photographed under an optical microscope.
Quantitative Real-Time PCR (qRT-PCR)The cellular RNA was extracted from HepG2 or Huh7 cells after PA treatment (0, 20, and 40 µM) by using Trizol reagent (Invitrogen, Waltham, MA, U.S.A.). Then RNA concentration was determined by spectrophotometer and equal amount of RNA (1 µg) was immediately used for reverse transcribed into cDNA via PrimeScript TM RT reagent Kit. The mRNA expression levels were quantified by SYBR Green Real-Time PCR Master Mix (Toyobo, Osaka, Japan) and normalized by β-actin mRNA levels.
Statistical MethodsGraph-Pad Prism 7.0 software was used to carry out all the statistical graphs and data analysis. Experimental data were reported as mean (χ) ± standard deviation(s). The differences between groups were studied and assessed with analysis of Student’s t-test, with statistical significance established at * p < 0.05, ** p < 0.01, *** p < 0.001.
Yongzhi Liu conceived and designed the experiments; Feng Jiang, Yang Chen, Zhidong Fu, Lihui Jiang and Chunfeng Yang performed the experiment, analyzed the data; Yongzhi Liu, Feng Jiang and Tieming Zhu wrote the manuscript.
The authors declare no conflict of interest.