Abstract
Morphinone (MO) is an electrophilic metabolite of morphine that covalently binds to protein thiols via its α,β-unsaturated carbonyl group, resulting in toxicity in vitro and in vivo. Our previous studies identified a variety of redox signaling pathways that are activated during electrophilic stress. Here, we examined in vitro activation of a signaling pathway involving Kelch-like ECH-associated protein 1 (Keap1) and nuclear factor erythroid 2-related factor 2 (Nrf2) in response to MO. Exposure of HepG2 cells to MO caused covalent modification of Keap1 thiols (evaluated using biotin-PEAC5-maleimide labeling) and nuclear translocation of Nrf2, thereby up-regulating downstream genes encoding ATP binding cassette subfamily C member 2, solute carrier family 7 member 11, glutamate-cysteine ligase catalytic subunit, glutamate-cysteine ligase modifier subunit, glutathione S-transferase alpha 1, and heme oxygenase 1. However, dihydromorphinone, a metabolite of morphine lacking the reactive C7–C8 double bond, had little effect on Nrf2 activation. These results suggest that covalent modification is crucial in the Keap1/Nrf2 pathway activation and that this pathway is a redox signaling-associated adaptive response to MO metabolism.
INTRODUCTION
Morphinone (MO) is produced from morphine, a narcotic analgesic, by enzymatic reaction of nicotinamide adenine dinucleotide (NAD)(P)-dependent enzymes such as morphine 6-dehydrogenase and aldo-keto reductase isozymes.1) Our metabolic experiments in vitro have also shown that MO is produced in livers of guinea pig, rat, rabbit, mouse, hamster, bovine and human,2,3) suggesting that the metabolic pathway of morphine to MO is common to all mammals. As the α,β-unsaturated carbonyl group makes MO electrophilic, this metabolite is attacked by thiol groups of glutathione (GSH) and proteins to yield MO–GSH and MO–protein adducts, respectively4) (Fig. 1). Several researches have shown that chronic morphine treatment reduce GSH levels in liver and induce liver damage in vivo,5,6) suggesting a relation between the reactive metabolite of morphine and the liver damage. Electrophilic modification of proteins changes their functions, leading to activation of redox signaling pathways. However, the contributions of the electrophilic morphine metabolite to activation of redox signaling pathways through S-modification of proteins remain unclear.
Kelch-like ECH-associated protein 1 (Keap1) is a negative regulator of nuclear factor erythroid 2-related factor 2 (Nrf2) and has reactive cysteine residues, which are easily modified by electrophiles.7) Upon electrophile binding to its reactive cysteines, Keap1 function is lost and Nrf2 escapes degradation through the ubiquitin-proteasome pathway.7) The accumulated Nrf2 translocates from cytosol to the nucleus and interacts with small musculoaponeurotic fibrosarcoma proteins to form heterodimers, which upregulate genes associated with antioxidative proteins, phase II drug metabolizing enzymes, and phase III transporters by binding to their antioxidant responsive element.8) We have previously reported that electrophilic chemicals with an α,β-unsaturated carbonyl group (e.g., tert-butyl-1,4-benzoquinone, 1,2-naphthoquinone, (E)-2-decenal, and crotonaldehyde) activate the Keap1/Nrf2 pathway and induce downstream expression of proteins,9) suggesting that MO could also activate this pathway. In this study, we aimed to investigate MO-mediated activation of the Keap1/Nrf2 pathway in human hepatocellular carcinoma, HepG2 cells.
MATERIALS AND METHODS
MaterialsWe synthesized MO and dihydromorphinone using the protocols of Rapoport et al.10,11) Anti-glyceraldehyde-3-phosphate dehydrogenase antibodies, anti-Keap1, anti-Nrf2, and were obtained from Santa Cruz Biotechnology (Dallas, TX, U.S.A.). Protease inhibitor cocktail, anti-β actin antibody and avidin agarose were sourced from Sigma-Aldrich (St. Louis, MO, U.S.A.). Anti-histone deacetylase 1 antibody was obtained from Cell Signaling Technology (Beverly, MA, U.S.A.). All chemicals were of the highest grade available.
Cell CultureHepG2 cells from RIKEN Cell Bank (Ibaraki, Japan) were cultured in Dulbecco’s modified Eagle’s medium (DMEM) supplemented with a high level of glucose and pyruvate (Thermo Fisher Scientific, Waltham, MA, U.S.A.), 10% (v/v) fetal bovine serum, and 1% (v/v) penicillin–streptomycin (Thermo Fisher Scientific) at 37 °C in a 5% CO2 atmosphere. The cells were seeded in a 12-well plate (5 × 10⁵ cells/well) or 35 mm dishes (8 × 10⁵ cells/dish) for 24 h and then starved in serum-free DMEM for 24 h before treatment with MO or dihydromorphinone.
Western BlottingA lysis buffer (50 mM Tris–HCl (pH 7.5), 6 M urea, 5 mM ethylenediaminetetraacetic acid (EDTA), 1% (v/v) Triton X-100, and 1% (v/v) protease inhibitor cocktail) was used to collect the cells and the concentration of protein in the lysate was analyzed by the bicinchoninic acid assay (Thermo Fisher Scientific). Samples were mixed with half the volume of loading buffer (62.5 mM Tris–HCl [pH 6.8], 5 mM 2-mercaptoethanol, 10% (v/v) sodium dodecyl sulfate (SDS), 0.015% (v/v) bromophenol blue, and 20% (v/v) glycerol) and incubated at 95 °C. The proteins in lysate were separated using SDS polyacrylamide gel electrophoresis and transferred onto polyvinylidene difluoride membranes. The membranes were blocked with 5% (v/v) skim milk in Tween 20-Tris-buffered saline for 1 h, reacted with primary antibodies, and then with secondary antibodies which labeled with horseradish peroxidase. The immunoreactive proteins were detected using Amersham ECL Western blotting Detection Reagent (GE Healthcare, Chalfont St. Giles, U.K.). ImageJ software was used to measure the band intensity (Wayne Rasband, National Institutes of Health, Bethesda, MD, U.S.A.).
Biotin-PEAC5-Maleimide (BPM) AssayThe BPM labeling assay was performed to detect S-modification of cellular Keap1 as previously described.12) Briefly, the cells were collected by scraping in a lysis buffer (50 mM Tris–HCl (pH 6.8), 150 mM NaCl, 0.5% (v/v) deoxycholate, 1% (v/v) NP-40, and 1% (v/v) protease inhibitor cocktail) containing 100 µM BPM (Dojindo, Kumamoto, Japan). The lysate was incubated on ice for 1 h, centrifuged at 15000 × g for 10 min at 4 °C, and then collected the supernatant. The BPM-labeled proteins in the reaction mixture were precipitated using avidin agarose. After being washed, Western blotting was used to analyze the precipitated proteins.
Nuclear and Cytoplasmic ExtractionAfter treatment with MO or dihydromorphinone, the cells were washed twice with phosphate buffered saline (PBS), incubated with trypsin to detach the cells, collected in DMEM containing 10% (v/v) fetal bovine serum, and centrifuged at 1000 rpm for 10 min. The cell pellet was suspended in ice-cold PBS and centrifuged again, gently resuspended and incubated in 300 µL of suspension buffer (10 mM N-(2-hydroxyethyl)piperazine-N′-2-ethanesulfonic acid (HEPES)–KOH (pH 7.9), 0.5 mM dithiothreitol, 10 mM KCl, 1.5 mM MgCl2, 100 µM digitonin, and 1% (v/v) protease inhibitor cocktail) at 4 °C for 10 min, then centrifuged at 15000 rpm for 10 min at 4 °C. The cytoplasmic and nuclear fractions were collected from the supernatant and pellet, respectively.
Quantitative PCR (qPCR)After 6 h treatment with MO, the cells were washed three times with ice-cold PBS. Total RNA (1 µg), extracted using TRIzol (Thermo Fisher Scientific), was converted to cDNA using the Affinity Script qPCR cDNA Synthesis kit (Agilent Technologies, Santa Clara, CA, U.S.A.), and then qPCR was performed. The following primers were used: glutamate-cysteine ligase modifier subunit (GCLM), forward 5′-TCTTGCCTCCTGCTGTGTGATG-3′ and reverse 5′-TTGGAAACTTGCTTCAGAAAGCAG-3′; glutamate-cysteine ligase catalytic subunit (GCLC), forward 5′-GGAAGTGGATGTGGACACCAGA-3′ and reverse 5′-GCTTGTAGTCAGGATGGTTTGCG-3′; glutathione S-transferase alpha 1 (GSTA1), forward 5′-GCAGACCAGAGCCATTCTCAAC-3′ and reverse 5′-ACATACGGGCAGAAGGAGGATC-3′; heme oxygenase 1 (HO-1), forward 5′-CCAGGCAGAGAATGCTGAGTTC-3′ and reverse 5′-AAGACTGGGCTCTCCTTGTTGC-3′; solute carrier family 7 member 11 (SLC7A11), forward 5′-TCCTGCTTTGGCTCCATGAACG-3′ and reverse 5′-AGAGGAGTGTGCTTGCGGACAT-3′; ATP binding cassette subfamily C member 2 (ABCC2), forward 5′-GCCAACTTGTGGCTGTGATAGG-3′ and reverse 5′-ATCCAGGACTGCTGTGGGACAT-3′; acidic ribosomal phosphoprotein P0 (36B4), forward 5′-TCTACAACCCTGAAGTGCTTGAT-3′ and reverse 5′-CAATCTGCAGACAGACACTGG-3′. The expression of mRNAs was normalized to that of 36B4 mRNA.
Small Interfering RNA (siRNA) TransfectionAccording to the manufacturer’s protocol, siRNA was transfected using Lipofectamine RNAiMAX. The siRNA sense and antisense sequences for Nrf2 (siNrf2) were: 5′-CAUUGAUGUUUCUGAUCUAdTdT-3′ (sense) and 5′-UAGAUCAGAAACAUCAAUGdTdT-3′ (antisense). The control siRNA sense and antisense sequences for β-galactosidase (siLacZ) were: 5′-UGGCGAUUACCGUUGAUGUTTdTdT-3′ (sense) and 5′-ACAUCAACGGUAAUCGCCAdTdT-3′ (antisense).
Data AnalysisStatistical analysis was conducted using one-way ANOVA followed by Tukey’s multiple-comparison test using GraphPad Prism version 8.4.3 (GraphPad Software, San Diego, CA, U.S.A.), and p < 0.05 was considered to indicate a significant difference.
RESULTS AND DISCUSSION
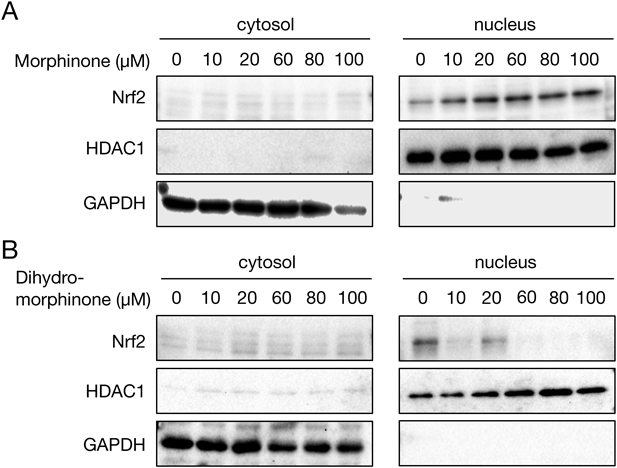
As S-modification of Keap1 accounts for activation of Nrf2, we first assessed Keap1 modification during exposure of HepG2 cells to MO by an indirect assay using BPM, biotinylated electrophile probe. BPM labels free thiols on proteins and thus the amount of BPM-labeled protein is inversely proportional to the amount of S-modification. As shown in Fig. 2A, the amount of BPM-labeled Keap1 was significantly decreased following MO treatment of HepG2 cells, suggesting that Nrf2 could be activated by MO. As expected, MO exposure activated Nrf2 in a concentration- and time-dependent manner (Figs. 2B, C). Under these conditions, MO enhanced translocation of Nrf2 to the nucleus (Fig. 3A). In contrast, non-electrophilic dihydro-morphinone did not enhance nuclear translocation of Nrf2 (Fig. 3B). These results suggested that MO activated the Keap1/Nrf2 pathway through modification of Keap1, although further study is needed to identify the exact site of modification. Nrf2 cooperatively regulates phase II drug-metabolizing enzymes (e.g., GCLM, GCLC, GSTs), phase-III transporters (e.g., multidrug resistance associated proteins (MRPs), cysteine/glutamic acid transporter (xCT/SLC7A11)), and anti-oxidant proteins (e.g., HO-1).7,8,13) Therefore, we also detected the expression levels of genes downstream of Nrf2. MO exposure significantly enhanced the expression levels of GCLM, GCLC, GSTA1, HO-1, SLC7A11, and ABCC2 (MRP2) in HepG2 cells (Fig. 4). xCT/SLC7A11 transports cystine into cells, and GSH and thioredoxin reductase reduce cystine to cysteine.14,15) GCL catalyzes synthesis of γ-glutamyl cysteine, which further reacts with glycine in the presence of GSH synthetase to form GSH.16) GSTs catalyze GSH conjugation, and the resulting GSH adducts are exported to the extracellular space by MRPs.17,18) MO is known to form GSH adducts with or without GSTs4) (Fig. 1), which indicates that genes upregulated by MO, such as GCLM, GCLC, GSTA1, SLC7A11, and ABCC2, facilitate the detoxication of MO. Knockdown of Nrf2 using siRNA significantly suppressed MO-mediated induction of GCLM, SLC7A11, and ABCC2 expression (Fig. 5), suggesting that Nrf2 activation plays a crucial role in MO inactivation. Taken together, these findings indicate that MO activates Nrf2 through covalent modification of Keap1, leading to upregulation of its downstream proteins such as antioxidative proteins, phase II drug-metabolizing enzymes, and phase III transporters. Generally, non-specific modification of proteins by excess electrophiles disrupts cellular homeostasis, leading to toxicity.9) Thus, MO produced in the liver appears to be associated with a cytoprotective response against electrophilic stress from morphine metabolism by activation of phase II–III reactions via the Keap1/Nrf2 pathway.
Acknowledgments
This work was supported in part by Grants-in-Aid for Scientific Research from the Ministry of Education, Culture, Sports, Science and Technology of Japan (#22K15657 to K.M., #20K12180 to Y.A., and #18H05293 to Y.K.).
Conflict of Interest
The authors declare no conflict of interest.
REFERENCES
- 1) Yamano S, Kageura E, Ishida T, Toki S. Purification and characterization of guinea pig liver morphine 6-dehydrogenase. J. Biol. Chem., 260, 5259–5264 (1985).
- 2) Yamano S, Takahashi A, Todaka T, Toki S. In vivo and in vitro formation of morphinone from morphine in rat. Xenobiotica, 27, 645–656 (1997).
- 3) Todaka T, Ishida T, Kita H, Narimatsu S, Yamano S. Bioactivation of morphine in human liver: isolation and identification of morphinone, a toxic metabolite. Biol. Pharm. Bull., 28, 1275–1280 (2005).
- 4) Kumagai Y, Todaka T, Toki S. A new metabolic pathway of morphine: in vivo and in vitro formation of morphinone and morphine-glutathione adduct in guinea pig. J. Pharmacol. Exp. Ther., 255, 504–510 (1990).
- 5) Payabvash S, Beheshtian A, Salmasi AH, Kiumehr S, Ghahremani MH, Tavangar SM, Sabzevari O, Dehpour AR. Chronic morphine treatment induces oxidant and apoptotic damage in the mice liver. Life Sci., 79, 972–980 (2006).
- 6) Bekheet SH. Morphine sulphate induced histopathological and histochemical changes in the rat liver. Tissue Cell, 42, 266–272 (2010).
- 7) Taguchi K, Motohashi H, Yamamoto M. Molecular mechanisms of the Keap1-Nrf2 pathway in stress response and cancer evolution. Genes Cells, 16, 123–140 (2011).
- 8) Unoki T, Akiyama M, Kumagai Y, Goncalves FM, Farina M, da Rocha JBT, Aschner M. Molecular pathways associated with methylmercury-induced Nrf2 modulation. Front. Genet., 9, 373 (2018).
- 9) Kumagai Y, Abiko Y. Environmental electrophiles: protein adducts, modulation of redox signaling, and interaction with persulfides/polysulfides. Chem. Res. Toxicol., 30, 203–219 (2017).
- 10) Rapoport H, Baker DR, Reist HN. Morphinone. J. Org. Chem., 22, 1489–1492 (1957).
- 11) Rapoport H, Naumann R, Bissell ER, Bonner RM. The preparation of some dihydro ketones in the morphine series by Oppenauer oxidation. J. Org. Chem., 15, 1103–1107 (1950).
- 12) Abiko Y, Mizokawa M, Kumagai Y. Activation of the Kelch-like ECH-associated protein 1 (Keap1)/NF-E2-related factor 2 (Nrf2) pathway through covalent modification of the 2-alkenal group of aliphatic electrophiles in Coriandrum sativum L. J. Agric. Food Chem., 62, 10936–10944 (2014).
- 13) Sasaki H, Sato H, Kuriyama-Matsumura K, Sato K, Maebara K, Wang H, Tamba M, Itoh K, Yamamoto M, Bannai S. Electrophile response element-mediated induction of the cystine/glutamate exchange transporter gene expression. J. Biol. Chem., 277, 44765–44771 (2002).
- 14) Mandal PK, Seiler A, Perisic T, Kolle P, Banjac Canak A, Forster H, Weiss N, Kremmer E, Lieberman MW, Bannai S, Kuhlencordt P, Sato H, Bornkamm GW, Conrad M. System x(c)- and thioredoxin reductase 1 cooperatively rescue glutathione deficiency. J. Biol. Chem., 285, 22244–22253 (2010).
- 15) Sato H, Tamba M, Ishii T, Bannai S. Cloning and expression of a plasma membrane cystine/glutamate exchange transporter composed of two distinct proteins. J. Biol. Chem., 274, 11455–11458 (1999).
- 16) Griffith OW. Biologic and pharmacologic regulation of mammalian glutathione synthesis. Free Radic. Biol. Med., 27, 922–935 (1999).
- 17) Ballatori N, Rebbeor JF. Roles of MRP2 and oatp1 in hepatocellular export of reduced glutathione. Semin. Liver Dis., 18, 377–387 (1998).
- 18) Armstrong RN. Structure, catalytic mechanism, and evolution of the glutathione transferases. Chem. Res. Toxicol., 10, 2–18 (1997).