Abstract
Platelet-activating factor acetylhydrolase (PAF-AH) hydrolyzes an acetyl ester at the sn-2 position of platelet-activating factor (PAF), thereby mediating a variety of biological functions. PAF-AH is found in three isoforms: Type I PAF-AH (PAF-AH I) and Type II PAF-AH (PAF-AH II) are intracellular enzymes whereas plasma PAF-AH is characterized by association with lipoprotein in plasma. PAF-AH I forms a tetramer constituted by two catalytic subunits (α1 and α2) with β regulatory subunits. We recently showed that a deficiency of PAF-AH I catalytic subunits in male mice caused an increase of body weight, food intake, and white adipose tissue (WAT) weight. In this study, we examined whether the expression of this enzyme was altered in the differentiation of 3T3-L1 preadipocytes into adipocytes. The amount of PAF-AH I α1 subunit protein was significantly reduced in 3T3-L1 differentiation, while the amount of the PAF-AH I α2 subunit was not changed. Immunoprecipitation analysis of 3T3-L1 differentiation showed that the complex of PAF-AH I catalytic subunits was changed from α1/α2 heterodimer to α2/α2 homodimer. Our findings suggest that changes in PAF-AH I catalytic subunits are involved in adipocyte differentiation of 3T3-L1 and obesity in mice.
INTRODUCTION
Platelet-activating factor (PAF; 1-O-alkyl-2-acetyl-sn-glycero-3-phosphocholine) is a potent phospholipid mediator of physiological events. The acetyl group at the sn-2 position is essential for the physiological activity of PAF.1) Platelet-activating factor acetylhydrolase (PAF-AH) is classified into the phospholipase A2 family, which is characterized by the hydrolysis of the acyl ester at the sn-2 position of glycerophospholipids.2) Three kinds of PAF-AHs are known to degrade the acetyl ester of PAF: intracellular forms named Type I PAF-AH (PAF-AH I) and Type II PAF-AH (PAF-AH II) as well as an extracellular isoform, plasma PAF-AH.3) Among the three PAF-AHs, intracellular PAF-AH I forms a complex comprising a regulatory subunit, β, and catalytic subunits, α1 and/or α2.4,5) It is reported that the α1 subunit is expressed in limited tissues such as the fetal rat brain,6) adult mouse testis,7) and adult human red blood cells.8) Previously, Koizumi et al. demonstrated that a deficiency of PAF-AH I α1 and α2 catalytic subunits causes severe impairment in spermatogenesis and a decrease in testis weight.7) We recently demonstrated that a deficiency of PAF-AH I α1 and α2 catalytic subunits causes an increase in body weight due to reduced testosterone levels in male mice.9) These results prompted us to hypothesize that PAF-AH I α1 and α2 catalytic subunits are associated with obesity. It was reported that the catalytic complex of PAF-AH I changed from α1/α2 heterodimer to α2/α2 homodimer in rats during the development of the brain.6) They also reported that these complexes showed different substrate specificities using artificially synthesized phospholipid analogs.
In the present study, we investigated the change in the expression of individual PAF-AH I catalytic subunits during 3T3-L1 differentiation from preadipocytes into adipocytes. We found that the complex of catalytic subunits was changed from α1/α2 heterodimer to α2/α2 homodimer in adipocytes.
MATERIALS AND METHODS
Cell Culture and DifferentiationCells from the embryonic fibroblast mouse cell line 3T3-L1 were grown in Dulbecco’s modified eagle medium (DMEM) (Sigma-Aldrich, St. Louis, MO, U.S.A.) supplemented with 10% calf serum and 1% penicillin/streptomycin solution (AGC Techno Glass Co., LTD., Shizuoka, Japan) as described previously.10–12) Two days after the cells reached confluence, the medium was changed to DMEM containing 10% fetal bovine serum (FBS), 1% penicillin/streptomycin, 5 µg/mL insulin (FUJIFILM Wako Pure Chemical Corporation, Osaka, Japan), 500 µM isobutylmethylxanthine (IBMX; Sigma-Aldrich) and 1 µM dexamethasone (Sigma-Aldrich). After three days, the medium was replaced with DMEM containing 10% FBS, 1% penicillin/streptomycin, and 5 µg/mL insulin. The medium was changed every two days until differentiation was observed after 8 d.
Total RNA Isolation and Real-Time PCRTotal RNA was isolated using the ISOGENE II (Nippon Gene, Tokyo, Japan), and cDNA was synthesized from 1 µg total RNA using a High Capacity cDNA Reverse Transcription Kit (Applied Biosystems, Waltham, MA, U.S.A.) as described previously.13) The resulting cDNA was used for a quantitative real-time PCR (qPCR) using a SYBR Select Master Mix (Thermo Fisher Scientific, Waltham, MA, U.S.A.) and a 7500 Fast Real-Time PCR System (Applied Biosystems). Real-time PCR was performed in triplicate and the relative mRNA expression levels were normalized to the corresponding 18s ribosomal RNA (18s rRNA) level using the ∆∆Ct method. The sequences of the PCR primers are described in Table 1.
Table 1. Primer Pair Used for Real-Time PCR
| Gene name | Primer sequence |
|---|
| PAF-AH I α1 | Forward: 5′-AACCCACTTCGAGAGAAAAACC-3′ |
| Reverse: 5′-CCATCAGAATGCACAAACCCA-3′ |
| PAF-AH I α2 | Forward: 5′-GCAGCTATTCCACATGCCG-3′ |
| Reverse: 5′-CCGCCATATCTCGTACTGCT-3′ |
| PAF-AH I β | Forward: 5′-TGGCTTCCTGTTCAGCAGATA-3′ |
| Reverse: 5′-TGACCGTGCATGGTTCTGATG-3′ |
| PAF-AH II | Forward: 5′-GGAGGGTCACAGTCTTGAGG-3′ |
| Reverse: 5′-CCCATGCTGTACTCGTAGCG-3′ |
| C/EBPα | Forward: 5′-AGCAACGAGTACCGGGTACG-3′ |
| Reverse: 5′-TGTTTGGCTTTATCTCGGCTC-3′ |
| C/EBPβ | Forward: 5′-CGCAACACACGTGTAACTGTCA-3′ |
| Reverse: 5′-AACAACCCCGCAGGAACAT-3′ |
| C/EBPδ | Forward: 5′-ATCGCTGCAGCTTCCTATGT-3′ |
| Reverse: 5′-AGTCATGCTTTCCCGTGTTC-3′ |
| PPARγ | Forward: 5′-TGCAGCTCAAGCTGAATCAC-3′ |
| Reverse: 5′-CACGTGCTCTGTGACGATCT-3′ |
| 18s rRNA | Forward: 5′-TAAGTCCCTGCCCTTTGTACACA-3′ |
| Reverse: 5′-GATCCGAGGGCCTCACTAAAC-3′ |
Preparation of cellular proteins and Western blot analysis were performed as described previously.14) Briefly, cells were washed with ice-cold PBS and lysed in RIPA buffer (Nacalai Tesque, Kyoto, Japan). Cells were then scraped off the growth surface using a disposable cell scraper (AGC Techno Glass Co., LTD.) and were centrifuged at 12000 × g for 20 min at 4 °C. The resultant supernatant was recovered, and protein concentrations were measured using the BCA protein assay kit (Thermo Fisher Scientific). Similarly, subcellular fractions (cytoplasmic, membrane and nuclear fractions) were extracted using a subcellular protein fractionation kit (Thermo Fisher Scientific) as described previously.10) Ten micrograms of total cellular proteins were separated by electrophoresis on SuperSep™ Ace 12.5% gels (FUJIFILM Wako Pure Chemical Corporation) and transferred to a polyvinylidene difluoride (PVDF) membrane using i-Blot gel transfer stacks (Invitrogen, Waltham, MA, U.S.A.). The membrane was washed with 0.1% Tween 20 in phosphate-buffered saline (PBST), incubated in blocking buffer (PBST containing 5% nonfat milk) for 1 h, and then reacted overnight at 4 °C with primary antibodies: mouse anti-PAF-AH I α1 (sc-393612; Santa Cruz Biotechnology, Dallas, TX, U.S.A.), rabbit anti-PAF-AH I α2 (PT14729-1-AP; Proteintech, Rosemont, IL, U.S.A.), mouse anti-PAF-AH I β (sc-374586; Santa Cruz Biotechnology), rabbit anti-PAF-AH II (ab199293; Abcam, Cambridge, U.K.), rabbit anti-β-actin (CS#4967; Cell Signaling Technology, Danvers, MA, U.S.A.), rabbit anti-glyceraldehyde-3-phosphate dehydrogenase (GAPDH) (10494-1-AP; Proteintech), mouse anti-N cadherin (ab76057; Abcam) or mouse anti-histone deacetylase-2 (HDAC2) (CS#5113, Cell Signaling Technology). After washing with PBST, the membrane was incubated with horseradish peroxidase (HRP)-labeled goat anti-rabbit immunoglobulin G (IgG) or anti-mouse IgG for 1 h. After washing the membrane with PBST, chemiluminescence was detected using an ECL Prime (GE Healthcare, Milwaukee, WI, U.S.A.) and analyzed with an Amersham Imager 680 (GE Healthcare).
Immunoprecipitation AnalysisThe cells were lysed in 10 mM Tris–HCl (pH 7.5), 100 mM NaCl, 1 mM ethylenediaminetetraacetic acid (EDTA) (TNE buffer), and a protease inhibitor cocktail (Complete mini; Roche, Indianapolis, IN, U.S.A.). The cell lysate was suspended and centrifuged at 12000 × g for 20 min at 4 °C. The resultant supernatant was recovered, and protein concentrations were measured using the BCA protein assay kit. The total cell lysate was incubated with 1 µg mouse anti-PAF-AH I α1 antibody (sc-81950; Santa Cruz Biotechnology) or normal mouse IgG (sc-2025; Santa Cruz Biotechnology) overnight at 4 °C. Then, the samples were incubated with protein G-Sepharose 4 fast flow (GE Healthcare) for 1 h at 4 °C. Immune complexes consisting of antibody and protein G-Sepharose were separated by centrifugation at 12000 × g for 20 min at 4 °C. Precipitated samples were collected, and protein was dissolved with Laemmli sample buffer solution (BIO-RAD, Hercules, CA, U.S.A.) and PAF-AH I α2 protein was detected by Western blot analysis.
Measurement of PAF-AH ActivityPAF-AH activity was measured by the method of Stafforini et al.15) with slight modification as described previously.16,17) After 0, 4, or 8 d of differentiation, the 3T3-L1 cells were scraped from dishes and washed with ice-cold PBS. The washed cells were resuspended and sonicated in 50 mM N-(2-hydroxyethyl)piperazine-N′-2-ethanesulfonic acid (HEPES)-NaOH (pH 7.4), and the sample was centrifuged at 12000 × g for 20 min at 4 °C. The resultant supernatant was recovered, and protein concentrations were measured using a BCA protein assay kit. Fifty microliters of 80 µM 1-O-hexadecyl-2-[3H] acetyl-sn-glycero-3-phosphocholine (2500 dpm/nmol) dissolved in 50 mM HEPES–NaOH (pH 7.4) was combined with 30 µg of samples. The enzymatic reaction was carried out by incubation at 37 °C for 20 min, and the reaction was stopped by adding 50 µL of 10 mM acetic acid, after which samples were cooled on ice. Then, we added 1.5 mL of 100 mM sodium acetate. Tritium-labeled 1-O-hexadecyl-2-[3H]acetyl-sn-glycero-3-phosphocholine was separated on a Sep-Pak C18 cartridge column (Waters). The column was washed twice with 1.5 mL of 100 mM sodium acetate and the eluate containing enzymatic reaction products of tritium-labeled acetic acid was combined with 5 mL of Insta Gel Plus scintillation fluid (Parkin Elmer, Waltham, MA, U.S.A.). The radioactivity was measured by a liquid scintillation counter (LSG-300; Aloka, Tokyo, Japan). The enzyme activity was expressed as nmol PAF hydrolysis per min per mg protein.
Statistical AnalysisResults are expressed as the mean ± standard deviation (S.D.). Significant differences were determined by one-way ANOVA followed by Dunnett’s post hoc test. p < 0.05 was considered statistically significant.
RESULTS
The Efficiency of Differentiation of 3T3-L1 Preadipocytes to AdipocytesWe first characterized the efficiency with which 3T3-L1 cells differentiated by examining the expression of differentiation markers by quantitative real-time PCR analysis. Differentiated 3T3-L1 samples were collected for up to 8 d and analyzed by real-time PCR. The efficiency of differentiation of 3T3-L1 cells was ascertained by the expression of a differentiation marker gene cascade, i.e., CCAAT/enhancer binding protein (C/EBP) α, C/EBPβ, C/EBPδ and peroxisome proliferator-activated receptor (PPAR)γ18,19) (Fig. 1A). In addition, differentiation to adipocytes was ascertained morphologically by identifying the formation of lipid droplets by bright field and oil red O staining (Figs. 1B, C).
PAF-AH I α1 Protein and mRNA Expression Levels Decreased during Adipocyte DifferentiationWe next used Western blot analysis to examine the expression levels of PAF-AH I subunits during 3T3-L1 differentiation. 3T3-L1 cells were exposed to insulin, dexamethasone, and IBMX to induce differentiation. We collected samples for up to 8 d. Relative PAFAH I α1, PAFAH I α2, PAFAH I β, and PAFAH II protein levels were normalized to β-actin levels. Western blot analysis revealed that PAF-AH I α1 protein levels in 3T3-L1 cells markedly decreased 4 d after induction of differentiation. On the other hand, PAF-AH I α2, PAF-AH I β and PAF-AH II protein levels showed a smaller degree of change (Fig. 2).
We next investigated the expression levels of mRNAs coding for PAF-AH I α1, PAF-AH I α2, PAF-AH I β, and PAF-AH II in the early stage of 3T3-L1 differentiation. To determine at what point after differentiation PAF-AH I gene expression decreases, we collected samples for 48 h after differentiation and analyzed cells using real-time PCR. PAF-AH I α1 mRNA expression levels in 3T3-L1 cells were decreased 4 h after induction of differentiation until 48 h (Fig. 3). In contrast to the decrease of PAF-AH I α1, the mRNA expression levels of PAF-AH I α2, PAF-AH I β subunits and PAF-AH II showed no changes during adipocyte differentiation (Fig. 3).
The PAF-AH Enzymatic Activity on the PAF Substrate during Adipocyte DifferentiationWe examined whether the catalytic activity of PAF-AH was altered by the switching of the catalytic complex from α1/α2 heterodimer to α2/α2 homodimer in 3T3-L1 differentiation. 3T3-L1 cells were differentiated, and we collected samples on days 0, 4 and 8. PAF-AH activity toward PAF was not altered during adipocyte differentiation (Fig. 4).
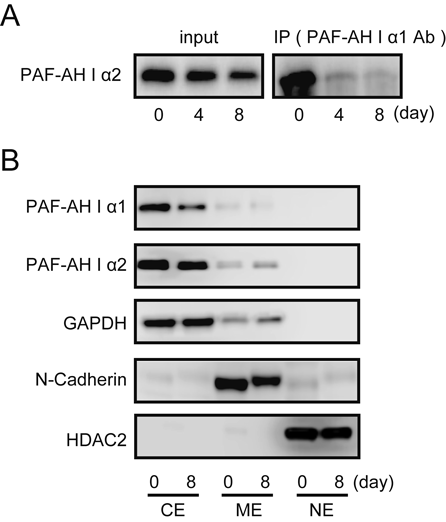
Switching of the PAF-AH I Catalytic Subunits during Adipocyte DifferentiationPrevious reports have shown that switching of the catalytic complex from the α1/α2 heterodimer to the α2/α2 homodimer occurs in rats during the development of the brain.6) Therefore, we used co-immunoprecipitation analysis to examine whether the α1/α2 heterodimer changed to the α2/α2 homodimer in 3T3-L1 differentiation. The PAF-AH I α2 protein was immunoprecipitated with anti-PAF-AH I α1 antibodies at day 0. The PAF-AH I α2 protein was not detected in immunoprecipitated samples on days 4 and 8 (Fig. 5A). These results suggest that the complex of PAF-AH I catalytic subunits was switched from the α1/α2 heterodimer to the α2/α2 homodimer in the differentiation of 3T3-L1 preadipocytes into adipocytes. To clarify the change in the subcellular localization of PAF-AH I α1 and α2 proteins in 3T3-L1 differentiation, we used Western blot analysis of subcellular protein fractions. Both PAF-AH I α1 and α2 proteins were localized in the cytoplasmic fraction and their cellular locations were not changed after differentiation (Fig. 5B).
DISCUSSION
Among the three types of PAF degrading enzymes termed PAF-AHs, the exact physiological role of PAF-AH I remains unclear. However, recent findings have suggested that PAF-AH I is involved in various physiological and pathological functions including brain development,4) spermatogenesis7) and cancer pathogenicity.14) In this study, we examined the expression levels of the PAF-AH I catalytic subunits in adipogenic differentiation of 3T3-L1 using Western blot analysis to elucidate the role of PAF-AHs. We showed that the expression of the PAF-AH I α1 protein was reduced during the early stage of differentiation. In addition, co-immunoprecipitation revealed that the composition of the catalytic subunits of the PAF-AH I complex was changed during 3T3-L1 differentiation by a decrease in the α1/α2 heterodimer and an increase in the α2/α2 homodimer. We suggest that the PAF-AH I complex may not have completely changed and that PAF-AH I catalytic subunits were partially switched from the α1/α2 heterodimer to the α2/α2 homodimer. Previous studies demonstrated that expression of PAF-AH I α1 was relatively limited in the rat fetal brain6) and mouse spermatocytes.7) In this study, we found the PAF-AH I α1 catalytic subunit was also highly expressed in preadipocytic 3T3-L1 cells. Although PAF-AH I α1 decreased during adipocyte differentiation, hydrolytic activity toward PAF was not changed. This fact suggests that the physiological substrates of this enzyme include lipids other than PAF. Manya et al. reported that the α1/α2 heterodimer and the α2/α2 homodimer exhibited different hydrolytic activities using artificially designed phospholipid analogues.20) This report suggested that switching the catalytic subunit of PAF-AH I from the α1/α2 heterodimer to the α2/α2 homodimer causes a significant change in the efficiency of substrate hydrolysis. Therefore, our findings suggest that the switching of PAF-AH I catalytic subunits substantially affects cellular function by changing lipid composition during adipocyte differentiation. Since PAF-AH I α1 protein expression was markedly reduced and switching the catalytic subunit of PAF-AH I by 3T3-L1 differentiation, further investigation is needed to elucidate its physiological function in adipocyte differentiation by use of small interfering RNA (siRNA) and/or clustered regularly interspaced short palindromic repeats CRISPR-associated proteins 9 (CRISPR Cas9) systems.
In conclusion, we found that the α1/α2 heterodimer was switched to the α2/α2 homodimer in PAFAH I catalytic subunits during adipocyte differentiation of 3T3-L1 cells. Elucidation of the physiological substrates in preadipocytes and adipocytes contributes to understanding the significance of switching of PAF-AH I catalytic subunits.
Acknowledgments
We are grateful to Dr. Shinji Yamaguchi, Teikyo University for valuable technical advice. This work was supported by ACRO Incubation Grants of Teikyo University.
Conflict of Interest
The authors declare no conflict of interest.
REFERENCES
- 1) Farr RS, Cox CP, Wardlow ML, Jorgensen R. Preliminary studies of an acid-labile factor (ALF) in human sera that inactivates platelet-activating factor (PAF). Clin. Immunol. Immunopathol., 15, 318–330 (1980).
- 2) Schaloske RH, Dennis EA. The phospholipase A2 superfamily and its group numbering system. Biochim. Biophys. Acta, 1761, 1246–1259 (2006).
- 3) Karasawa K, Inoue K. Overview of PAF-degrading enzymes. Enzymes, 38, 1–22 (2015).
- 4) Hattori M, Arai H, Inoue K. Purification and characterization of bovine brain platelet-activating factor acetylhydrolase. J. Biol. Chem., 268, 18748–18753 (1993).
- 5) Ho YS, Swenson L, Derewenda U, Serre L, Wei Y, Dauter Z, Hattori M, Adachi T, Aoki J, Arai H, Inoue K, Derewenda ZS. Brain acetylhydrolase that inactivates platelet-activating factor is a G-protein-like trimer. Nature, 385, 89–93 (1997).
- 6) Manya H, Aoki J, Watanabe M, Adachi T, Asou H, Inoue Y, Arai H, Inoue K. Switching of platelet-activating factor acetylhydrolase catalytic subunits in developing rat brain. J. Biol. Chem., 273, 18567–18572 (1998).
- 7) Koizumi H, Yamaguchi N, Hattori M, Ishikawa TO, Aoki J, Taketo MM, Inoue K, Arai H. Targeted disruption of intracellular type I platelet activating factor-acetylhydrolase catalytic subunits causes severe impairment in spermatogenesis. J. Biol. Chem., 278, 12489–12494 (2003).
- 8) Karasawa K, Shirakura M, Harada A, Satoh N, Yokoyama K, Setaka M, Inoue K. Red blood cells highly express type I platelet-activating factor-acetylhydrolase (PAF-AH) which consists of the alpha1/alpha2 complex. J. Biochem., 138, 509–517 (2005).
- 9) Nakamura Y, Yoshida M, Tanigawa K, Harada A, Kihara-Negishi F, Maruyama K, Karasawa K. Deficiency of type I platelet-activating factor-acetylhydrolase catalytic subunits causes an increase in body weight. Biol. Pharm. Bull., 44, 920–925 (2021).
- 10) Natori Y, Nasui M, Edo K, Sato S, Sakurai T, Kizaki T, Kihara-Negishi F. NEU1 sialidase controls gene expression and secretion of IL-6 and MCP-1 through NF-κB pathway in 3T3-L1 adipocytes. J. Biochem., 162, 137–143 (2017).
- 11) Natori Y, Nasui M, Kihara-Negishi F. Neu1 sialidase interacts with perilipin 1 on lipid droplets and inhibits lipolysis in 3T3-L1 adipocytes. Genes Cells, 22, 485–492 (2017).
- 12) Natori Y, Ohkura N, Nasui M, Atsumi G, Kihara-Negishi F. Acidic sialidase activity is aberrant in obese and diabetic mice. Biol. Pharm. Bull., 36, 1027–1031 (2013).
- 13) Kihara-Negishi F, Ohkura N, Takahashi Y, Fujita T, Nakamura Y, Maruyama K, Oshitari T, Yamaguchi S. Nobiletin and 3′-demethyl nobiletin activate brown adipocytes upon β-adrenergic stimulation. Biol. Pharm. Bull., 45, 528–533 (2022).
- 14) Tanigawa K, Kiriya M, Hayashi Y, Shinden Y, Kijima Y, Natsugoe S, Sumimoto T, Morimoto-Kamata R, Yui S, Hama K, Yokoyama K, Nakamura Y, Suzuki K, Nojiri H, Inoue K, Karasawa K. Cathepsin G-induced malignant progression of MCF-7 cells involves suppression of PAF signaling through induced expression of PAFAH1B2. Biochim. Biophys. Acta Mol. Cell Biol. Lipids, 1867, 159164 (2022).
- 15) Stafforini DM, McIntyre TM, Carter ME, Prescott SM. Human plasma platelet-activating factor acetylhydrolase. Association with lipoprotein particles and role in the degradation of platelet-activating factor. J. Biol. Chem., 262, 4215–4222 (1987).
- 16) Karasawa K, Kato H, Setaka M, Nojima S. Accumulation of platelet-activating factor acetylhydrolase in the peritoneal cavity of guinea pig after endotoxin shock. J. Biochem., 116, 368–373 (1994).
- 17) Karasawa K, Yato M, Setaka M, Nojima S. Purification and characterization of platelet-activating factor acetylhydrolase from peritoneal fluid obtained from guinea pigs after endotoxin shock. J. Biochem., 116, 374–379 (1994).
- 18) Tang QQ, Lane MD. Activation and centromeric localization of CCAAT/enhancer-binding proteins during the mitotic clonal expansion of adipocyte differentiation. Genes Dev., 13, 2231–2241 (1999).
- 19) Guo L, Li X, Tang QQ. Transcriptional regulation of adipocyte differentiation: a central role for CCAAT/enhancer-binding protein (C/EBP) β. J. Biochem., 290, 755–761 (2015).
- 20) Manya H, Aoki J, Kato H, Ishii J, Hino S, Arai H, Inoue K. Biochemical characterization of various catalytic complexes of the brain platelet-activating factor acetylhydrolase. J. Biol. Chem., 274, 31827–31832 (1999).