Regular Articles
Comparison of Addition of Indications for Antineoplastic Agents Approved in the United States and Japan from 2001 to 2020
2023 Volume 46 Issue 7 Pages 987-996
Details
2023 Volume 46 Issue 7 Pages 987-996
The indications for antineoplastic agents are limited in Japan compared with those in the United States. This may be because it takes longer to add indications and the number of additions of indications is lower in Japan than in the United States. To clarify the differences in the timing and number of additions of indications for antineoplastic agents, the agents approved from 2001 to 2020 and sold as of the end of 2020 in Japan and the United States were identified and their additions of indications were compared. Of the 81 antineoplastic agents analyzed, the proportion of agents with additional indications was 71.6 and 63.0%, and the number of additions of indications (median/average per agent) was 2/3.52 and 1/2.43, for the United States and Japan, respectively. The median date of approval for addition of indications was August 10, 2017 and July 3, 2018 for the United States and Japan (p = 0.015), indicating that the indications were added earlier in the United States. The proportion of priority review and orphan drug designation for addition of indications was lower in Japan (55.6 and 34.7%) than in the United States (80.9 and 57.8%) (p < 0.001). When indications were developed with global clinical trials or designated as orphan drugs in the United States, delays in application and approval in Japan against the United States were small (p < 0.020). New indications for antineoplastic agents should be added promptly for Japanese patients because malignancy is the leading cause of death in Japan.
Malignancy is the leading cause of death in Japan,1) and the second leading cause of death after cardiovascular disease in the United States and Europe.2,3) Therefore, therapeutic options for malignant tumors are important, and antineoplastic agents are one of the most common types of new drugs developed in Japan, the United States, and Europe in the last 20 years.4) However, the options for antineoplastic agents are limited in Japan compared with the United States. We previously compared the indications for new drugs approved in Japan, the United States, and Europe from 2001 to 2020 and reported that the indications for antineoplastic agents were limited in Japan and Europe compared with the United States.4) In other words, access to the treatment opportunities is limited in Japan compared with the United States even if the same antineoplastic agents are on the market. This may be because it takes longer to add indications and the number of additions of indications is lower in Japan than in the United States.
Many studies have compared the timing of drug approval among specific regions (i.e., studies for drug lag) and reported the lag for anticancer drugs in the United States and Japan.5–13) However, studies on anticancer drug lag in the United States and Japan have focused primarily on the differences in the initial approval dates and excluded additional indications from the analysis.5–7) Although some studies have included additional indications in the analysis, the difference in the approval dates were compared by combining the initial and additional indications and the number of additions of indications in each country was not compared.8–13) Therefore, no study has focused on the addition of indications for antineoplastic agents in the United States and Japan, and the detail of addition of indications has not been analyzed.
It should be useful to compare the addition of indications for antineoplastic agents in the United States and Japan. The addition of indications is important, as it provides patients with new treatment options. In addition, a previous study has reported that anticancer drugs undergo many additional indications.14) Therefore, understanding the process of addition of indications as well as initial approvals is important when considering antineoplastic options. Moreover, assuming that additional indications will be added over time after the initial approval, a long-term investigation period will enable meaningful comparisons of the process of adding indications. Furthermore, many application documents providing quality, non-clinical, and clinical data are submitted to achieve initial approval for new drugs, while more limited documents (e.g., only clinical data) may be submitted to achieve supplemental approval for addition of indications. Thus, the days required for application preparation and approval review might vary between the initial and supplemental approval. Based on these unique characteristics of addition of indications, those for antineoplastic agents in the United States and Japan should be compared over a long period.
This study aimed to clarify the difference in the timing and number of additions of indications for antineoplastic agents in the United States and Japan. Therefore, we compared the addition of indications for antineoplastic agents approved in these countries in the past 20 years.
The antineoplastic agents [defined as WHO Anatomical Therapeutic Chemical (ATC) classification,15) L01] with new active substances newly approved both in the United States and Japan from 2001 to 2020 and sold in these two countries as of the end of 2020 were included for analysis. Antineoplastic agents newly approved before 2001 and approved for additional oncology indications from 2001 to 2020, agents approved only in the United States or Japan, and drugs classified as both L01 and other than L01 with non-oncology indications were excluded from the analysis. Only original prescription drugs were included, while generics and biosimilars were excluded from the study (Fig. 1).

a) Identified from the approved item database published by the Japan Pharmaceutical Manufacturers Association.
The antineoplastic agents (ATC classification,15) L01) newly approved in Japan from 2001 to 2020 were identified from the approved item database published by the Japan Pharmaceutical Manufacturers Association.16) For these agents, the initial approval (original/first approval of the product) date and marketing status in each country as of the end of 2020 was identified from the websites of the Pharmaceuticals and Medical Devices Agency (PMDA)17) in Japan and the Food and Drug Administration (FDA)18) in the Unites States, and the agents for the analysis were identified. Information regarding the generic name, biologics/non-biologics, ATC classification, corporate attributes (Japanese/non-Japanese), and date of application and approval for addition of indications were collected.15–18) In addition, information regarding orphan drug designation, priority review, SAKIGAKE designation, conditional early approval,17) and development request from the Evaluation Committee on Unapproved or Off-labeled Drugs with High Medical Needs19) in Japan, and orphan drug designation,20) priority review, breakthrough therapy designation, fast track designation, and accelerated approval21) in the Unites States were collected. Furthermore, data on the development strategies in Japan (bridging development/global development/no clinical trial data in Japanese patients for the indication)17) were also collected for addition of indications common to the United States and Japan.
Assessment of Addition of IndicationsIn this study, the definition of addition of indication included addition of new diseases (cancer types), treatment lines (first-line, second-line, third or later lines, adjuvant treatment, neo-adjuvant treatment, and maintenance treatment), and monotherapy or combination therapy regimens. Information regarding the addition of these new indications was collected per approval application in each country. The addition of new dosages (lower or higher dose), administrations (frequency, duration, or route), dosage forms, special populations (e.g., pediatric patients, patients with decreased hepatic or renal function), the same indication for different dosage forms, conversion from accelerated approval to traditional approval, and the other approvals for changes to drug package inserts (additions, changes, or rearrangements of descriptions of the efficacy, safety, clinical pharmacology, non-clinical, or quality sections) were excluded.
The proportion of agents with addition of indications, number of additions of indications, proportion of background characteristics, and distribution of approval dates for the addition of indications in each country were compared. The approval date for each addition of indication was replaced with Day X, defined as Day 1 = January 1, 2001 and Day 7305 = December 31, 2020 for the comparison of those distributions. If multiple indications were included in one approval application, the number of additions of indications was counted as one.
For addition of indications common to the United States and Japan, the indications for a same agent were matched between the United States and Japan by investigating indicated diseases (cancer types), treatment lines and monotherapy or combination therapy regimens, as well as the clinical trials supporting those indications in the drug package inserts and regulatory agency’s review reports. If these were different in the two countries, those indications were excluded from the analysis for the addition of indications common to the United States and Japan. Then, the days of application lag (calculated by subtracting the application date in the United States from the application date in Japan), review lag (calculated by subtracting the review days in the United States from the review days in Japan), and approval lag (calculated by subtracting the approval date in the United States from the approval date in Japan) were calculated, and subgroup comparisons according to the background characteristics were performed. The review days were calculated by subtracting the application date from the approval date in each country.
Statistical AnalysisDescriptive statistics analyses were performed for the number of additions of indications in each country using Microsoft Excel 2019. Fisher’s exact test was used to assess the differences in proportions, the Kruskal–Wallis rank sum test or Mann–Whitney U test was used to assess the differences in the distribution of approval dates and lag for application, review, and approval, and a multiple regression analysis and backward/forward stepwise selection according to Akaike’s Information Criterion (AIC) were used to assess the independent factors associated with shortening application and approval lags, using EZR (Saitama Medical Center, Jichi Medical University, Saitama, Japan), a graphical user interface for R (The R Foundation for Statistical Computing, Vienna, Austria).22) p-Values <0.05 were considered statistically significant.
A total of 81 antineoplastic agents were newly approved both in the United States and Japan from 2001 to 2020 and sold in these two countries as of the end of 2020 (Fig. 1). The most common ATC classification third level was L01E (protein kinase inhibitors) at 45.7%, followed by L01F (monoclonal antibodies and antibodies drug conjugates) at 27.2% (Table 1). Approximately 71.6% of the agents were non-biologics and 74.1% of the agents came from non-Japanese companies (Table 1). The proportion of priority review and orphan drug designation for initial approval (original/first approval of the product) tended to be lower in Japan (77.8 and 54.3%, respectively) than in the United States (85.2 and 70.4%, respectively), but the difference was not statistically significant (Table 2). The proportion of the other regulatory programs also tended to be lower in Japan than in the United States (Table 2). The median (interquartile range, IQR) initial approval date (Day X) was 4532 (3189–5441) in the United States and 5297 (4107–6114) in Japan (p = 0.007), indicating that initial approval occurred earlier in the United States (Table 2). The distribution of approval years showed a similar trend (Fig. 2). The total number of indicated diseases (cancer types) as of the end of 2020 tended to be lower in Japan (157) than in the United States (183) (Fig. 3).
| Biologics/non-biologics | N | % |
|---|---|---|
| Biologics | 23 | 28.4 |
| Non-biologics | 58 | 71.6 |
| Anatomical therapeutic chemical classification 3rd level | N | % |
| L01A (alkylating agents) | 1 | 1.2 |
| L01B (antimetabolites) | 6 | 7.4 |
| L01C (plant alkaloids and other natural products) | 2 | 2.5 |
| L01E (protein kinase inhibitors) | 37 | 45.7 |
| L01F (monoclonal antibodies and antibodies drug conjugates) | 22 | 27.2 |
| L01X (other antineoplastic agents) | 13 | 16.0 |
| Corporate attributes | N | % |
| Japanese | 21 | 25.9 |
| Non-Japanese | 60 | 74.1 |
The characteristics of the 81 antineoplastic agents were classified by biologics/non-biologics, WHO ATC classification 3rd level, and corporate attributes (Japanese/non-Japanese) based on the approved item database published by the Japan Pharmaceutical Manufacturers Association.
| Regulatory programs for initial approvals | United States (N = 81) | Japan (N = 81) | p-Valuea) | ||
|---|---|---|---|---|---|
| n | % | n | % | ||
| Priority review | 69 | 85.2 | 63 | 77.8 | 0.312 |
| Orphan drug designation | 57 | 70.4 | 44 | 54.3 | 0.051 |
| Breakthrough therapy designation | 25 | 30.9 | — | — | — |
| Accelerated approval | 35 | 43.2 | — | — | — |
| Fast track designation | 36 | 44.4 | — | — | — |
| Request from evaluation committee on unapproved or off-labeled drugs | — | — | 7 | 8.6 | — |
| Sakigake designation | — | — | 2 | 2.5 | — |
| Conditional early approval | — | — | 2 | 2.5 | — |
| Distribution of approval dates (Day X) for initial approvals | United States (N = 81) | Japan (N = 81) | p-Valueb) | ||
| Median (IQR) | 4532 (3189–5441) | 5297 (4107–6114) | 0.007 | ||
The regulatory programs and distribution of the approval dates (Day X defined as Day 1 = January 1, 2001 and Day 7305 = December 31, 2020) [median (interquartile range, IQR)] in each country for the initial approvals (original/first approval of the product) for the 81 antineoplastic agents are summarized. N: number of antineoplastic agents in the analysis, n: number of antineoplastic agents in the category, a) Fisher’s exact test, b) Mann–Whitney U test.

Distribution of initial approval (original/first approval of the product) year for the 81 antineoplastic agents approved in the United States and Japan from 2001 to 2020 is summarized.

The total number of indicated diseases (cancer types) as of the end of 2020 for the 81 antineoplastic agents approved in the United States and Japan from 2001 to 2020 is summarized.
The proportion of agents with addition of indications was 71.6% in the United States and 63.0% in Japan, and the number of additions of indications (median/average per agent) was 2/3.52 in the United States and 1/2.43 in Japan, both of which tended to be lower in Japan (Table 3). The proportion of priority review and orphan drug designation for addition of indications was significantly lower in Japan (55.6 and 34.7%, respectively) than in the United States (80.9 and 57.8%, respectively) (p < 0.001) (Table 3). The proportion of the other regulatory programs also tended to be lower in Japan than in the United States (Table 3). The median (IQR) approval date (Day X) for addition of indications was 6065 (5092–6677) in the United States and 6392 (5422–6928) in Japan (p = 0.015), indicating that additional indications were approved earlier in the United States (Table 3). The distribution of approval years showed a similar trend (Fig. 4).
| Antineoplastic agents with addition of indications | United States (N = 81) | Japan (N = 81) | p-Valuea) | ||
|---|---|---|---|---|---|
| n | % | n | % | ||
| Yes | 58 | 71.6 | 51 | 63.0 | 0.315 |
| No | 23 | 28.4 | 30 | 37.0 | |
| Number of additions of indications | United States (N = 58) | Japan (N = 51) | |||
| Median (IQR) per agent | 2 (1–4) | 1 (1–3) | — | ||
| Average per agent | 3.52 | 2.43 | |||
| Total | 204 | 124 | |||
| Regulatory programs for addition of indications | United States (M = 204) | Japan (M = 124) | p-Valuea) | ||
| m | % | m | % | ||
| Priority review | 165 | 80.9 | 69 | 55.6 | <0.001 |
| Orphan drug designation | 118 | 57.8 | 43 | 34.7 | <0.001 |
| Breakthrough therapy designation | 56 | 27.5 | — | — | — |
| Accelerated approval | 50 | 24.5 | — | — | — |
| Fast track designation | 15 | 7.4 | — | — | — |
| Request from evaluation committee on unapproved or off-labeled drugs | — | — | 18 | 14.5 | — |
| Sakigake designation | — | — | 1 | 0.8 | — |
| Conditional early approval | — | — | 1 | 0.8 | — |
| Distribution of approval dates (Day X) for addition of indications | United States (M = 204) | Japan (M = 124) | p-Valueb) | ||
| Median (IQR) | 6065 (5092–6677) | 6392 (5422–6928) | 0.015 | ||
The number of antineoplastic agents with or without addition of indications, number of additions of indications, regulatory programs, and distribution of approval dates (Day X defined as Day 1 = January 1, 2001 and Day 7305 = December 31, 2020) [median (interquartile range, IQR)] are summarized. N: number of antineoplastic agents in the analysis, n: number of antineoplastic agents in the category, M: number of additions of indications in the analysis, m: number of additions of indications in the category. a) Fisher’s exact test. b) Mann–Whitney U test.

Distribution of approval year for the number of additions of indications in the United State and Japan from 2001 to 2020 is summarized.
The proportion of agents with addition of diseases (cancer types) was similar in the United States (43.2%) and Japan (45.7%), but the number of additions of diseases (cancer types) (median/average per agent) tended to be lower in Japan (1/1.95) than in the United States (2/2.83) (Table 4). The proportion of priority review and orphan drug designation for addition of diseases (cancer types) was significantly lower in Japan (61.1 and 31.9%, respectively) than in the United States (83.8 and 59.6%, respectively) (p = 0.001 and p < 0.001, respectively) (Table 4). The proportion of the other regulatory programs also tended to be lower in Japan than in the United States (Table 4). The median (IQR) approval date (Day X) for addition of diseases (cancer types) was 6058 (5090–6706) in the United States and 6247 (5265–6928) in Japan, indicating that new diseases (cancer types) tended to be added earlier in the United States (Table 4). The distribution of approval years showed a similar trend (Fig. 5).
| Antineoplastic agents with addition of diseases (cancer types) | United States (N = 81) | Japan (N = 81) | p-Valuea) | ||
|---|---|---|---|---|---|
| n | % | n | % | ||
| Yes | 35 | 43.2 | 37 | 45.7 | 0.874 |
| No | 46 | 56.8 | 44 | 54.3 | |
| Number of additions of diseases (cancer types) | United States (N = 35) | Japan (N = 37) | |||
| Median (IQR) per agent | 2 (1–3) | 1 (1–2) | — | ||
| Average per agent | 2.83 | 1.95 | |||
| Total | 99 | 72 | |||
| Regulatory programs for addition of diseases (cancer types) | United States (M = 99) | Japan (M = 72) | p-Valuea) | ||
| m | % | m | % | ||
| Priority review | 83 | 83.8 | 44 | 61.1 | 0.001 |
| Orphan drug designation | 59 | 59.6 | 23 | 31.9 | <0.001 |
| Breakthrough therapy designation | 34 | 34.3 | — | — | — |
| Accelerated approval | 31 | 31.3 | — | — | — |
| Fast track designation | 8 | 8.1 | — | — | — |
| Request from evaluation committee on unapproved or off-labeled drugs | — | — | 15 | 20.8 | — |
| Sakigake designation | — | — | 1 | 1.4 | — |
| Conditional early approval | — | — | 1 | 1.4 | — |
| Distribution of approval dates (Day X) for addition of diseases (cancer types) | United States (M = 99) | Japan (M = 72) | p-Valueb) | ||
| Median (IQR) | 6058 (5090–6706) | 6247 (5265–6928) | 0.201 | ||
The number of antineoplastic agents with or without addition of diseases (cancer types), number of additions of diseases, regulatory programs, and distribution of approval dates (Day X defined as Day 1 = January 1, 2001 and Day 7305 = December 31, 2020) [median (interquartile range, IQR)] are summarized. N: number of antineoplastic agents in the analysis, n: number of antineoplastic agents in the category, M: number of additions of diseases in the analysis, m: number of additions of diseases in the category. a) Fisher’s exact test. b) Mann–Whitney U test.
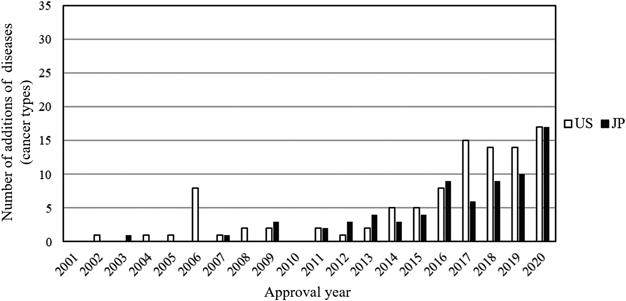
Distribution of approval year for the number of additions of diseases (cancer types) in the United State and Japan from 2001 to 2020 is summarized.
A total of 74 addition of indications were common to the United States and Japan. The most common ATC classification third level was L01F (monoclonal antibodies and antibodies drug conjugates) at 48.6%, followed by L01E (protein kinase inhibitors) at 37.8% (Table 5). Approximately 51.4% of addition of indications were for non-biologics and 77.0% of addition of indications came from non-Japanese companies (Table 5). The proportion of priority review and orphan drug designation for addition of indications was significantly lower in Japan (56.8 and 32.4%, respectively) than in the United States (82.4 and 56.8%, respectively) (p < 0.01) (Table 6). The proportion of the other regulatory programs also tended to be lower in Japan than in the United States (Table 6). The median (IQR) approval date (Day X) for addition of indications was 6254 (5088–6675) in the United States and 6417 (5559–6991) in Japan (p = 0.044), indicating that additional indications were approved earlier in the United States (Table 6).
| Biologics/non-biologics | N | % |
|---|---|---|
| Biologics | 36 | 48.6 |
| Non-biologics | 38 | 51.4 |
| Anatomical Therapeutic Chemical Classification 3rd Level | N | % |
| L01B (antimetabolites) | 1 | 1.4 |
| L01E (protein kinase inhibitors) | 28 | 37.8 |
| L01F (monoclonal antibodies and antibodies drug conjugates) | 36 | 48.6 |
| L01X (other antineoplastic agents) | 9 | 12.2 |
| Corporate attributes | N | % |
| Japanese | 17 | 23.0 |
| Non-Japanese | 57 | 77.0 |
The characteristics of the 74 addition of indications common to the United States and Japan were classified by biologics/non-biologics, WHO ATC classification 3rd level, corporate attributes (Japanese/non-Japanese) based on the approved item database published by the Japan Pharmaceutical Manufacturers Association. The additions of indications that 1) were not applied or approved in one country, 2) were initially indicated in one country, or 3) had a single indication in one country and multiple indications in the other country included in one application were excluded from this analysis.
| Regulatory programs for addition of indications | United States (N = 74) | Japan (N = 74) | p-Valuea) | ||
|---|---|---|---|---|---|
| n | % | n | % | ||
| Priority review | 61 | 82.4 | 42 | 56.8 | 0.001 |
| Orphan drug designation | 42 | 56.8 | 24 | 32.4 | 0.005 |
| Breakthrough therapy designation | 23 | 31.1 | — | — | — |
| Accelerated approval | 12 | 16.2 | — | — | — |
| Fast track designation | 6 | 8.1 | — | — | — |
| Request from evaluation committee on unapproved or off-labeled drugs | — | — | 7 | 9.5 | — |
| Sakigake designation | — | — | 0 | 0.0 | — |
| Conditional early approval | — | — | 0 | 0.0 | — |
| Distribution of approval dates (Day X) for addition of indications | United States (N = 74) | Japan (N = 74) | p-Valueb) | ||
| Median (IQR) | 6254 (5088–6675) | 6417 (5559–6991) | 0.044 | ||
The regulatory programs and distribution of approval dates (Day X defined as Day 1 = January 1, 2001 and Day 7305 = December 31, 2020) [median (interquartile range, IQR)] in each country for the 74 addition of indications common to the United States and Japan are summarized. The additions of indications that 1) were not applied or approved in one country, 2) were initially indicated in one country, or 3) had a single indication in one country and multiple indications in the other country included in one application were excluded from this analysis. N: number of additions of indications in the analysis, n: number of additions of indications in the category, a) Fisher’s exact test, b) Mann–Whitney U test.
The median (IQR) lag of the 74 addition of indications common to the United States and Japan was 91 (39–373) days for application, 102 (59–155) days for review, and 220 (127–475) days for approval (Table 7). The dates of application and approval were later and the review period was longer in Japan than in the United States for more than 90% of the 74 addition of indications (Table 7).
| Median lags (IQR) and % (n/N) > 0 | ||||||
|---|---|---|---|---|---|---|
| Addition of indications in the analysis (N) | Application | % (n/N) > 0 | Review | % (n/N) > 0 | Approval | % (n/N) > 0 |
| All (74) | 91 (39–373) | 93.2 (69/74) | 102 (59–155) | 94.6 (70/74) | 220 (127–475) | 90.5 (67/74) |
| Median lags (IQR) and p-Values | ||||||
| Biologics/non-biologics (n) | Application | p-Value | Review | p-Value | Approval | p-Value |
| Biologics (36) | 88 (40–280) | 0.991a) | 136 (82–163) | 0.140a) | 209 (143–473) | 0.837a) |
| Non-biologics (38) | 95 (22–382) | 94 (46–137) | 225 (108–474) | |||
| ATC Classification 3rd level (n) | Application | p-Value | Review | p-Value | Approval | p-Value |
| L01B (antimetabolites) (1) | −7 (−7–−7) | 0.273b) | 188 (188–188) | 0.187b) | 181 (181–181) | 0.810b) |
| L01E (protein kinase inhibitors) (28) | 83 (17–363) | 94 (46–141) | 220 (98–468) | |||
| L01F (antibodies and drug conjugates) (36) | 88 (40–280) | 136 (82–163) | 209 (143–473) | |||
| L01X (other antineoplastic agents) (9) | 200 (79–400) | 88 (35–119) | 231 (181–483) | |||
| Corporate attributes (n) | Application | p-Value | Review | p-Value | Approval | p-Value |
| Japanese (17) | 86 (17–400) | 0.563a) | 94 (36–151) | 0.456a) | 196 (134–483) | 0.772a) |
| Non-Japanese (57) | 92 (40–328) | 105 (63–156) | 221 (125–472) | |||
| Priority review in Japan (n) | Application | p-Value | Review | p-Value | Approval | p-Value |
| Yes (42) | 91 (31–325) | 0.896a) | 85 (46–111) | 0.001a) | 192 (119–444) | 0.211a) |
| No (32) | 85 (39–461) | 143 (101–170) | 226 (185–587) | |||
| Orphan drug designation in Japan (n) | Application | p-Value | Review | p-Value | Approval | p-Value |
| Yes (24) | 88 (39–352) | 0.720a) | 91 (62–130) | 0.265a) | 242 (144–454) | 0.972a) |
| No (50) | 94 (37–343) | 118 (57–162) | 220 (127–532) | |||
| Request from evaluation committee in Japan (n) | Application | p-Value | Review | p-Value | Approval | p-Value |
| Yes (7) | 1241 (793–1740) | <0.001a) | 108 (73–133) | 0.744a) | 1312 (915–2009) | <0.001a) |
| No (67) | 79 (32–219) | 102 (58–156) | 196 (122–372) | |||
| Development strategy in Japan (n) | Application | p-Value | Review | p-Value | Approval | p-Value |
| Global (50) | 50 (30–97) | <0.001b) | 98 (60–151) | 0.744b) | 185 (119–231) | <0.001b) |
| Bridging (15) | 511 (167–883) | 130 (65–163) | 556 (323–1022) | |||
| No Japanese data (9) | 784 (671–1877) | 88 (35–137) | 935 (808–1592) | |||
| Global vs. Bridging | — | 0.003a) | — | 0.559a) | — | <0.001a) |
| Global vs. no Japanese data | — | <0.001a) | — | 0.696a) | — | <0.001a) |
| Bridging vs. no Japanese data | — | 0.095a) | — | 0.152a) | — | 0.074a) |
| Priority review in the United States (n) | Application | p-Value | Review | p-Value | Approval | p-Value |
| Yes (61) | 86 (40–276) | 0.394a) | 119 (84–159) | <0.001a) | 220 (134–433) | 0.733a) |
| No (13) | 200 (20–1715) | 26 (−29–75) | 395 (39–1750) | |||
| Orphan drug designation in the United States (n) | Application | p-Value | Review | p-Value | Approval | p-Value |
| Yes (42) | 74 (17–241) | 0.015a) | 93 (59–135) | 0.059a) | 183 (108–346) | 0.012a) |
| No (32) | 100 (49–671) | 136 (67–165) | 239 (193–808) | |||
| Breakthrough therapy designation in the United States (n) | Application | p-Value | Review | p-Value | Approval | p-Value |
| Yes (23) | 74 (30–94) | 0.149a) | 102 (59–149) | 0.227a) | 199 (122–274) | 0.262a) |
| No (51) | 99 (39–491) | 105 (71–176) | 221 (164–553) | |||
| Accelerated approval in the United States (n) | Application | p-Value | Review | p-Value | Approval | p-Value |
| Yes (12) | 571 (96–769) | 0.018a) | 138 (89–153) | 0.291a) | 669 (223–926) | 0.005a) |
| No (62) | 78 (30–241) | 98 (48–155) | 196 (119–391) | |||
| Fast track designation in the United States (n) | Application | p-Value | Review | p-Value | Approval | p-Value |
| Yes (6) | 49 (43–76) | 0.280a) | 99 (60–136) | 0.685a) | 180 (122–185) | 0.163a) |
| No (68) | 91 (38–394) | 102 (59–156) | 221 (127–495) | |||
Each lag was calculated by subtracting the date or days in the United States from the date or days in Japan. The additions of indications that 1) were not applied or approved in one country, 2) were initially indicated in one country, or 3) had a single indication in one country and multiple indications in the other country included in one application were excluded from this analysis. N: number of additions of indications in the analysis, n: number of additions of indications in the category, a) Mann–Whitney U test. b) Kruskal–Wallis rank sum test.
The application lag was significantly shorter for cases where the development strategy in Japan was global development and for cases where the agent was designated as an orphan drug in the United States. In contrast, the application lag was significantly longer for cases with a development request from the Evaluation Committee on Unapproved or Off-labeled Drugs with High Medical Needs in Japan and for cases granted accelerated approval in the United States (p < 0.020) (Table 7).
The review lag was significantly shorter for cases with priority review in Japan and significantly longer for cases with priority review in the United States (p < 0.010) (Table 7).
The approval lag was significantly shorter for cases where the development strategy in Japan was global development and for cases where the agent was designated as an orphan drug in the United States. In contrast, the approval lag was significantly longer for cases with a development request from the Evaluation Committee on Unapproved or Off-labeled Drugs with High Medical Needs in Japan and for cases granted accelerated approval in the United States (p < 0.020) (Table 7).
Factors Associated with Shortening Application and Approval Lags in Addition of Indications Common to the United States and JapanThe relationship between the development strategy in Japan (global) and orphan drug designation in the United States, which were both associated with shortening application and approval lags in the addition of indications common to the United States and Japan, was assessed to clarify whether these factors were independent. A multiple regression analysis and backward/forward stepwise selection according to AIC indicated that these two factors were selected as independent variables for these lags with a variance inflation factor (VIF) 1.047 (Table 8).
| Application lags | ||||
|---|---|---|---|---|
| N = 74, adjusted R-squared = 0.3896, AIC = 906.9, intercept = 876.7, VIF = 1.047 | ||||
| Variables | Coefficient (d) | SE | t-Value | p-Value |
| Development strategy in Japan: Global | −727.0 | 114.2 | −6.368 | < 0.001 |
| Orphan drug designation in the United States: Yes | −153.9 | 107.9 | −1.426 | 0.158 |
| Approval lags | ||||
| N = 74, adjusted R-squared = 0.4098, AIC = 905.5, intercept = 1010.3, VIF = 1.047 | ||||
| Variables | Coefficient (d) | SE | t-Value | p-Value |
| Development strategy in Japan: Global | −730.0 | 113.1 | −6.555 | < 0.001 |
| Orphan drug designation in the United States: Yes | −201.1 | 106.9 | −1.881 | 0.064 |
A multiple regression analysis and backward/forward stepwise selection according to AIC were conducted by using application or approval lags (d) as objective variables, and development strategy in Japan (Global/Bridging and no Japanese data) and orphan drug designation in the United States (Yes/No) as explanatory variables. AIC: Akaike’s Information Criterion, SE: Standard error, VIF: variance inflation factor.
This study showed that additional indications were approved later and the number of additions of indications was lower for antineoplastic agents in Japan than in the United States. New indications for antineoplastic agents for Japanese patients should be added promptly because more than one in four people (26.5%) die from malignancy in Japan.1)
The number of additions of indications increased beginning around 2014 in both the United States and Japan. However, the number of additions of indications began to increase in the United States earlier (2014) than that in Japan (2015), and the number of additions of indications was higher in the United States than in Japan in most years (Figs. 4, 5). As the number of additions of indications for antineoplastic agents has increased over the past several years, the trends of additional indications and whether the necessary indications for Japanese patients are being developed should be carefully monitored.
The proportion of agents with addition of diseases (cancer types) was similar in the United States (43.2%) and Japan (45.7%), but the number of additions of diseases (cancer types) (median/average per agent) tended to be lower in Japan (1/1.95) than in the United States (2/2.83), and the approval of addition of diseases (cancer types) tended to occur earlier in the United States (Table 4). These factors likely affected the total number of indicated diseases (cancer types) in each country as of the end of 2020 (183 for the United States and 157 for Japan) (Fig. 3).
The United States and Japan have regulatory programs that promote the research, development and approval of drugs, but the overall proportion of these programs tended to be lower in Japan than in the United States (Tables 2, 3, 4, 6). The proportion of priority review and orphan drug designation was significantly lower for addition of indications in Japan (approximately 60 and 30%) than in the United States (approximately 80 and 60%) (p < 0.01), although the difference in these proportions for initial approval between Japan (77.8% and 54.3%) and the United States (85.2 and 70.4%) was not statistically significant. In addition, although Sakigake (meaning ‘pioneer’ or ‘forerunner’) designation (instituted in 2015) and conditional early approval of drugs (instituted in 2017) are relatively new regulatory programs in Japan,23–26) only two of each for the initial approval and one of each for the addition of indications were used for the antineoplastic agents analyzed in this study. Although the pharmaceutical regulations differ by country, overseas pharmaceutical regulations such as those in the United States should be monitored, and further utilization of regulatory programs that promote the research, development, and approval of pharmaceuticals should be considered in Japan so that necessary indications can be promptly provided to patients in Japan.
In addition, the results indicate that differences in the regulatory programs for promoting development or early approval and the timing of introducing those programs between Japan and the United States may have affected the overall results. However, given the small number of the cases through 2020, the effects of regulatory programs introduced in Japan beginning in 2015 and 2017 may not be fully reflected in this study. As of March 6, 2023, 13 drugs with Sakigake designation have been approved (10 initial approvals for drugs with new active ingredient and 3 supplemental approvals for additional indications).16,17,23) Of these, 7 drugs (5 initial approvals and 2 supplemental approvals) are drugs indicated for the treatment of tumors. Furthermore, 5 drugs have received conditional early approval (4 initial approvals for drugs with new active ingredient and 1 supplemental approval for additional indications).16,17,24) Of these, 4 drugs (3 initial approvals and 1 supplemental approval) are drugs indicated for the treatment of tumors. The current trend indicates that the number of drugs approved through the newly introduced regulatory programs for promoting development or early approval are increasing, particularly for the treatment of cancer. However, the number of cases remains to be limited, especially for additional indications and it is important to further monitor the impacts and potential issues of these programs.
The median lag of the 74 addition of indications common to the United States and Japan was 91 d for application, 102 d for review, and 220 d for approval, and more than 90% of these additions of indications had later dates of application and approval and more days for review in Japan than in the United States (Table 7). The application and approval lags were significantly shorter for cases with the global development strategy in Japan and for cases with the orphan drug designation in the United States. Therefore, additional indications in Japan can be quickly delivered through global development. This result is consistent with previous studies,7,11,13) which reported that global development significantly contributed to the elimination of drug lags. Our study showed that global development was also effective in shortening the application and approval lags when it is focused on the addition of indications for antineoplastic agents. In addition, indications for antineoplastic agents designated as orphan drugs in the United States are expected to reach Japanese patients earlier; thus, such indications should be developed in Japan, as well. Furthermore, conducting global development in Japan and orphan drug designation in the United States were found to be independent factors associated with shortening application and approval lags (Table 8).
In contrast, the application and approval lags were significantly longer for cases with a development request from the Evaluation Committee on Unapproved or Off-labeled Drugs with High Medical Needs in Japan and for cases granted accelerated approval in the United States. However, development requests from the committee were issued for indications for which development had been delayed; therefore, the development request was unlikely to be the cause of the application and approval lags. Rather, necessary indications were likely developed in Japan because of the development requests, and the necessary indications should be developed in a timely manner in Japan before development requests are issued. Accelerated approval in the United States does not use standard endpoints (such as overall survival for antineoplastic agents) for the primary analysis, but rather surrogate endpoints (such as response rate for antineoplastic agents) as indicators of the efficacy. And if a certain level of effectiveness is shown, even if the drug or indication is in the earlier stages of development, it could be accepted for approval review.25–27) Thus, the application and approval lags were longer in Japan because of the earlier application and approval in the United States through this program. These results of this study suggest that the delay in application has an impact on the overall delay in approval of additional indications, and that global development in Japan and orphan drug designation in the United States would contribute to the improvement of these lags.
Finally, the review lag was significantly shorter for cases with the priority review in Japan and significantly longer for cases with the priority review in the United States. However, review period was longer in Japan than in the United States even in the cases with the priority review in Japan because the median lags (IQR) for the review were 85 (46–111) days. In this study, the review lag was calculated by subtracting the review days in the United States from the review days in Japan. If the review lag shows a value greater than zero, it means that the review period is longer in Japan. In the United States, the FDA is in charge of both review and approval, whereas in Japan, the PMDA is in charge of review and the Ministry of Health, Labor and Welfare (MHLW) is in charge of approval. The difference in organization/procedures between the two countries may have an impact on the time required for review, considering that PMDA and MHLW have been working hard on the reviews and approvals. It should also be noted that the scope of priority review products is not same between the two countries.28,29)
For the addition of indications common to the United States and Japan, the indications for a same agent were matched between two countries. Generally, the degree of granularity in describing indications in the drug package inserts is sometimes different between the two countries; the descriptions tend to be more detailed in the United States based on the conducted clinical trials, while more concise in Japan. However, it could be distinguished whether the differences were due to granularity by investigating the drug package inserts and review reports because it could be identified what indications (e.g., cancer types, treatment lines and monotherapy or combination therapy regimens) were added based on which clinical trials (e.g., same global clinical trials, clinical trials which enrolled same population, or clinical trials which enrolled different population).
This study has two limitations. First, the number of additions of indications analyzed in this study was counted as the number of approvals on each approval application for additional indications, rather than the actual number of indications. Regarding additional indications for new lines of therapy and monotherapy/combination therapy regimens, detailed conditions, which were difficult to translate into the number of indications based on the same criteria, were added in each country. Therefore, number of additions of indications was counted rather than the number of indications. In consideration of this point, we have investigated the indicated diseases (cancer types) as of the end of 2020 (Fig. 3), as well as the addition of diseases (cancer types) (Table 4, Fig. 5), and addition of indications common to the United States and Japan (Tables 5–7). As a result, all these analyses consistently revealed that the number of indicated cancer types and addition of indications is lower and the timing of addition of indications is later in Japan than in the United States. Second, the investigation period from the date of initial approval to the date of approval for addition of indications differed for each antineoplastic agent. Nevertheless, we confirmed that addition of indications occurred later and the number of additions of indications was lower in Japan than in the United States from 2001 to 2020 for the 81 antineoplastic agents analyzed in this study. Moreover, the total number of indicated diseases (cancer types) was lower in Japan (157) than in the United States (183) as of the end of 2020. Thus, this study provided a foundation for future studies on considering measures to increase the number of indications for antineoplastic agents for patients in Japan.
In conclusion, indications were added later and the number of additions of indications was lower for antineoplastic agents in Japan than those in the United States from 2001 to 2020. In addition, the total number of indicated diseases (cancer types) as of the end of 2020 for the 81 antineoplastic agents analyzed in this study was lower in Japan (157) than in the United States (183), which may be due to the longer time required to add indications and the lower number of additions of indications in Japan. Furthermore, the proportion of priority review and orphan drug designation for addition of indications was significantly lower in Japan than in the United States, and the median approval lag of addition of indications common to the United States and Japan was 220 d. As malignancy is the leading cause of death in Japan,1) pharmaceutical companies, regulatory agencies, and medical institutions should work together to enable antineoplastic agents to be promptly approved for new indications necessary for patients in Japan.
Toshiyuki Shizuya is an employee of MSD K.K., but the views expressed in this manuscript are those of the authors and do not necessarily reflect the views of MSD K.K. Seiko Miyazaki has no conflict of interest.