Abstract
Cephaibol A was isolated from a freshwater fungus Acremonium tubakii BMC-58 extract which composed of 16 amino acids and featuring multiple α-aminoisobutyric acid. We investigated the cytotoxicity of cephaibol A on MDA-MB-231 cells to elucidate its potential antitumor activity and mechanism. The study found that cephaibol A concentration-dependently blocked the cell cycle in S phase and inhibited cell proliferation. Meanwhile, cephaibol A could reduce the migration and invasion abilities of MDA-MB-231 cells. Further studies proved that cephaibol A caused mitochondrial dysfunction and increased reactive oxygen species (ROS) accumulation. Mitochondrial membrane potential (ΔΨm) assay suggested that cephaibol A induced apoptosis by affecting Bcl-2, Bax and cytochrome c levels, thus decreasing ΔΨm and activating the caspase cascade reaction. Moreover, cephaibol A significantly inhibited tumor growth and improved survival rates in the MDA-MB-231 cell mice model. These findings established cephaibol A as a potential antitumor agent that inhibited tumor cell proliferation in vitro and in vivo by affecting mitochondrial dysfunction and inducing apoptosis in MDA-MB-231 cells through structural damage.
INTRODUCTION
Breast cancer (BC) is the most common cancer and the second leading cause of death from cancer in women worldwide. According to Cancer Statistics 2023, BC accounted for 31% of female cancers with 297790 estimated new cases and more than 43170 estimated deaths in 2023.1) Based on the expression of estrogen receptor (ER), progesterone receptor (PR) and human epidermal growth factor receptor 2 (HER2), BC has been categorized into three major subtypes, including hormone receptor (HR)-positive, HER2-positive and triple-negative breast cancer (TNBC). Among these, TNBC makes up 15–20% approximately of BC and is associated with more aggressivity and worse prognosis compared to other BC molecular subtypes.2,3) Chemotherapy remains the main treatment for TNBC due to the lack of clear therapeutic targets and insensitivity to traditional endocrine therapy and targeted therapy.4) Therefore, it is crucial to provide novel therapeutic compounds for the effective treatment of TNBC.
Natural products, with high structural diversity and high biochemical specificity, constituting a library of compounds for novel drug development especially in the treatment of cancer.5) Among these, peptaibols are a group of well-studied antimicrobial peptides (AMPs) produced mainly by filamentous fungi, particularly from genera such as Trichoderma, Emericellopsis, Acremonium and Paecilomyces.6–9) Their structures are generally linear, amphipathic and containing 5 to 20 amino acids (AAs), with a high proportion of non-proteinogenic amino acids, such as α-aminoisobutyric acid (Aib) and isovaline (Iva). Peptaibols usually possess an acetylated N-terminus and a C-terminal amino alcohol. Compared to small molecules, peptides are capable of affecting “undruggable” targets and interfering with proton–protein interaction (PPIs), their unique biological and chemical characteristics could provide higher affinity and specificity for targets, along with reduced nonspecific toxicity.10) On the other hand, peptides are preferred when compared to the large size and high production cost of monoclonal antibodies.11) There are more than 1000 peptaibols have been reported to date which have received increasing attention from both biochemists and pharmacologists due to their wide range of bioactivities, including antibacterial, antifungal, antiviral and cytotoxic activities.12)
As part of our ongoing search for new anticancer agents from filamentous fungi, we focused our efforts on the culture of Acremonium tubakii BMC-58, which exhibited potent cytotoxic activities against human breast cancer (MDA-MB-231), human lung cancer (H1975) and mouse testicular cancer (I-10) cell lines at 100 µg/mL. Through bioactivity-guided fractionation method, five known peptaibols, namely, cephaibols A–E which were firstly obtained from Acremonium tubakii DSM12774 had been identified.13) And they were found to exhibit anthelmintic and antibacterial activities. As far as we know, the anticancer effect of these compounds and even their potential mechanisms have not been reported yet. In this study, we discovered the inhibitory effect of cephaibol A against MDA-MB-231 cells for the first time and investigated its mechanism of action.
MATERIALS AND METHODS
General Experimental ProceduresAll chemical solvents were purchased from Shanghai Titan Technology Co., Ltd. (Shanghai, China) and the analytical purity can be used directly without further purification. 1H-NMR, 13C-NMR and two-dimensional (2D)-NMR spectra were recorded on a Bruker (Billerica, MA, U.S.A.) AVANCE NEO 400 MHz spectrometer. High resolution electrospray ionization (HRESI)MS was obtained by Thermo Fisher Scientific (Waltham, MA, U.S.A.) Q Exactive mass spectrometer. Column chromatography (CC) and preparative HPLC were collected using silica gel (100–400 mesh, Qingdao Marine Chemical Factory, Qingdao, China) and C18 column (YMC-Pack ODS-A, 10 × 250 mm, 5 µm, 3 mL/min), respectively. The purity of all compounds was checked by HPLC (Shimadzu Corp., Kyoto, Japan).
Fungal MaterialThe fungus was isolated from a sediment sample, collected from the Huai River (Bengbu, Anhui Province, China, 32°57′3″N, 117°21′19″E). The pure fungus was stored at 4 °C for further study. Fungal identification was carried out through the DNA extraction, and the internal transcribed spacer (ITS) region sequence amplified at Rui Biotech Biotechnology Company (http://www.ruibiotech.com/). The sequence data obtained from the fungal strain was deposited into GenBank and identified as Acremonium tubakii (GenBank accession number MZ772049) by ITS sequence blast. A voucher specimen was deposited in our laboratory at −20 °C. The working strain was prepared on potato dextrose agar slants and stored at 4 °C.
Fermentation and ExtractionThe fungus Acremonium tubakii BMC-58 was cultured under static conditions at room temperature into a 1000 mL culture flask containing 300 mL of liquid medium, which comprised mannitol (2%), maltose (2%), glucose (1%), sodium glutamate (1%), yeast extract (0.3%), corn syrup (0.1%), KH2PO4 (0.05%) and MgSO4∙7H2O (0.03%). After 4 weeks of cultivation, the whole broth (40 L) was filtered through gauze to separate supernatant and mycelia. The former was extracted three times with EtOAc, while the latter was extracted three times with methanol and concentrated under reduced pressure to afford an aqueous solution, which was then extracted three times with EtOAc. All EtOAc solution were combined and concentrated under reduced pressure to obtain an extract (25.0 g).
Purification and Structural IdentificationThe crude extract was applied to a silica gel (300–400 m) column and was separated into ten fractions with a step gradient elution of CH2Cl2–MeOH (from 200 : 1 to 1 : 1). Then reversed-phase column chromatography with a step gradient elution from 10% MeOH/H2O to 100% MeOH was applied on Fraction 10 (7.86 g) to afford seven subfractions. Subfr. 10-1 was applied on semipreparative HPLC (45 : 55 CH3CN–H2O, 3 mL/min) to afford cephaibol D (10 mg). Subfr. 10-2 was purified by HPLC with 48% CH3CN/H2O (with 0.1% TFA, 3.0 mL/min) to yield cephaibol C (8 mg) and E (10 mg). Similarly, subfr. 10-3 was separated by HPLC with 48% CH3CN/H2O (with 0.1% TFA, 3.0 mL/min) to yield cephaibols A (8 mg) and B (10 mg). The structures of these compounds were determined by spectral analysis and related literatures.
Biological ExperimentsCell Lines and Cell CultureThe cell lines MDA-MB-231, MCF-7, SMMC-7721, CNE-2Z and NCI-H1975 were purchased from the Shanghai Cell Bank of the Chinese Academy of Sciences. Specifically, MDA-MB-231 cells were maintained in L-15 medium (KGI Biotechnology Co., Ltd., Jiangsu, China) and supplemented with 10% serum (Shuangji Biotechnology Co., Ltd., Shanghai, China). These cells were kept in an incubator at a steady temperature of 37 °C. The remaining cell lines were cultivated in RPMI 1640 medium (Invitrogen, Carlsbad, CA, U.S.A.) also supplemented with 10% serum (Tianhang Biotechnology Co., Ltd., Zhejiang, China) and maintained in a 5% CO2 incubator at the same temperature of 37 °C.
Cell Viability AssayThe 3-(4,5-dimethylthiazol-2-yl)-2,5-diphenyltetrazolium bromide (MTT) assay was utilized to assess the cytotoxic effects of cephaibols A–E on various cell lines. The cells were seeded at a density of 1.0 × 10⁵ per well in 96-well plates and allowed to adhere for 24 h under standard culture conditions (37 °C, 5% CO2). Subsequently, the cells were exposed to varying concentrations of the cephaibols and further incubated for 72 h. The assay was initiated by adding 10 µL of a 5 mg/mL MTT solution in phosphate buffered saline (PBS) to each well, followed by a 4-h incubation at 37 °C. The resulting purple formazan crystals were solubilized with 100 µL of dimethyl sulfoxide (DMSO) after removing culture medium. The optical density was then quantified at 490 nm using a microplate reader. The survival rate was calculated according to the following formula:
Taxol was used as a positive control. The mean and standard deviation of triplicate values of each concentration were calculated, and IC50 was determined using SPSS software (version 16.0).
Colony Formation AssayMDA-MB-231 cells were seeded into 6-well plates at a density of 3000 cells per well and incubated for 2 to 3 d to facilitate cell adhesion. Then the cells were treated with cephaibol A at varying concentrations (0, 1.25, 2.5, 5 µM) and maintained for 48 h. Throughout the experimental period, the culture medium was refreshed every 3 to 4 d and the incubation was continued for a total of 2 weeks to allow for the development of substantial colonies. Then the cells were gently washed twice with PBS to remove any residual culture medium. Subsequently, they were fixed using a 4% paraformaldehyde solution at 25 °C for 30 min. After fixation, the cells were stained with a 0.1% crystal violet solution for 15 min, followed by rinsing with water to remove excess stain. The stained colonies were then documented using a digital camera.
Cell Cycle AnalysisMDA-MB-231 cells were initially plated in 6-well plates at a concentration of 7 × 10⁵ cells per well and incubated for 24 h to ensure proper adherence. Subsequently, the growth medium was replaced with fresh medium containing cephaibol A at varying concentrations (0, 2.5, 5, 10 µM) and the cells were further incubated for an additional 24 h. Then the cells were washed twice with cold PBS to remove medium traces and detached using trypsin and resuspended in ice-cold 70% ethanol. The cell suspension was stored at −20 °C for 48 h. After the fixation period, the ethanol was removed and the cells were resuspended in 200 µL of PBS supplemented with 2.5 µL of ribonuclease (RNase) A. The mixture was incubated at 37 °C for 30 min. Subsequently, the cells were stained with propidium iodide (PI) at a final concentration of 10 mg/mL for 30 min at 4 °C in the dark. After staining, the cells were analyzed using a Beckman flow cytometer and the resulting data were processed with Modfit LT 5.0 software.
Wound-Healing AssayMDA-MB-231 cells were seeded in 6-well plates at a seeding density of 5 × 10⁵ cells per well and cultured until they formed a near-confluent monolayer. An artificial wound was introduced across the cell layer using a 10 µL pipette tip. Subsequently, the cells were exposed to cephaibol A at different concentrations (0, 2.5, 5, 10 µM) and the plates were incubated for 24 h. Wound images from three randomly selected fields were captured at 0 and 24 h under a microscope and the width of scratch width was measured. The consistency of the inhibitory effects was validated through three independent replicates of the experiment.
Cell Migration AssayCell migration was assessed utilizing a transwell assay with 24-well plates equipped with 8.0 µm pore size membrane inserts (Corning, NY, U.S.A.) in the absence of Matrigel. MDA-MB-231 cells were suspended at a density of 4.0 × 10⁴ cells per well in the upper chambers and subjected to incubation for 24 h post-treatment with cephaibol A at varying concentrations (0, 2.5, 5, 10 µM). Then the cells that had migrated to the underside of the membrane were fixed and stained with a 0.1% solution of crystal violet. The stained cells were visualized and documented using a light microscope at a magnification of 200×.
Cell Invasion AssayCell invasion assays were conducted using a 24-well plate with 8.0 µm pore membrane inserts that were coated with 50 µL of Matrigel (BD, U.S.A.) and incubated at 37 °C for 60 min. MDA-MB-231 cells (4.0 × 10⁴ cells per well) were added to the upper chambers and incubated with various concentrations (0, 2.5, 5, 10 µM) of cephaibol A for 24 h. The rest of the process was same as that described in the section 4.2.6.
Apoptosis AssayMDA-MB-231 cells were seeded in 6-well plates at a density of 7 × 10⁵ cells per well and cultured at 37 °C for 24 h. Treated the cells with cephaibol A (0, 5, 10, 20 µM) for 24 h. Washed the cells with ice-cold PBS, digested and collected into tubes. 5 µL of Annexin V-fluorescein isothiocyanate (FITC) and 5 µL of PI were added and incubated for 30 min, then apoptosis was detected using flow cytometry. Data were analyzed by FlowJo7.6.
Mitochondrial Membrane Potential DeterminationMDA-MB-231 cells were added to 6-well plates at a density of 1 × 10⁵ cells per well and incubated at 37 °C for 24 h. Treated the cells with different concentrations of cephaibol A (0, 5, 10, 20 µM) for 24 h. Then washed the cells with ice-cold PBS three times and stained with JC-1 for 30 min at 37 °C in the dark. After further washing with JC-1 staining buffer, data were detected by flow cytometry and images of the cells were captured using an inverted fluorescence microscope.
Assessment of Intracellular Reactive Oxygen Species (ROS) LevelsMDA-MB-231 cells were inoculated in 6-well plates at a density of 1 × 10⁵ cells per well and cultured at 37 °C overnight. Treated the cells with different concentrations of cephaibol A (0, 5, 10, 20 µM) for 24 h. Then the cells were collected and stained with 10 µM 2′,7′-dichlorodihydrofluorescein diacetate (DCFH-DA) for 30 min at 37 °C. The stained cells were washed with fresh medium three times and visualized by flow cytometry and inverted fluorescence microscopy.
PI StainingCells were inoculated in confocal dishes, acted with 20 µM cephaibol A for 0, 3, 6, 9 and 12 h, washed twice with PBS, added PI staining for 30 min and then washed with PBS to remove PI. Photographed by inverted fluorescence microscopy.
Western Blotting AnalysisMDA-MB-231 cells were inoculated and cultured to approximately a density of 80%. Then the cells were exposed to varying concentrations of cephaibol A (0, 5, 10, 20 µM) and incubated at 37 °C for 24 h. The cells were lysed using a Radio-Immunoprecipitation Assay (RIPA) buffer supplemented with a cocktail of protease inhibitors. The protein content was quantified using a Bicinchoninic Acid (BCA) protein assay kit then subjected to heat denaturation at 95 °C for 10 min in the presence of loading buffer. The proteins were resolved by sodium dodecyl sulfate-polyacrylamide gel electrophoresis (SDS-PAGE) employing a 10% resolving gel with a 5% stacking gel. Following electrophoresis, the proteins were transferred onto polyvinylidene fluoride (PVDF) membranes. The membranes were blocked with a solution of 5% nonfat milk in Tris-buffered saline containing 0.1% Tween-20 (TBST) for 4 h and incubated with primary antibodies specific to the proteins of interest at 4 °C overnight. Then the membranes were washed with TBST and then incubated with secondary antibodies for 2 h at room temperature. The protein bands were visualized using a chemiluminescence detection kit and captured using a gel imaging system (Bio-Rad, U.S.A.). β-Actin was employed as a loading control.
Animal ExperimentsFemale BALB/c nude mice (4–6 weeks old) were provided by Shanghai SLAC Laboratory Animal Co. The mice were housed in a pathogen-free environment with a temperature of 25 ± 2 °C and humidity of 50 ± 5%, and ad libitum access to food and water. All animal studies were approved by the Animal Protection and Utilization Committee of Bengbu Medical University. Human breast cancer MDA-MB-231 cells (5 × 10⁶ cells/each) were injected subcutaneously into mice and tumor formation was induced. When the tumor volume reached 100–200 mm3, the mice were randomly divided into 5 groups (n = 5/each), and each group was given 0.05% sodium carboxymethylcellulose, cephaibol A (0.5 mg/kg), cephaibol A (1.0 mg/kg), cephaibol A (2.0 mg/kg), Taxol (0.5 mg/kg) by intratumoral injection every two days for seven cycles. The tumor volume was measured every two days and the tumor volume was calculated: V = 0.5 × dmax × dmin2 (dmax and dmin were the maximum and minimum diameter of the tumor, respectively). At the end of the experiment, solid tumors were collected and preserved in 4% formalin solution, paraffin-embedded and then tunel stained.
Institutional Review Board StatementThe animal study protocol was approved by the Institutional Review Board of Bengbu Medical University Ethics Committee.
Statistical AnalysisAll experimental values were expressed as mean ± standard deviation (S.D.). Statistical analysis was performed using SPSS software (version 16.0). Student’s t-test or one-way ANOVA was used to analyze the statistical significance of the differences between groups. * p < 0.05, ** p < 0.01 and *** p < 0.001 were considered statistically significant differences.
RESULTS
Structure Determination of Cephaibols A–EChemical investigation of the culture extract from Acremonium tubakii BMC-58 identified five known compounds, cephaibols A–E (as shown in Supplementary Fig. S1), belonging to a class of straight-chain peptides consisting of 16 amino acid residues. The amino acid sequence of them showed marginal variation among the group members, the main difference involving methyl groups at positions 5, 6, 8, and 12. Cephaibols A–E are classified as fungal nonribosomal peptides, specifically peptaibols, characterized by a sequence of 5–20 amino acids containing a high content of non-proteinogenic, α-dialkylated amino acids such as Aib or Iva, along with a C-terminal 1, 2-amino alcohol and (usually) acylation at the N-terminus.
In Vitro Cytotoxicity Studies of Cephaibol ACephaibols have been proved to possess antibacterial, anthelmintic and neuroleptic activities. However, their anticancer effects and potential mechanisms have not yet been reported. Therefore, the cytotoxicities of cephaibols A–E were evaluated against five cell lines including human breast cancer MDA-MB-231 cells, human breast carcinoma MCF-7 cells, human hepatocellular carcinoma SMMC-7721 cells, human nasopharyngeal carcinoma CNE-2Z cells and human lung adenocarcinoma NCI-H1975 cells (as shown in Table 1).
Table 1. Cytotoxic Activity of Cephaibols A–E against Five Cancer Cell Lines (IC
50, 72 h)
| Compound | IC50 (µM) |
|---|
| MDA-MB-231 | MCF-7 | SMMC-7721 | CNE-2Z | NCI-H1975 |
|---|
| Cephaibol A | 8.19 ± 0.62 | 5.93 ± 0.93 | 7.3 ± 0.42 | 7.53 ± 0.50 | 10.45 ± 0.60 |
| Cephaibol B | 11.73 ± 0.33 | 7.67 ± 0.79 | 7.28 ± 0.70 | 10.48 ± 0.40 | 5.58 ± 0.29 |
| Cephaibol C | 26.57 ± 0.73 | 30.65 ± 0.87 | 28.67 ± 0.85 | 24.38 ± 0.96 | 28.67 ± 0.87 |
| Cephaibol D | >50.0 |
| Cephaibol E | 45.75 ± 0.24 | 32.93 ± 0.78 | 28.83 ± 0.49 | 29.93 ± 0.86 | 18.61 ± 0.79 |
| Taxol | 0.069 ± 0.01 | 0.126 ± 0.01 | 0.048 ± 0.01 | 0.129 ± 0.01 | 0.585 ± 0.04 |
Cephaibols A and B exhibited remarkable inhibitory effects against the proliferation of all cells with average IC50 values of 7.88 µM and 8.55 µM, respectively, while cephaibols C–E showed less activity (IC50 > 20 µM). Additionally, cephaibol A reduced the viability of MDA-MB-231 cells in a dose-dependent manner after 72-h treatment. The monoclonal formation assay confirmed that cephaibol A inhibited the proliferation of MDA-MB-231 cells. These results suggested the superior antiproliferative effects of cephaibol A and prompted a further investigation into its cytotoxic mechanism against MDA-MB-231 cells (as depicted in Fig. 1).
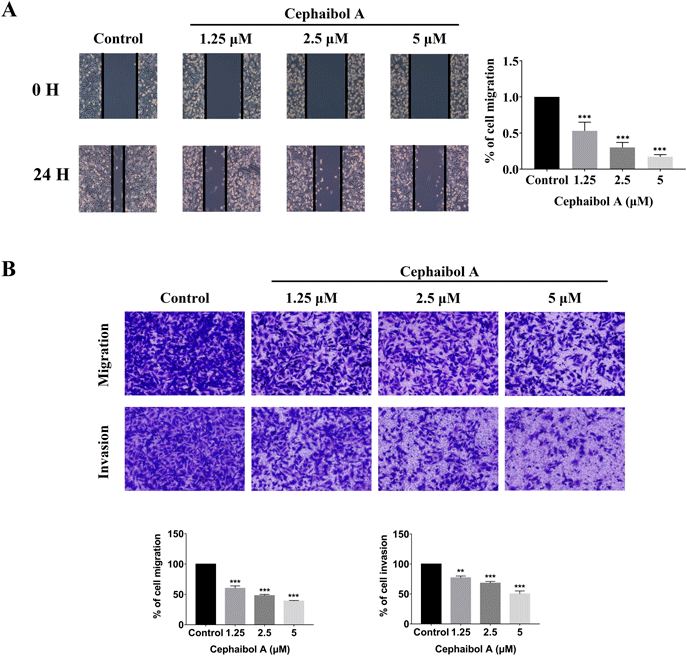
Cephaibol A Inhibited the Migration and Invasion of MDA-MB-231 CellsTumor invasion and metastasis are major contributors to poor prognosis and survival rates in breast cancer patients.14) Therefore, inhibiting these processes is an important therapeutic strategy for TNBC. A wound-healing assay was conducted to investigate whether cephaibol A suppress the migration of MDA-MB-231 cells. As shown in Fig. 2A, treatment with cephaibol A at concentrations of 1.25, 2.5, and 5 µM resulted in gradual reductions of cells wounds, achieving healing percentages of 53.3, 30.1, and 16.9%, respectively. Subsequently, the impact of cephaibol A on migration and invasion of MDA-MB-231 cells were examined using transwell migration assays (Fig. 2B). The results suggested that cephaibol A significantly suppressed cell migration and invasion of the tested cell lines, reducing these activities to 58.9 and 76.1% at a concentration as low as 1.25 µM.
Cephaibol A Arrested the Cell Cycle at the S PhaseTo further reveal the antiproliferative effect of cephaibol A on MDA-MB-231 cells, we evaluated its effect on cell cycle distribution by analyzing DNA content. After treated with cephaibol A for 24-h, the cell cycle distribution was shown in Fig. 3. The percentages of cells in each phase for control and cephaibol A concentrations of 2.5, 5, and 10 µM were as follows: G0/G1 phase (DNA presynthetic phase), 74.8, 72.0, 65.4, and 63.4%; S phase (DNA synthesis phase), 11.2, 14.5, 19.5, and 31.1%; G2/M phase (DNA postsynthetic and mitosis phases), 14.0, 13.5, 15.1, and 5.6%, respectively. The cell cycle distribution of MDA-MB-231 cells exhibited a dose-dependent response. The proportion of cells in the S phase increased from 14.5 to 31.1%, indicated that cephaibol A could inhibited the cell proliferation by arresting the cells in the S phase. The S phase is associated with DNA synthesis and crucial for cell cycle progression. Based on the results above, cephaibol A could interfere with DNA synthesis and regulate cell cycle progression.
Cephaibol A Induced Apoptosis in MDA-MB-231 CellsTo investigate whether cephaibol A induced antiproliferative effects through apoptosis, AO/EB staining, which could identify the different stages of cells that are undergoing apoptosis and necrosis, was used to observe changes in cell morphology. As shown in Fig. 4A, untreated MDA-MB-231 cells exhibited normal morphology with green fluorescence, whereas cells treated with cephaibol A showed significantly enhanced fluorescence intensity in a dose-dependent manner. As shown in Fig. 4B, transmission electron microscopy revealed submicroscopic changes in MDA-MB-231 cells. After treated with cephaibol A (10 µM), morphological characteristics of apoptosis including chromatin margination and nuclear pyknosis were observed. To further con-firm cell apoptosis induced by cephaibol A, annexin V-FITC/PI staining experiment and flow cytometry analysis were performed to distinguish the apoptotic cells from living cells. The apoptosis rate of MDA-MB-231 cells triggered by cephaibol A was recorded as dose-dependent apoptosis from 2.5 to 10 µM. The combined early and late apoptotic cell proportion rose to 84.7% at 10 µM, compared to 8.56% in the control. The above results demonstrated that cephaibol A induced the apoptosis of MDA-MB-231 cells in a concentration-dependent manner.
Cephaibol A Induced Mitochondrial Dysfunction in MDA-MB-231 CellsThe mitochondria play a crucial role in the regulation of apoptotic cell death.15) To determine whether apoptosis induced by cephaibol A was related to mitochondrial dysfunction, MDA-MB-231 cells were treated with cephaibol A at the indicated concentrations for 24-h and mitochondrial membrane potential (ΔΨm) was assessed using fluorescence microscopy with JC-1 staining. Normal mitochondria of cells exhibited intense red fluorescence, while apoptotic cells with low ΔΨm display green fluorescence. As shown in Fig. 5A, treatment of MDA-MB-231 cells with cephaibol A for 24 h resulted in a concentration-dependent decrease in red fluorescence and an increase in green fluorescence. As shown in Fig. 5B, the number of cells with low ΔΨm were observed through flow cytometry, which was consistent with the fluorescence microscopy assay results. Therefore, it can be inferred that cephaibol A could effectively induce mitochondrial potential collapse, led to mitochondrial dysfunction and finally triggered apoptotic cell death.
Cephaibol A Induced ROS Accumulation in MDA-MB-231 CellsMitochondrial dysfunction is also associated with mitochondrial production of ROS and their levels are very high during cell apoptosis.16) The DCFH-DA assay was conducted to examine ROS level of MDA-MB-231 cells. As shown in Fig. 6, compared to the control group, the green fluorescence intensity in cells treated with cephaibol A at 10 µM was much higher than that in other groups, suggesting that cephaibol A significantly increased intracellular ROS levels. Quantitative detection was further analyzed by flow cytometry and the results showed a marked dose-based increase in ROS levels after incubation with cephaibol A which were consistent with the DCFH-DA assay. Taken together, the ΔΨm reduction and ROS generation indicated that cephaibol A induced MDA-MB-231 cell apoptosis through the mitochondrial pathway.
Effect of Cephaibol A on Protein Expressions of MDA-MB-231 CellsWestern blotting analysis was conducted to assess the expression of migration- and invasion-related proteins (including HIF-1α, MMP-2 and MMP-9) in MDA-MB-231 cells treated with cephaibol A. As shown in Fig. 7A, the expression levels of all three proteins were significantly downregulated in a dose-dependent manner distinctly. To elucidate the mechanism by which cephaibol A induced S phase arrested in MDA-MB-231 cells, we observed an upregulation of cyclin A2 expression and a down-regulation of cyclin-dependent kinase 2 (CDK2) expression, both in a concentration-dependent manner, as shown in Fig. 7B. These results further confirmed that cephaibol A could interfere with DNA synthesis and regulate cell cycle progression. To determine the underlying mechanism of cephaibol A induced apoptosis in MDA-MB-231 cells, we examined the expression of apoptosis-associated proteins. The pro-apoptotic proteins (Bax) and anti-apoptotic proteins (Bcl-2) play vital roles in the regulation of the mitochondrial apoptotic pathway.17) Meanwhile cytochrome c released from the mitochondria into the cytoplasm is an indicator of mitochondrial-dependent apoptosis pathways.18) As shown in Fig. 7C, Western blotting demonstrated cephaibol A treatment resulted in the down-regulation of Bcl-2 in a dose-dependent manner and up-regulation of Bax compared to the control group, and the level of cytochrome c gradually increased in the cytoplasm/total cells in a dose-dependent manner due to the treatment of cephaibol A, indicating activation of the mitochondrial-dependent apoptosis pathway. The activated PARP following caspase cleaving is the symbol of apoptosis.19) As shown in Fig. 7D, treatment with cephaibol A for 24-h significantly increased levels of cleaved PARP and cleaved caspase-3 protein. These findings collectively reinforcing that cephaibol A inhibited MDA-MB-231 cells proliferation by inducing apoptosis through mitochondria-related pathways.
In Vivo Anti-tumor Activity of Cephaibol ATo explore the inhibitory effect of cephaibol A on tumor cells in vivo, MDA-MB-231 cells were subcutaneously injected into nude mice and treated with cephaibol A at doses of 0.5, 1.0, and 2.0 mg/kg every two days. After treatment for 14 d, the mice were sacrificed then both tumor volume and tumor weight were measured. As shown in Figs. 8A and 8B, the tumor volume increase in the mice treated with cephaibol A was significantly reduced and the tumor volume was notably smaller than that of the control group, indicating that cephaibol A could effectively inhibit MDA-MB-231 cell growth in vivo. The tumor inhibition rate of the 2.0 mg/kg group was approximately 60%, while the positive control group (0.5 mg/kg) exhibited an inhibition rate of about 51%. According with tumor volume data, cephaibol A treated groups showed a significant decrease in tumor weight without obvious body weight loss. As shown in Fig. 8E, tunel staining of the tumor indicated that cephaibol A could induce significant expression of apoptosis in vivo. Hematoxylin–eosin (H&E) staining of the organs including the heart, liver, spleen and kidney revealed no apparent damage, and the lung was not affected under certain doses (Fig. 8F). These results indicated that cephaibol A displayed a significant anti-tumor effect in vivo.
DISCUSSION
The discovery and characterization of bioactive natural products, such as peptaibols, continue to be a rich source of potential therapeutic agents. Peptaibols, a diverse group of linear, amphipathic peptides, are known for their wide range of biological activities, including antimicrobial, neuroactive and antitumor properties.20) In this study, we focus on cephaibol A, a member of the peptaibol family, which is distinguished by its high content of Aib and its right-handed helical conformation in the crystalline state.21) This conformation is crucial for its ability to interact with biological membranes, potentially leading to increased ion permeability and cell death.22)
Our findings revealed, for the first time, the anti-tumor activity of cephaibol A against MDA-MB-231 cells, a model of triple-negative breast cancer. TNBC is an aggressive form of breast cancer that lacks hormone receptors, making it less responsive to conventional therapies and more prone to recurrence and metastasis.23) The ability of cephaibol A to reduce cell motility and prevent metastasis offered a significant advancement in the search for effective treatments for this disease.
The mitochondria play a pivotal role in the regulation of apoptosis, serving as the central hub for the initiation of cell death pathways.24) The collapse of mitochondrial membrane potential (ΔΨm) is widely recognized as a critical early event in the cascade of cellular apoptosis. This intrinsic pathway, once activated, is typically irreversible, leading to the activation of downstream effector caspases and culminating in cell death.25,26)
In this study, we observed that cephaibol A, a compound isolated from the fresh-water fungus Acremonium tubakii BMC-58, significantly reduced the ΔΨm in MDA-MB-231 cells. This effect was associated with alterations in membrane permeability and structural integrity, as evidenced by flow cytometry and fluorescence microscopy. These findings suggested that cephaibol A may promote apoptosis through mitochondrial-mediated pathways, a mechanism that could have significant implications for cancer therapy.
Bax and Bcl-2 are key regulatory proteins that govern the permeability of the outer mitochondrial membrane during the early stages of apoptosis.27) Bax, a pro-apoptotic protein, translocates from the cytoplasm to the mitochondria upon receipt of apoptotic signals, whereas Bcl-2, an anti-apoptotic protein, facilitates the release of cytochrome c from the mitochondria into the cytoplasm. This release is a crucial step in the activation of caspase-3, a central executioner of apoptosis. Our further investigation into the proteins involved in the mitochondrial apoptotic signaling pathway revealed that treatment with cephaibol A led to a decrease in the expression of the anti-apoptotic protein Bcl-2 on the mitochondrial membrane and an increase in the expression of the pro-apoptotic protein Bax. This shift in protein expression dynamics promotes the release of cytochrome c, thereby enhancing its expression in the cytoplasm. Concurrently, this led to the activation of downstream caspase family proteins, either directly or through interaction with specific substrates, thus driving the cells towards apoptosis.
Apoptosis is intricately linked with abnormal cell proliferation, which is often driven by disruptions in the cell cycle.28) Our study utilized flow cytometry analysis to demonstrate that cephaibol A downregulated the expression of cyclin A2 and CDK2, key regulators of cell cycle progression. This downregulation resulted in the arrest of the MDA-MB-231 cell cycle in the S phase, a phase critical for DNA replication. The disruption of normal cell cycle progression by cephaibol A ultimately leaded to cell apoptosis, providing a potential therapeutic strategy for the treatment of cancers characterized by uncontrolled cell proliferation.
CONCLUSION
In summary, this study demonstrated the inhibitory effect of cephaibol A which obtained from a freshwater fungus Acremonium tubakii BMC-58 on TNBC in vitro and in vivo and further explored its mechanism of action. Cephaibol A could gradually decrease the survival rate of MDA-MB-231 cells with increasing concentration and duration of action, trigger cell cycle arrest in S phase and inhibit the normal replication process of DNA. And it could also inhibit the proliferation and cell migration of TNBC cells. Further investigation revealed that cephaibol A caused mitochondrial dysfunction by increasing ROS accumulation. Concurrently, cephaibol A increased the content of Bax and decreased Bcl-2 expression, resulted in the up-expression of cytochrome c, cleaved PARP and cleaved caspase-3 protein. All these results supported the hypothesis that cephaibol A caused cell apoptosis through the mitochondrial pathway. The antitumor activity of cephaibol A has been kept veiled for decades, based on this study, it has been proved that cephaibol A potentially serving as a crucial approach to targeting metastasis in triple-negative breast cancer.
Funding
This work was funded by National Natural Science Foundation of China (81903486), Anhui Provincial Natural Science Foundation (1908085QH347) and Natural Science Research Project of Anhui Provincial Department of Education (2023AH051920).
Conflict of Interest
The authors declare no conflict of interest.
Supplementary Materials
This article contains supplementary materials.
REFERENCES
- 1) Siegel RL, Miller KD, Wagle NS, Jemal A. Cancer statistics, 2023. CA Cancer J. Clin., 73, 17–48 (2023).
- 2) Yin L, Duan J-J, Bian X-W, Yu S. Triple-negative breast cancer molecular subtyping and treatment progress. Breast Cancer Res., 22, 61 (2020).
- 3) Dent R, Trudeau M, Pritchard KI, Hanna WM, Kahn HK, Sawka CA, Lickley LA, Rawlinson E, Sun P, Narod SA. Triple-negative breast cancer: clinical features and patterns of recurrence. Clin. Cancer Res., 13, 4429–4434 (2007).
- 4) Cho B, Han Y, Lian M, Colditz GA, Weber JD, Ma C, Liu Y. Evaluation of racial/ethnic differences in treatment and mortality among women with triple-negative breast cancer. JAMA Oncol., 7, 1016–1023 (2021).
- 5) Aldrich LN, Burdette JE, Carcache de Blanco E, Coss CC, Eustaquio AS, Fuchs JR, Kinghorn AD, MacFarlane A, Mize BK, Oberlies NH, Orjala J, Pearce CJ, Phelps MA, Rakotondraibe LH, Ren Y, Soejarto DD, Stockwell BR, Yalowich JC, Zhang X. Discovery of anticancer agents of diverse natural origin. J. Nat. Prod., 85, 702–719 (2022).
- 6) Bin Hafeez A, Jiang X, Bergen PJ, Zhu Y. Antimicrobial peptides: an update on classifications and databases. Int. J. Mol. Sci., 22, 11691 (2021).
- 7) Boparai JK, Sharma PK. Mini review on antimicrobial peptides, sources, mechanism and recent applications. Protein Pept. Lett., 27, 4–16 (2020).
- 8) Momose I, Onodera T, Doi H, Adachi H, Iijima M, Yamazaki Y, Sawa R, Kubota Y, Igarashi M, Kawada M. Leucinostatin Y: a peptaibiotic produced by the entomoparasitic fungus purpureocillium lilacinum 40-H-28. J. Nat. Prod., 82, 1120–1127 (2019).
- 9) Daniel JF, Filho ER. Peptaibols of Trichoderma. Nat. Prod. Rep., 24, 1128–1141 (2007).
- 10) Chiangjong W, Chutipongtanate S, Hongeng S. Anticancer peptide: physicochemical property, functional aspect and trend in clinical application. Int. J. Oncol., 57, 678–696 (2020).
- 11) Yavari B, Mahjub R, Saidijam M, Raigani M, Soleimani M. The potential use of peptides in cancer treatment. Curr. Protein Pept. Sci., 19, 759–770 (2018).
- 12) Stoppacher N, Neumann NKN, Burgstaller L, Zeilinger S, Degenkolb T, Brückner H, Schuhmacher R. The comprehensive peptaibiotics database. Chem. Biodivers., 10, 734–743 (2013).
- 13) Schiell M, Hofmann J, Kurz M, Schmidt FR, Vértesy L, Vogel M, Wink J, Seibert G. Cephaibols, new peptaibol antibiotics with anthelmintic properties from Acremonium tubakii DSM 12774. J. Antibiot. (Tokyo), 54, 220–233 (2001).
- 14) Kramer N, Walzl A, Unger C, Rosner M, Krupitza G, Hengstschläger M, Dolznig H. In vitro cell migration and invasion assays. Mutat. Res., 752, 10–24 (2013).
- 15) Jeong S-Y, Seol D-W. The role of mitochondria in apoptosis. BMB Rep., 41, 11–22 (2008).
- 16) Miwa S, Kashyap S, Chini E, von Zglinicki T. Mitochondrial dysfunction in cell senescence and aging. J. Clin. Invest., 132, e158447 (2022).
- 17) Glab JA, Cao Z, Puthalakath H. Bcl-2 family proteins, beyond the veil. Cell Death Regulation in Health and Disease - Part A, pp. 1–22 (2020).
- 18) Wang L, Ma G, Zhang Y, Shi X, Han L, Yu Q, Zhao S, Ma J. Effect of mitochondrial cytochrome c release and its redox state on the mitochondrial-dependent apoptotic cascade reaction and tenderization of yak meat during postmortem aging. Food Res. Int., 111, 488–497 (2018).
- 19) Won S-J, Ki YS, Chung K-S, Choi J-H, Bae KH, Lee K-T. 3Alpha,23-isopropylidenedioxyolean-12-en-27-oic acid, a triterpene isolated from Aceriphyllum rossii, induces apoptosis in human cervical cancer hela cells through mitochondrial dysfunction and endoplasmic reticulum stress. Biol. Pharm. Bull., 33, 1620–1626 (2010).
- 20) Hou X, Sun R, Feng Y, Zhang R, Zhu T, Che Q, Zhang G, Li D. Peptaibols: diversity, bioactivity, and biosynthesis. Engineering Microbiology, 2, 100026 (2022).
- 21) Orcel U, De Poli M, De Zotti M, Clayden J. The N-terminal nonapeptide of cephaibols A and C: a naturally occurring example of mismatched helical screw-sense control. Chem. Eur. J., 19, 16357–16365 (2013).
- 22) Gimenez-Dejoz J, Numata K. Molecular dynamics study of the internalization of cell-penetrating peptides containing unnatural amino acids across membranes. Nanoscale Adv., 4, 397–407 (2022).
- 23) Saha T, Solomon J, Samson AO, Gil-Henn H. Invasion and metastasis as a central hallmark of breast cancer. J. Clin. Med., 10, 3498 (2021).
- 24) Fang Y, Wang S. Study on mechanism of kaempferol inducing apoptosis of triple negative breast cancer cells through mitochondrial apoptosis pathway. Natural Product Research and Development, 35, 397–404 (2023).
- 25) Zorova LD, Popkov VA, Plotnikov EY, Silachev DN, Pevzner IB, Jankauskas SS, Babenko VA, Zorov SD, Balakireva AV, Juhaszova M, Sollott SJ, Zorov DB. Mitochondrial membrane potential. Anal. Biochem., 552, 50–59 (2018).
- 26) Nguyen TT, Wei S, Nguyen TH, Jo Y, Zhang Y, Park W, Gariani K, Oh C-M, Kim HH, Ha K-T, Park KS, Park R, Lee I-K, Shong M, Houtkooper RH, Ryu D. Mitochondria-associated programmed cell death as a therapeutic target for age-related disease. Exp. Mol. Med., 55, 1595–1619 (2023).
- 27) Kiraz Y, Adan A, Kartal Yandim M, Baran Y. Major apoptotic mechanisms and genes involved in apoptosis. Tumour Biol., 37, 8471–8486 (2016).
- 28) Tan H, Gao S, Zhuang Y, Dong Y, Guan W, Zhang K, Xu J, Cui J. R-Phycoerythrin induces SGC-7901 apoptosis by arresting cell cycle at S phase. Mar. Drugs, 14, 166 (2016).