Abstract
Diabetic retinopathy (DR) can cause visual impairment and blindness, and the increasing global prevalence of diabetes underscores the need for effective therapies to prevent and treat DR. Therefore, this study aimed to evaluate the protective effect of pemafibrate treatment against DR, using a Spontaneously Diabetic Torii (SDT) fatty rat model of obese type 2 diabetes. SDT fatty rats were fed either a diet supplemented with pemafibrate (0.3 mg/kg/d) for 16 weeks, starting at 8 weeks of age (Pf SDT fatty: study group), or normal chow (SDT fatty: controls). Normal chow was provided to Sprague–Dawley (SD) rats (SD: normal controls). Electroretinography (ERG) was performed at 8 and 24 weeks of age to evaluate the retinal neural function. After sacrifice, retinal thickness, number of retinal folds, and choroidal thickness were evaluated, and immunostaining was performed for aquaporin-4 (AQP4). No significant differences were noted in food consumption, body weight, or blood glucose level after pemafibrate administration. Triglyceride levels were reduced, and high-density lipoprotein cholesterol levels were increased. Extension of oscillatory potential (OP)1 and OP3 waves on ERG was suppressed in the Pf SDT fatty group. Retinal thickness at 1500 microns from the optic disc improved in the Pf SDT fatty group. No significant improvements were noted in choroidal thickness or number of retinal folds. Quantitative analyses showed that AQP4-positive regions in the retinas were significantly larger in the Pf SDT fatty group than in the SDT fatty group. The findings suggest that pemafibrate treatment can exert protective effects against DR.
INTRODUCTION
Among ocular complications associated with diabetes, diabetic retinopathy (DR) is a leading cause of visual impairment and blindness in industrialized countries.1) Among individuals with diabetes, the global prevalence of DR was reported to be 22.27%.2) More than 600 million people are predicted to develop diabetes by 2040,3) and the number of people with visual impairment due to DR is expected to increase rapidly.4)
In addition to blood glucose control, blood lipid control is important in preventing DR progression.5) Fenofibrate, a well-established peroxisome proliferator-activated receptor alpha (PPARα) agonist, is clinically used to treat hyperlipidemia by increasing high-density lipoprotein cholesterol levels and lowering triglyceride levels.6) According to a fenofibrate intervention and event lowering in diabetes (FIELD) study, fenofibrate usage can reduce the need for any first laser photocoagulation in individuals with both pre-and post-existing retinopathy.7) The Action to Control Cardiovascular Risk in Diabetes (ACCORD) eye study showed that retinopathy progression was slowed by fenofibrate to a degree similar to that observed with intensive glycemic therapy.8) These studies suggest that fenofibrate can suppress the onset and progression of DR. However, fenofibrate is associated with a high risk of renal dysfunction with increased serum creatinine levels, as fenofibrate is primarily excreted by the kidney.9) Therefore, fenofibrate treatment is not recommended for patients with severe renal disease.10)
Moreover, three PPAR isoforms—PPARα, γ, and δ—have been identified. Fenofibrate, which activates all three PPAR subtypes, has been shown to induce side effects such as liver dysfunction and increased creatinine levels, likely attributed to its low selectivity and potency for binding to PPARα. To address these concerns, the concept of a selective PPARα modulator (SPPARMα) with a superior balance of efficacy and safety has been proposed, leading to the development of pemafibrate.11) Pemafibrate is a novel SPPARMα and has higher potency and selectivity for activation of PPARα than fenofibrate.12–15) Pemafibrate was launched in the Japanese market in June 201816) and has been reported to outperform fenofibrate in terms of lowering serum triglyceride (TG) level while maintaining hepatic and renal safety.17) Moreover, PPARα is expressed in the retina, kidneys, and nerves,18,19) and this expression has been reported to be reduced in the retinas of both type 1 and type 2 diabetic animal models.20,21) PPARα has shown protective effects against hyperglycemia-related endothelial inflammation and retinal cell apoptosis by blocking the nuclear factor-κB pathway and alleviating oxidative stress in the retina.21–23) Furthermore, pemafibrate inhibits pathological neovascularization in oxygen-induced retinopathy by increasing plasma fibroblast growth factor 21 (FGF21) levels in the plasma and liver.24) Consequently, it is believed that activation of PPARα can contribute to the retinal protective effect. We hypothesize that the higher the selectivity for PPARα, the more pronounced the retinal protective effect could become. Additionally, selective PPARα activation holds promise for reducing side effects. Therefore, we anticipate that pemafibrate, with its higher potency and selectivity for PPARα activation compared to those of fenofibrate, could serve as a novel treatment for DR while minimizing side effects. However, the mechanism of action of PPARα in the diabetic retina is unclear.
The Spontaneously Diabetic Torii (SDT) fatty rat, established in 2004 by introducing the fa allele (obesity gene) of the Zucker fatty rat into the SDT rat genome, is a model of obese type 2 diabetes. The peak latencies of the oscillatory potentials in the electroretinograms of SDT fatty rats are longer than those of age-matched normal Sprague–Dawley (SD) rats, demonstrating retinal dysfunction.25) In our previous study, SDT fatty rats exhibited increased vascular endothelial growth factor (VEGF) concentrations in the vitreous humor, retinal vascular hyperpermeability, and retinal thickening; these were treated with phlorizin.26) Furthermore, the outer retinal folds in SDT fatty rats develop earlier and are more prominent than those in SDT rats. In addition, glial fibrillary acidic protein (GFAP)- and VEGF-positive regions in the retinas of SDT fatty rats are significantly larger than those in SDT rats.27)
In this study, we aimed to conduct electroretinography and pathological evaluation of the protective effects of pemafibrate against DR in SDT fatty rats.
MATERIALS AND METHODS
AnimalsAnimal care and handling were performed in accordance with the Association for Research in Vision and Ophthalmology Statement for the Use of Animals in Ophthalmic and Visual Research and Guidelines for Animal Experimentation of the Animal Care and Committee of Jichi Medical University, which approved all experiments (Study Number: 19030-02). Colonies of male SDT fatty rats (n = 13) and normal SD rats (n = 4) were provided by CLEA Japan, Inc. (Meguro-ku, Tokyo, Japan). All SDT fatty rats were confirmed as being diabetic, with non-fasting blood glucose concentration exceeding 350 mg/dL at 8 weeks after birth. Pemafibrate was provided by Kowa Co., Ltd. (Chuo-ku, Tokyo, Japan). SDT fatty rats were fed a diet supplemented with pemafibrate (0.3 mg/kg/d) for 16 weeks, starting at 8 weeks of age (Pf SDT fatty: study group), or with normal chow (SDT fatty: controls). The SD rats were fed normal chow (SD: normal untreated controls). The eyes of the Pf SDT fatty, SDT fatty, and SD groups were enucleated at 24 weeks of age (n = 7, 6, and 4, respectively). One eye per rat was assessed.
Measurement of Food Consumption, Body Weight, and Blood Glucose and Hemoglobin (Hb)A1c LevelsFood consumption, body weight, and blood glucose level were measured every 2 weeks, and glycated hemoglobin (HbA1c) level was measured every 4 weeks from 8 to 24 weeks in each rat group. Blood samples were collected from the tail veins of non-fasting rats. The glucose and HbA1c levels were measured using commercial kits (StatStrip Xpress Glucose/Ketone Meter, Nova Biomedical, Waltham, MA, U.S.A.) and an automatic analyzer (Hitachi 7170, Hitachi High-Tech Corp., Minato-ku, Tokyo, Japan), respectively.
Measurement of Blood Chemistry ParametersBlood chemistry parameters, including insulin, TG, total cholesterol (TC), high-density lipoprotein cholesterol (HDL-C), aspartate transaminase (AST), alanine transaminase (ALT), γ-glutamyl transpeptidase (γ-GTP), blood urea nitrogen (BUN), and creatinine (CRE) levels, were measured when each rat was sacrificed. Serum insulin level was measured using a rat insulin enzyme-linked immunosorbent assay kit (Morinaga Institute of Biological Science, Yokohama, Kanagawa, Japan) and an absorbance microplate reader (MTP-300 Microplate Reader; Corona Electric Co., Ltd., Hitachinaka, Ibaraki, Japan). Other parameters were measured using an automatic analyzer (Hitachi 7180, Hitachi High-Tech Corp.).
Electroretinography (ERG)ERG was performed to evaluate retinal neural function at 8 and 24 weeks of age in each rat group under general anesthesia, using a combination of medetomidine hydrochloride, midazolam, and butorphanol tartrate (MMB). The MMB anesthetic agent contained midazolam (2.0 mg/kg, Sandoz, Tokyo, Japan), medetomidine (0.375 mg/kg, Nippon Zenyaku Kogyo Co., Ltd., Fukushima, Japan), and butorphanol tartrate (2.5 mg/kg, Meiji Seika Pharma, Tokyo, Japan). MMB was prepared by mixing the drug with physiological saline. We administered 0.5 mL of purified MMB per 100 g of rat body weight by intraperitoneal administration.28) If a significant anesthetic effect was not obtained with the initial dose of 0.5 mL/100 g, the dose was increased by 20% (e.g., body weight 600 g = initial amount of anesthetic of 3.0 mL, followed by additional amount of anesthesia of 0.6 mL). After completion of the ERG recording at 8 weeks of age, a medetomidine antagonist (0.5 mL of medetomidine antagonist per 100 g of rat body weight) was administered to awaken the animals. Full-field ERG responses were recorded using a Ganzfeld dome, an acquisition system, and light-emitting diode stimulators (PuREC; MAYO Corporation, Inazawa, Japan). ERG was conducted at 8 and 24 weeks of age after overnight dark adaptation. The animals were fasted prior to general anesthesia. General anesthesia was induced under dim red light. Mydriasis was induced using a mixture of 0.5% phenylephrine hydrochloride and 0.5% tropicamide (Santen Pharmaceutical Co., Ltd., Osaka, Japan). Active electrodes were applied to the eyes using contact lenses, and reference electrodes were placed in the mouth of the animals. An electrode clipped to the tail served as the ground connection.
Ocular HistopathologyAfter completion of the ERG recording at 24 weeks of age under deep MMB anesthesia, the eyes were enucleated for conventional histopathological studies and placed in a fixative (Super Fix KY-500, Kurabo Industries Ltd., Chuo-ku, Osaka, Japan). The fixed eyes were washed with 0.1% cacodylate buffer and embedded in paraffin. The paraffin blocks were cut into 4-µm sections and stained with hematoxylin–eosin (H&E) for conventional histopathological examination. The immunohistochemical procedures were based on the standard avidin-biotin horseradish peroxidase method using each antibody and performed with 3,3′diaminobenzidine substrate-chromogen. Aquaporin-4 (AQP4) rabbit polyclonal antibody (Cell Signaling Technology, Inc., Danvers, MA, U.S.A.) and VEGF rabbit polyclonal antibody (Proteintech Group, Inc., Rosemont, IL, U.S.A.) were used at a dilution of 1 : 200 as the primary antibody.
Measurement of Retinal Thickness, Retinal Folds, and Choroidal ThicknessTo quantify the pathological features of the specimens, we used the BZ-X700 digital microscope system (Keyence Corp., Higashiyodogawa-ku, Osaka, Japan). A high-resolution image of the entire specimen stained with H&E was created using the BZ-H3XD image stitching system (Keyence Corp.). Retinal thickness, number of retinal folds, and choroidal thickness were evaluated. Total retinal thickness was defined as the distance between the retinal internal limiting membrane and the photoreceptor layer (PL). The mean retinal and choroidal thicknesses were measured at 500, 1000, and 1500 microns from the optic disc. The number of retinal folds, defined as deformations from the outer nuclear layer (ONL) to the PL, was measured within 1500 microns of the optic disc.
Measurement of Immunostained AQP4 and VEGF RegionsQuantitative analyses of the AQP4- and VEGF-positive regions, which we referred to as immunopositive regions, were performed using the Hybrid Cell Count Module/BZ-H3C software (Keyence Corp.). The entire specimen was marked with a magenta stain, and the immunopositive regions were marked in dark blue. The color coding of immunopositive and immunonegative regions can be freely selected using this software. The ratio of the immunopositive areas to the area of the entire specimen was automatically calculated for each specimen.
Statistical AnalysisThe parameter measurements are expressed as mean ± standard deviation (S.D.). For statistical analysis, we used the Bell Curve for Excel software (Social Survey Research Information Co., Ltd., Tokyo, Japan). Mann–Whitney U-test and Scheffe’s test were used for the numerical parameter testing of non-normal distribution. p < 0.05 was considered to indicate statistical significance.
RESULTS
Changes in Biological ParametersFood Consumption, Body Weight, and Blood Glucose and HbA1c LevelsFigure 1 shows changes in food consumption, body weight, and blood glucose and HbA1c levels. Little difference was observed in each of these parameters between the Pf SDT fatty and SDT fatty rats.
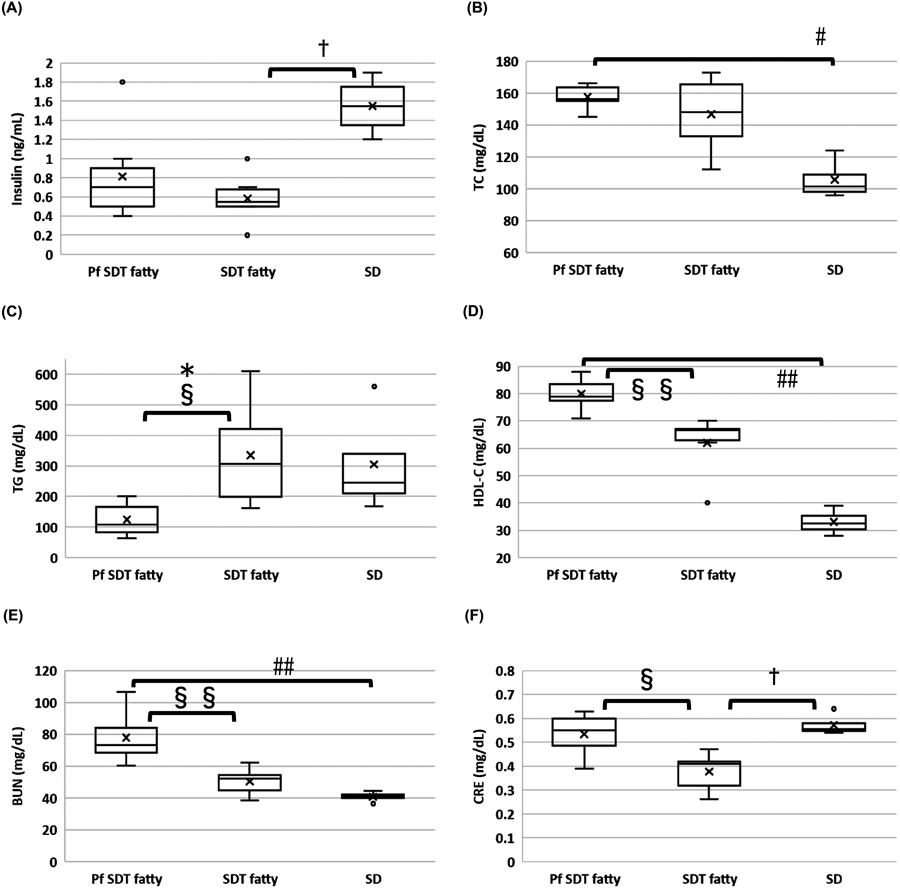
Blood Insulin, TG, TC, HDL-C, AST, ALT, γ-GTP, BUN, and CRE LevelsFigure 2 shows the blood insulin, TG, TC, HDL-C, BUN, and CRE levels for each rat type at 24 weeks of age. No significant differences were observed in blood insulin and TC levels between the Pf SDT and SDT fatty rats. In contrast, the mean TG levels in the Pf SDT fatty rats were significantly lower than those in the SDT fatty rats (p < 0.05, Mann–Whitney U-test). The mean HDL-C levels in the Pf SDT fatty rats were higher than those in the SDT fatty rats (p < 0.01, Mann–Whitney U-test). The serum levels of AST, ALT, and GTP were not significantly different between the Pf SDT and SDT rats (data not shown). Compared to the SDT fatty rats, the Pf SDT fatty rats had higher BUN (p < 0.01, Mann–Whitney U-test) and CRE (p < 0.05, Mann–Whitney U-test) levels.
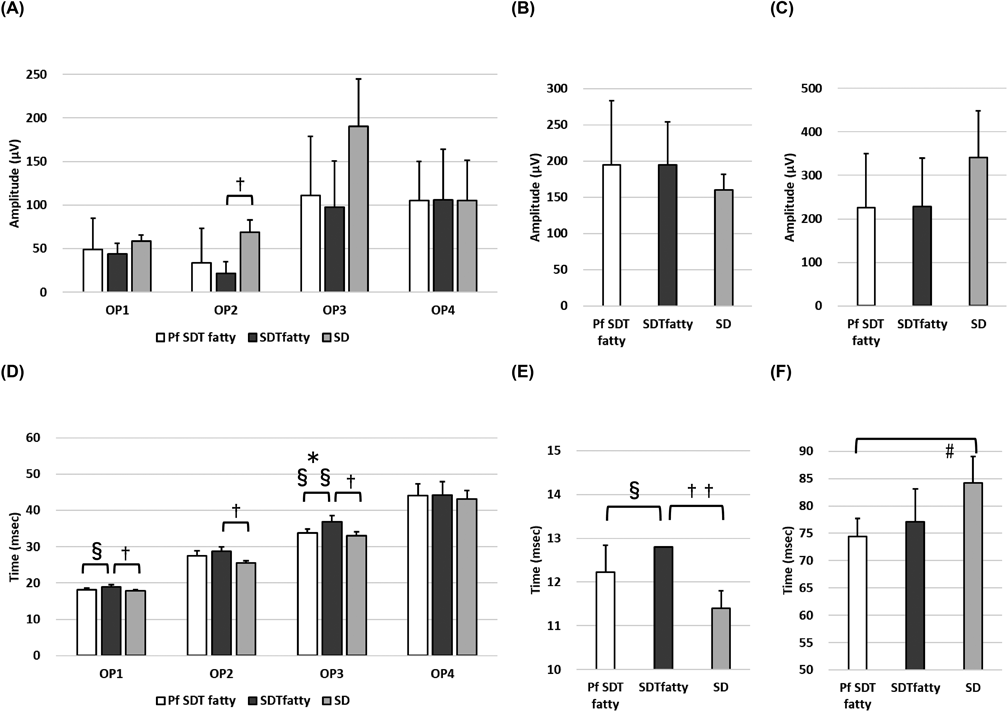
ERGFigure 3 shows the representative ERG waveforms for each rat type at 8 and 24 weeks of age. Figure 4 shows the amplitude and peak time of oscillatory potential (OP)1–OP4, a wave, and b wave in each rat group at 24 weeks of age. No significant difference was noted in the amplitude between the Pf SDT and SDT fatty groups. In contrast, the extension of OP1 and OP3 waves during the peak time was suppressed in the Pf SDT fatty group. The mean OP1 peak times in the Pf SDT fatty group and SDT fatty group, respectively, were 18.2 ± 0.4 ms and 18.9 ± 0.7 ms (Pf SDT fatty group vs. SDT fatty group, p < 0.05, Mann–Whitney U-test). The mean OP3 peak times in the Pf SDT fatty group and SDT fatty group, respectively, were 33.8 ± 1.1 ms and 36.9 ± 1.7 ms (Pf SDT fatty group vs. SDT fatty group, p < 0.05 by Mann–Whitney U-test).
Retinal Thickness, Retinal Folds, and Choroidal ThicknessFigure 5 shows the retinal and choroidal thicknesses. The retinas at 1500 microns from the optic disc were thinner in the Pf SDT fatty group than in the SDT fatty group. The mean retinal thicknesses at 1500 microns from the optic disc in the Pf SDT fatty group and SDT fatty group were 149.0 ± 9.0 and 163.3 ± 8.2 microns, respectively (Pf SDT fatty group vs. SDT fatty group, p < 0.05 by Mann–Whitney U-test). The choroidal thickness did not differ significantly between the Pf SDT and SDT fatty groups. Figure 6 shows the number of retinal folds. The mean numbers of retinal folds in the Pf SDT fatty group, SDT fatty group, and SD rats, respectively, were 0.9 ± 1.1, 2.3 ± 2.0, and 0 ± 0 (Pf SDT fatty group vs. SDT fatty group, p = 0.16 by Mann–Whitney U-test). The retinal folds in the Pf SDT fatty group tended to be less prominent than those in the SDT fatty group, although no significant differences were noted between them. No retinal folds had developed in the SD rats.
Immunostained AQP4 and VEGF RegionsFigures 7A and B show the areas of AQP4 and VEGF immunostaining, respectively, in each rat group. Figures 7C and D show the mean area ratio of immunostained AQP4 and VEGF, respectively. This indicates that the AQP4-positive regions in the retinas of the Pf SDT fatty group were significantly larger than those of the SDT fatty group (Pf SDT fatty group vs. SDT fatty group, p < 0.05, Mann–Whitney U-test), whereas no significant differences were observed between the Pf SDT fatty group and SDT fatty group in the VEGF immunostaining.
DISCUSSION
This study aimed to elucidate the protective mechanisms of pemafibrate against DR using an SDT fatty rat model. The involvement of PPARα activation in the retinal protective effect has been suggested.18–24) Therefore, we hypothesize that greater selectivity for PPARα may enhance the efficacy of retinal protection. Additionally, selective activation of PPARα can potentially mitigate side effects. We expected pemafibrate to become a potential therapeutic agent for DR and conducted a series of experiments in SDT fat rats for verification in the present study.
The extension of OP1 and OP3 waves during the peak time was suppressed in the Pf SDT fatty group. The amplitudes of the OP in ERG have been reported to be sensitive to circulatory disorders.29) In the early stages of murine, rat, and human DR, ERG amplitudes are diminished, and OP latencies increase.30,31) In particular, the prolonged OP peak latency in early diabetic eyes without angiographic evidence of angiopathy is thought to originate from certain neuronal disorders that occur in the inner nuclear layer of the retina, especially in the amacrine cells.29,30) In their study evaluating retinal function using ERG, Tomita et al. reported that pemafibrate prevented OP amplitudes from decreasing in streptozotocin (STZ)-induced diabetic mice.32) In the present study, we examined the effects of pemafibrate on DR in SDT fatty rats. Both studies indicate that pemafibrate protects retinal function.
On pathological examination, we found that the retinal thickness at 1500 microns from the optic disc had improved in pemafibrate-administered SDT fatty rats. Quantitative analysis of immunohistochemistry data showed that the immunopositive regions of AQP4 in the retinas were significantly larger in the pemafibrate-treated SDT fatty rats than in the non-treated SDT fatty rats. Müller cell processes surround the retinal vessels in the inner and deep vascular layers. Since the water channel AQP4 is expressed in the perivascular and end-feet of Müller cells and contributes to maintaining water balance in the retinal tissue, AQP4 may be associated with the pathogenesis of DR and macular edema via increased vascular permeability.33) In diabetic rats, AQP4 levels were reduced throughout the inner retina and perivascular areas.34) AQP4 knockdown exacerbated DR in STZ-induced diabetic rats by increasing vascular permeability, retinal thickness, and inflammatory responses.35) Considering these reports, the increased AQP4 expression in the retina indicates that pemafibrate activates Müller cells and is associated with the suppression of diabetic retinal edema. Meanwhile, the AQP4 expression levels in the retinas of 24-week-old SDT fatty rats and SD rats were similar. Regarding AQP4 expression in the retina, studies have reported that AQP4 is elevated or decreased in diabetic model rats compared with that in non-diabetic model rats. The period after induction of diabetes in the reports in which AQP4 expression was decreased was longer than the periods in the reports in which AQP4 expression was increased.34–38) Therefore, AQP4 expression may be temporarily increased as a compensatory change in DR, but it is subsequently downregulated. Although the model rats in those reports were different from those in our study, it is possible that the AQP4 expression level in the 24-week-old SDT fatty group decreased to the same level as in the non-diabetic rats. We wish we could have increased the observation points and the number of animals in this study. The AQP4 expression level in the Pf SDT fatty group was higher than that in the age-matched control group, and this may be effective in regulating edema. Similar to previous studies, we also performed immunostaining on GFAP and Alb specimens in addition to AQP4 and VEGF but found no significant differences between the Pf SDT fatty group and SDT fatty group in the present study (data not shown). In our previous study, we evaluated pathological changes in the retinas of SDT fatty rats at 8, 16, 24, 32, and 40 weeks of age. At 24 weeks of age, peaks in retinal thickness and the numbers of retinal folds were observed, accompanied by an increase in GFAP and VEGF immunopositive regions, as indicated by quantitative analysis.27) Therefore, we deemed it sufficient to assess DR in SDT fatty rats at 24 weeks of age. Thus, rats of 24 weeks of age rats were selected for the present study. However, the GFAP and VEGF immunopositive regions in the retinas of SDT fatty rats at 40 weeks of age were larger than those at 24 weeks.27) Consequently, examining rats at 40 weeks of age could have shown higher GFAP and VEGF expression in the SDT fatty (control) group, potentially revealing the suppressive effect of pemafibrate.
Regarding the effect of PPARα on AQP4, both are expressed in Müller cells.21,33) Previous studies have also reported that diabetes leads to dysfunction in Müller cells.39,40) Untreated db/db mice exhibited significant decreases in PPAR-α and AQP4 expression, along with increases in GFAP expression compared with that exhibited by non-diabetic db/m mice. Fenofibrate nano-eyedrops elevated PPAR-α and AQP4 expression while reducing GFAP levels, as detected by immunofluorescence in diabetic db/db mice treated with vehicle eyedrops.41) Unfortunately, our study did not show a significant decrease in GFAP expression in the Pf SDT fatty group, suggesting reduced gliosis in DR. Thus, while further verification of GFAP expression at 40 weeks of age is warranted, there is a possibility that pemafibrate can prevent Müller cell dysfunction and increase AQP4 expression through PPARα, potentially regulating edema.
In order to apply this remedy to clinical use, we want to determine how pemafibrate is effective in DR. Enzyme-linked immunosorbent assay and mRNA are the gold standards for the quantitative measurement of proteins in organs. However, quantitative analysis can be performed to some extent by quantitative analysis of immunostaining.42) Since immunostaining can indicate the localization of protein expression, an increase in the expression area is usually thought to indicate an increase in the concentration of that protein.
We previously reported that the outer retinal folds in SDT fatty rats develop earlier and are more severe than those in SDT rats.27) In the previous and current studies, retinal folds were defined as deformations observed from the ONL to the PL that did not include the entire retinal layer. Fibrous proliferation and tractional changes have been reported at 70 weeks of age in SDT rats, including the entire retinal layer.43) These changes are usually observed in older SDT rats. The rats in the current study were too young to have tractional changes derived from the preretinal membranes. It is reported that outer retinal folds in SDT fatty rats are prevented by phlorizin, ipragliflozin, and sodium-glucose cotransporter inhibitors.44,45) Similar outer retinal folds have been reported in experimental autoimmune uveoretinitis in rats and mice.46) Therefore, outer retinal folds may be a phenomenon associated with DR, resulting from volume changes due to edema and/or inflammation in the retina. The retinal folds in the Pf SDT fatty group tended to be less pronounced compared to those in the SDT fatty group, although no significant differences were noted between them. If the numbers of experimental rats are increased, significant differences may be observed for these groups.
The dose in the study group was determined according to the results of preliminary studies investigating the toxicity caused by repeated administration of pemafibrate in SD rats. When the SD rats were fed a diet supplemented with over 0.3 mg/kg/d pemafibrate for 26 weeks or over 1.0 mg/kg/d pemafibrate for 13 weeks, liver and kidney disorders were reported. Based on these results, we selected a dose of 0.3 mg/kg/d. However, even at a dose of 0.3 mg/kg/d, pemafibrate likely induced kidney disorders to some extent. Due to budgetary constraints, we could not study other doses or methods of pemafibrate treatment. However, considering ERG results, we found that pemafibrate (0.3 mg/kg/d) protected retinal function. While pemafibrate should be avoided in patients with renal dysfunction, it may prove clinically beneficial in preventing the onset and progression of DR in patients without renal dysfunction. Alternatively, topical treatments such as eye drops could offer potential benefits.
In conclusion, extension of the OP wave was suppressed in the Pf SDT fatty group in the present study. Although food consumption and blood glucose levels did not change after pemafibrate administration, the ERG data showed that pemafibrate protected retinal function. Therefore, pemafibrate is thought to be effective in suppressing the onset and progression of DR through mechanisms other than improving blood glucose levels. These results suggest that pemafibrate has a protective effect against DR. We would like to continue our research to elucidate the mechanism of the effects of this drug on DR.
Acknowledgments
The authors thank Yoko Noguchi and Tomie Sakamoto for their assistance with this study.
Funding
Yoshiaki Tanaka received support for this work in part by Alcon Japan Research Grants 2019. Toshikatsu Kaburaki received support for this work in part by Grant-in-Aid for Scientific Research from the Japan Society for the Promotion of Science (KAKENHI No.21K09681). The funders had no role in study design, data collection and analysis, decision to publish, or preparation of the manuscript.
Conflict of Interest
Masami Shinohara and Yasushi Kageyama are employees of CLEA Japan, Inc. Tomohiko Sasase is an employee of Japan Tobacco Inc. Jota Amarume is an employee of Kowa Company Ltd. Masami Shinohara, Yasushi Kageyama, Tomohiko Sasase, and Jota Amarume did not participate in protocol design or data analysis. The authors declare no conflict of interest regarding the publication of this paper.
Data Availability
The data used to support the findings of this study have been included in this article.
REFERENCES
- 1) Yau JW, Rogers SL, Kawasaki R, et al. Global prevalence and major risk factors of diabetic retinopathy. Diabetes Care, 35, 556–564 (2012).
- 2) Teo ZL, Tham YC, Yu M, Chee ML, Rim TH, Cheung N, Bikbov MM, Wang YX, Tang Y, Lu Y, Wong IY, Ting DSW, Tan GSW, Jonas JB, Sabanayagam C, Wong TY, Cheng CY. Global prevalence of diabetic retinopathy and projection of burden through 2045: systematic review and meta-analysis. Ophthalmology, 128, 1580–1591 (2021).
- 3) Ogurtsova K, da Rocha Fernandes JD, Huang Y, Linnenkamp U, Guariguata L, Cho NH, Cavan D, Shaw JE, Makaroff LE. IDF diabetes atlas: global estimates for the prevalence of diabetes for 2015 and 2040. Diabetes Res. Clin. Pract., 128, 40–50 (2017).
- 4) Leasher JL, Bourne RR, Flaxman SR, Jonas JB, Keeffe J, Naidoo K, Pesudovs K, Price H, White RA, Wong TY, Resnikoff S, Taylor HR. Global estimates on the number of people blind or visually impaired by diabetic retinopathy: a meta-analysis from 1990 to 2010. Diabetes Care, 39, 1643–1649 (2016).
- 5) Hammes HP. Optimal treatment of diabetic retinopathy. Ther. Adv. Endocrinol. Metab., 4, 61–71 (2013).
- 6) Najib J. Fenofibrate in the treatment of dyslipidemia: a review of the data as they relate to the new suprabioavailable tablet formulation. Clin. Ther., 24, 2022–2050 (2002).
- 7) Keech AC, Mitchell P, Summanen PA, O’Day J, Davis TM, Moffitt MS, Taskinen MR, Simes RJ, Tse D, Williamson E, Merrifield A, Laatikainen LT, d’Emden MC, Crimet DC, O’Connell RL, Colman PG. Effect of fenofibrate on the need for laser treatment for diabetic retinopathy (FIELD study): a randomised controlled trial. Lancet, 370, 1687–1697 (2007).
- 8) Chew EY, Davis MD, Danis RP, Lovato JF, Perdue LH, Greven C, Genuth S, Goff DC, Leiter LA, Ismail-Beigi F, Ambrosius WT. The effects of medical management on the progression of diabetic retinopathy in persons with type 2 diabetes: the Action to Control Cardiovascular Risk in Diabetes (ACCORD) Eye Study. Ophthalmology, 121, 2443–2451 (2014).
- 9) Davidson MH, Armani A, McKenney JM, Jacobson TA. Safety considerations with fibrate therapy. Am. J. Cardiol., 99 (6A), 3C–18C (2007).
- 10) Emami F, Hariri A, Matinfar M, Nematbakhsh M. Fenofibrate-induced renal dysfunction, yes or no? J. Res. Med. Sci., 25, 39 (2020).
- 11) Yamashita S, Masuda D, Matsuzawa Y. Pemafibrate, a new selective PPARα modulator: drug concept and its clinical applications for dyslipidemia and metabolic diseases. Curr. Atheroscler. Rep., 22, 5 (2020).
- 12) Fruchart JC. Selective peroxisome proliferator-activated receptor α modulators (SPPARMα): the next generation of peroxisome proliferator-activated receptor α-agonists. Cardiovasc. Diabetol., 12, 82 (2013).
- 13) Raza-Iqbal S, Tanaka T, Anai M, Inagaki T, Matsumura Y, Ikeda K, Taguchi A, Gonzalez FJ, Sakai J, Kodama T. Transcriptome analysis of K-877 (a novel selective PPARα modulator (SPPARMα))-regulated genes in primary human hepatocytes and the mouse liver. J. Atheroscler. Thromb., 22, 754–772 (2015).
- 14) Fruchart JC. Pemafibrate (K-877), a novel selective peroxisome proliferator-activated receptor alpha modulator for management of atherogenic dyslipidaemia. Cardiovasc. Diabetol., 16, 124 (2017).
- 15) Sasaki Y, Raza-Iqbal S, Tanaka T, Murakami K, Anai M, Osawa T, Matsumura Y, Sakai J, Kodama T. Gene expression profiles induced by a novel selective peroxisome proliferator-activated receptor α modulator (SPPARMα) pemafibrate. Int. J. Mol. Sci., 20, 5682 (2019).
- 16) Tomida J, Sato T, Yoshida T, Senda S, Nakatsuma A, Iihara N. Statin, ezetimibe, or fibrate initiation and subsequent use for the primary and secondary prevention of cardiovascular diseases among Japanese patients aged ≥55 years: a nationwide cohort study. Biol. Pharm. Bull., 46, 1548–1557 (2023).
- 17) Ishibashi S, Arai H, Yokote K, Araki E, Suganami H, Yamashita S. Efficacy and safety of pemafibrate (K-877), a selective peroxisome proliferator-activated receptor α modulator, in patients with dyslipidemia: Results from a 24-week, randomized, double blind, active-controlled, phase 3 trial. J. Clin. Lipidol., 12, 173–184 (2018).
- 18) Lefebvre P, Chinetti G, Fruchart JC, Staels B. Sorting out the roles of PPAR α in energy metabolism and vascular homeostasis. J. Clin. Invest., 116, 571–580 (2006).
- 19) Desouza CV, Rentschler L, Fonseca V. Peroxisome proliferator-activated receptors as stimulants of angiogenesis in cardiovascular disease and diabetes. Diabetes Metab. Syndr. Obes., 2, 165–172 (2009).
- 20) Wang F, Gao L, Gong B, Hu J, Li M, Guan Q, Zhao J. Tissue-specific expression of PPAR mRNAs in diabetic rats and divergent effects of cilostazol. Can. J. Physiol. Pharmacol., 86, 465–471 (2008).
- 21) Hu Y, Chen Y, Ding L, He X, Takahashi Y, Gao Y, Shen W, Cheng R, Chen Q, Qi X, Boulton ME, Ma JX. Pathogenic role of diabetes-induced PPAR-α down-regulation in microvascular dysfunction. Proc. Natl. Acad. Sci. U.S.A., 110, 15401–15406 (2013).
- 22) Ding L, Cheng R, Hu Y, Takahashi Y, Jenkins AJ, Keech AC, Humphries KM, Gu X, Elliott MH, Xia X, Ma JX. Peroxisome proliferator-activated receptor α protects capillary pericytes in the retina. Am. J. Pathol., 184, 2709–2720 (2014).
- 23) Moran E, Ding L, Wang Z, Cheng R, Chen Q, Moore R, Takahashi Y, Ma JX. Protective and antioxidant effects of PPARα in the ischemic retina. Invest. Ophthalmol. Vis. Sci., 55, 4568–4576 (2014).
- 24) Tomita Y, Ozawa N, Miwa Y, Ishida A, Ohta M, Tsubota K, Kurihara T. Pemafibrate prevents retinal pathological neovascularization by increasing FGF21 level in a murine oxygen-induced retinopathy model. Int. J. Mol. Sci., 20, 5878 (2019).
- 25) Matsui K, Ohta T, Oda T, Sasase T, Ueda N, Miyajima K, Masuyama T, Shinohara M, Matsushita M. Diabetes-associated complications in Spontaneously Diabetic Torii fatty rats. Exp. Anim., 57, 111–121 (2008).
- 26) Motohashi Y, Kemmochi Y, Maekawa T, Tadaki H, Sasase T, Tanaka Y, Kakehashi A, Yamada T, Ohta T. Diabetic macular edema-like ocular lesions in male spontaneously diabetic torii fatty rats. Physiol. Res., 67, 423–432 (2018).
- 27) Tanaka Y, Takagi R, Ohta T, Sasase T, Kobayashi M, Toyoda F, Shimmura M, Kinoshita N, Takano H, Kakehashi A. Pathological features of diabetic retinopathy in Spontaneously Diabetic Torii fatty rats. J. Diabetes Res., 2019, 8724818 (2019).
- 28) Kawai S, Takagi Y, Kaneko S, Kurosawa T. Effect of three types of mixed anesthetic agents alternate to ketamine in mice. Exp. Anim., 60, 481–487 (2011).
- 29) Yonemura D, Aoki T, Tsuzuki K. Electroretinogram in diabetic retinopathy. Arch. Ophthalmol., 68, 19–24 (1962).
- 30) Shirao Y, Kawasaki K. Electrical responses from diabetic retina. Prog. Retin. Eye Res., 17, 59–76 (1998).
- 31) Sergeys J, Etienne I, Van Hove I, Lefevere E, Stalmans I, Feyen JHM, Moons L, Van Bergen T. Longitudinal in vivo characterization of the streptozotocin-induced diabetic mouse model: focus on early inner retinal responses. Invest. Ophthalmol. Vis. Sci., 60, 807–822 (2019).
- 32) Tomita Y, Lee D, Miwa Y, Jiang X, Ohta M, Tsubota K, Kurihara T. Pemafibrate protects against retinal dysfunction in a murine model of diabetic retinopathy. Int. J. Mol. Sci., 21, 6243 (2020).
- 33) Spaide RF. Retinal vascular cystoid macular edema: review and new theory. Retina, 36, 1823–1842 (2016).
- 34) Curtis TM, Hamilton R, Yong PH, McVicar CM, Berner A, Pringle R, Uchida K, Nagai R, Brockbank S, Stitt AW. Müller glial dysfunction during diabetic retinopathy in rats is linked to accumulation of advanced glycation end-products and advanced lipoxidation end-products. Diabetologia, 54, 690–698 (2011).
- 35) Cui B, Sun JH, Xiang FF, Liu L, Li WJ. Aquaporin 4 knockdown exacerbates streptozotocin-induced diabetic retinopathy through aggravating inflammatory response. Exp. Eye Res., 98, 37–43 (2012).
- 36) Wang T, Zhang C, Xie H, Jiang M, Tian H, Lu L, Xu GT, Liu L, Zhang J. Anti-VEGF therapy prevents Müller intracellular edema by decreasing VEGF-A in diabetic retinopathy. Eye Vis. (Lond.), 8, 13 (2021).
- 37) Zhang Y, Xu G, Ling Q, Da C. Expression of aquaporin 4 and Kir4.1 in diabetic rat retina: treatment with minocycline. J. Int. Med. Res., 39, 464–479 (2011).
- 38) Kida T, Oku H, Horie T, Fukumoto M, Okuda Y, Morishita S, Ikeda T. Implication of VEGF and aquaporin 4 mediating Müller cell swelling to diabetic retinal edema. Graefes Arch. Clin. Exp. Ophthalmol., 255, 1149–1157 (2017).
- 39) Li Q, Puro DG. Diabetes-induced dysfunction of the glutamate transporter in retinal Müller cells. Invest. Ophthalmol. Vis. Sci., 43, 3109–3116 (2002). https://iovs.arvojournals.org/article.aspx?articleid=2162845
- 40) Dimmeler S, Fleming I, Fisslthaler B, Hermann C, Busse R, Zeiher AM. Activation of nitric oxide synthase in endothelial cells by Akt-dependent phosphorylation. Nature, 399, 601–605 (1999).
- 41) Hanaguri J, Nagai N, Yokota H, Kushiyama A, Watanabe M, Yamagami S, Nagaoka T. Fenofibrate nano-eyedrops ameliorate retinal blood flow dysregulation and neurovascular coupling in type 2 diabetic mice. Pharmaceutics, 14, 384 (2022).
- 42) Taylor CR. Quantitative in situ proteomics; a proposed pathway for quantification of immunohistochemistry at the light-microscopic level. Cell Tissue Res., 360, 109–120 (2015).
- 43) Shinohara M, Masuyama T, Shoda T, Takahashi T, Katsuda Y, Komeda K, Kuroki M, Kakehashi A, Kanazawa Y. A new spontaneously diabetic non-obese Torii rat strain with severe ocular complications. Int. J. Exp. Diabetes Res., 1, 89–100 (2000).
- 44) Katsuda Y, Sasase T, Tadaki H, Mera Y, Motohashi Y, Kemmochi Y, Toyoda K, Kakimoto K, Kume S, Ohta T. Contribution of hyperglycemia on diabetic complications in obese type 2 diabetic SDT fatty rats: effects of SGLT inhibitor phlorizin. Exp. Anim., 64, 161–169 (2015).
- 45) Takakura S, Toyoshi T, Hayashizaki Y, Takasu T. Effect of ipragliflozin, an SGLT2 inhibitor, on progression of diabetic microvascular complications in Spontaneously Diabetic Torii fatty rats. Life Sci., 147, 125–131 (2016).
- 46) Caspi RR. Experimental autoimmune uveoretinitis in the rat and mouse. Curr. Protoc. Immunol., 53, 15.6.1–15.6.20 (2003).