Abstract
Taguchi et al. reported that postmenstrual age (PMA) is a promising factor in describing and understanding the developmental change of caffeine (CAF) clearance. The aim of the present study was to quantify how developmental changes occur and to determine the effect of the length of the gestational period on CAF clearance. We performed a nonlinear mixed effect model (NONMEM) analysis and evaluated the fit of six models. A total of 115 samples were obtained from 52 patients with a mean age of 34.3 ± 18.2 d. The median values of gestational age (GA) and postnatal age (PNA) were 196 and 31 d, respectively. Serum CAF levels corrected for dose per body surface area (BSA) (C/D ratioBSA) were dependent on PMA rather than PNA, which supports the findings of a previous study. NONMEM analysis provided the following final model of oral clearance: CL/F = 0.00603∙WT∙ ∙0.877GA ≤ 196 L/h. This model takes into account developmental changes during prenatal and postnatal periods separately. The model successfully described the variation in clearance of CAF. Our findings suggest that the dosage of CAF in preterm infants should be determined based not only on body weight (WT) but also on both PNA and GA.
INTRODUCTION
Caffeine (CAF) is one of the most frequently prescribed drugs for treatment of apnea of prematurity which commonly occurs in newborns with preterm defined as birth before 37 gestational weeks. CAF is considered relatively safe and easy to use compared to other xanthine derivatives with its long elimination half-life and few adverse events.1,2) The standard treatment of CAF is 10 mg/kg for loading dose followed by 2.5–5 mg/kg for maintenance dose.3) However, the effects of CAF may vary depending on the patient, especially their degree of growth. Koch et al.4) reported a relationship between the effectiveness of CAF on sleep-wake behavior and the prenatal period. They reported that the amount of active sleep decreased (56.9 to 38.2%) and wakefulness increased (22.8 to 45.8%) on the fifth day of life (with sufficient CAF concentration) compared to the first day with low CAF concentration for a group with gestational age (GA) ≥ 28 weeks.4)
In adults, CAF is mainly metabolized to paraxanthine, theophylline, and theobromine in the liver by CYP1A2, and less than 2% of the dose is eliminated unchanged in urine.5) In contrast to adults, CAF is only slightly excreted unchanged in urine in both preterm and full-term newborns because of the absence of hepatic expressions of CYP1A2.6,7) In premature and low birth weight infants, it may be reasonable to use an index of early development to understand and describe developmental changes. Koch et al.8) simulated dosing strategies to ensure stable CAF concentrations in preterm neonates despite changes in CAF clearance during the first 8 weeks of life. They reported a shortened elimination half-life (t1/2) of CAF at postnatal age (PNA) = 28 d (86 h) compared to that at PNA = 7 d (112 h). Hence, they proposed that the maintenance dose of CAF citrate needs to be increased by 1 mg/kg every 1–2 weeks. However, their simulations were only performed for a typical neonate with a birth weight of 1150 g (corresponding to GA 28 weeks).
Taguchi et al.9) found considerable interindividual variability of serum CAF concentration in 23 routinely treated Japanese preterm infants receiving standard CAF treatment. Interestingly, serum concentration correlated by dose per body surface area (BSA) (C/D ratioBSA) of CAF decreased with increasing age. In particular, C/D ratio had better correlation with postmenstrual age (PMA), which is counted continuously after the last menstruation, than PNA (correlation coefficient [R] = 0.582 vs. 0.396).9) These findings partly support a previous study by Gao et al.10) that reported that CAF clearance was positively related to current body weight (WT) and PMA based on population pharmacokinetic (PPK) analysis. Thus, the clearance model of CAF with PMA as a covariate was significant compared to the model with PNA (objective function (OBJ) = 750.107 vs. 758.961).10) These studies suggest the importance of considering the gestational period of preterm infants in CAF treatment for apnea.
In the present study, we aimed to quantitatively describe the clearance of CAF and its relationship with developmental changes before and after birth. Therefore, we performed PPK analysis using the NONlinear Mixed Effects Modeling (NONMEM) program.
MATERIALS AND METHODS
MaterialsCAF citrate was purchased from FUJIFILM Wako Pure Chemical Corporation (Osaka, Japan). CAF-d9 was purchased from Nacalai Tesque (Kyoto, Japan).
Patients and Blood SamplingThis was an exploratory retrospective study. We collected a total of 52 preterm infants, including 23 infants who participated in the previous study.9) The patients with comorbidities are often observed; respiratory distress syndrome (n = 40), patent ductus arteriosus (n = 32), intraventricular hemorrhage (n = 14), twin-to-twin transfusion syndrome (n = 3), congenital heart disease (n = 1), atrio-ventricular septal defect (n = 1) or peritonitis secondary to localized gastrointestinal perforation (n = 1). The selection criteria, the clinical situation of the patients, and the method of blood sampling were the same as previously reported.9) Preterm infants born and admitted to the neonatal intensive care unit (NICU) of Toyama University Hospital with apnea of prematurity and meeting indications for CAF treatment were included in this study. Exclusion criteria were those with severe congenital abnormality, significant liver impairment (serum alanine aminotransferase (ALT) greater than three times the upper limit of the normal range) and concomitant use of indomethacin. Maternal complications were not exclusion criteria. Apnea of prematurity was defined as cessation of breathing that lasted more than 20 s and was accompanied by hypoxia or bradycardia without any other apparent cause of apnea. Patients were routinely treated with CAF, and the dose of the drug was adjusted based solely on clinical grounds. A loading dose of 10 mg/kg of CAF base (20 mg/kg of CAF citrate) was administered intravenously, followed by a maintenance dose of 2.5–5 mg/kg/d (5–10 mg/kg/d of CAF citrate) administered either intravenously or orally as usual in our NICU. To minimize the burden of blood sampling, we used residual serum samples after biochemical tests, including ALT, aspartate aminotransferase (AST), cystatin C (Cys-C), and creatinine levels after day 6 of CAF treatment. Blood samples were routinely drawn just before the CAF treatment from February 2015 to June 2020 and stored at −80 °C until use. Although, the exact time between administration and blood sampling was not constant in each measurement, the serum concentration of CAF could be relatively stable throughout the day due to its long half-life in newborn infants. The study was approved by the Ethics Committee of the University of Toyama (#RIN28-168) and the parents gave written informed consent to participate.
Assay of CAFThe assay for determining serum CAF concentration was reported in a previous study.9) Briefly, serum concentrations of CAF were determined using a Thermo Fisher Accela LC system (Thermo Fisher Scientific, Yokohama, Japan) coupled to an LTQ-Orbitrap XL ETS system (Thermo Fisher Scientific). Sample preparation was performed by solid-phase extraction with an Oasis® HLB cartridge (Waters, Milford, MA, U.S.A.) as reported by Kuwayama et al.11) with minor modifications. Fifty-five microliters of serum samples were mixed with 990 µL of distilled water and 55 µL of CAF-d9 (0.05 µg/mL), and then loaded onto an Oasis® HLB cartridge. Analytes were eluted with 2.5 mL acetonitrile and evaporated to dryness at 45 °C with a SpeedVac® system (Savant, Farmingdale, NY, U.S.A.). The dried analytes were reconstituted with 200 µL of mobile phase containing CAF-d9 and phenacetin as internal standards. The 15 µL of the sample was injected into an Inertsil® HPLC Column (4.6 × 150 mm i.d.; Ph-35 µm particle size; GL Sciences, Tokyo, Japan). The mobile phase was 0.1% formic acid and methanol with 2% tetrahydrofuran (30 : 70 (v/v)). The flow rate was 800 µL/min and the total run time was 5.5 min with a column temperature of 40 °C. CAF was detected by MS/MS with electrospray ionization. Positive selected reaction monitoring was based on the transition of m/z 195.2 > 138.2 for CAF and 204.2 > 144.1 for CAF-d9.11,12) Peak areas were calculated using Qualbrowser® software (Thermo Fisher Scientific). The coefficient of inter-day variation for this assay of CAF was 10.6 and 11.1% at concentrations of calibration lower limit (0.02 mg/L) and upper limit (40 mg/L), respectively. The assay was linear within the range.
PPK AnalysisSoftwarePPK analyses were performed using NONMEM software version 7.5.1.13) The first-order conditional estimation (FOCE) method was used to construct the model, and the additive error model was selected as the error model through the all model run. The example of NONMEM control stream was provided in the Supplementary Fig. 1.
Model DevelopmentDue to the rapid absorption rate and the very long elimination half-life of CAF in newborn infants,6,7,14) the present analysis considered no absorption phase and constant serum concentration at steady-state. The serum concentration of CAF at steady-state (Css) was modeled using the following equation:
 | (1) |
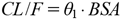
Where DDij is the daily dose for the j th serum concentration of the i th patient (Cssij); εij is a random variable that describes intraindividual variability for Cssij with a mean of 0 and variance of σ2; and CL/Fi is the oral clearance (CL/F) in the i th individual. Covariate screening was conducted based on previous studies that reported that C/D ratios using BSA to standardize CAF doses correlated well with patients’ PMA. We defined the simplest model (Model 1) as the CL/F of CAF per BSA:
 | (2) |
Where θ1 is the predicted population mean of CL/F, BSAi is the individual body surface area, and ηi is a random variable representing inter-individual variation that follows a normal distribution with mean 0 and variance ω2. BSA is determined by Dubois’ equation15):
 | (3) |
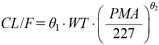
Where, WTi and HTi are the body weight (kg) and height (cm) of the patients, respectively. The effect of their age was incorporated into Model 1 to form Model 2:
 | (4) |
Where PMAi is individual postmenstrual age, 227 is the median of postmenstrual age of the population, and θ2 is the parameter to be estimated. In Model 3, PMA was divided into two components of prenatal and postnatal period:
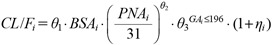 | (5) |
Where, PNAi is individual PNA. GAi is the GA and was set to 1 for patients with preterm birth (GA is 196 d or less, the median for this population), and 0 when the patient’s GA is greater than 196 d. θ3 is a parameter to be estimated only when GAi is 1. A similar analysis for the effect of age on clearance was performed using WT instead of BSA as a measure of body size on Models 4 to 6. The model equations are:
 | (6) |
 | (7) |
 | (8) |
The significance of the models was assessed by a likelihood ratio test using the OBJ (−2 log likelihood) calculated by the NONMEM software. When the likelihood difference (LLD) between the two models was greater than 3.84, it was considered significant (p < 0.05). Parameter 95% confidence intervals (CIs) were also calculated from the standard error (S.E.) values estimated by NONMEM for all parameters: 95% CI = (estimated parameter value) ± 1.96 * S.E.
Model EvaluationThe stability and reliability of the final parameter estimates were assessed by comparing serum concentrations obtained by model predictions with observed ones visually, and bootstrapping using PsN ver. 5.3.1.16) The resampling was repeated 1000 times, and the means and 2.5–97.5th percentiles (95% CI) for each parameter were calculated.
Regression AnalysisThe regression analysis was performed using Microsoft Excel 2019. To test the accuracy of regression of y in x, the coefficient of determination R2 is adopted by the following equation:
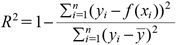 | (9). |
f(xi), ȳ and n correspond to the prediction of the model, mean of y and sample size, respectively.
RESULTS
Subject DemographicsA total of 115 samples were obtained from 52 patients who consented to participate in this study. Mean values of GA, PNA, PMA, WT, BSA, and the duration for the administration of CAF were 194 ± 15.4 d, 34.3 ± 18.2 d, 227 ± 12.8 d, 1.33 ± 0.369 kg, 0.113 ± 0.00183 m2, and 23.3 ± 13.1 d, respectively (Table 1). Mean birth weight was 1.02 ± 0.371 kg and 11.5% of the patients were small-for-gestational-age. The mean serum concentration observed was 19.4 ± 7.14 mg/L and 22.7% of the total data points were above the therapeutic range (5–25 mg/L); however, no samples were above the toxic level (> 50 mg/L). No patient had side effects or toxic symptoms after starting CAF administration. To evaluate the effect of the patient’s age on the exposure to CAF, we depicted the change in the C/D ratioBSA along with age in days (Fig. 1). R2 between C/D ratio and age was the greatest when BSA was used for dose correction and PMA for age (R2 = 0.31189). The results of this study were consistent with our previous observations even with the added number of cases.9) Figure 2A shows the relationship of PMA and PNA with GA. We found that even with the same PMA, some patients had a small GA and a large PNA, whereas others had a large GA and a small PNA. There was also a negative relationship between PNA and GA (Fig. 2B).
Table 1. Characteristics of 52 Subjects
| Mean ± S.D. (range) |
|---|
| Gestational age (d) | 193 ± 15.4 (160–224) |
| Postnatal age (d) | 34.3 ± 18.2 (6–81) |
| Postmenstrual age (d) | 227± 12.8 (189–259) |
| Body weight (kg) | 1.33 ± 0.369 (0.564–2.43) |
| Body surface area (m2) | 0.113 ± 0.0183 (0.0655–0.167) |
| Treatment period (d) | 23.3 ± 13.1 (6–63) |
S.D.: standard deviation.
The results of the development of the covariate model are presented in Table 2. Model 1, the base model using only BSA as body size, had an OBJ of 525.842. The effect of age was then examined by analyzing Models 2 and 3. The OBJ for Model 2 using PMA as the age in days was 472.860, showing a significant decrease from Model 1. Furthermore, the LLD value between Models 2 and 3 was 11.308, suggesting effectiveness of evaluating PMA separately as PNA and GA. With WT instead of BSA for body size, the OBJ of the models decreased significantly compared to those with BSA (LLD −55.504 between Models 1 and 4). Similarly, the effect of age in days was examined by analyzing Models 5 and 6. The OBJ for Model 5 using PMA was 448.486, which was a significant decrease from Model 4. The LLD value between Models 5 and 6 was 10.394, suggesting the effectiveness of evaluating PMA separately as PNA and GA. Interindividual variability of ω in Model 6 was 17.8%, which was smaller than that in the base model (20.4%) and Model 5 (20.7%). Based on these results, Model 6 was selected as the final model. The PPK parameters of CAF estimated in the final model with relative standard error (RSE) and 95% CI values, and bootstrap results are shown in Table 3. θ1 was estimated as 0.00603 (RSE 5.24%), θ2 as 0.210 (RSE 19.2%), and θ3 as 0.877 (RSE 8.61%) in the final model, suggesting that CL/F of CAF was 87.7% in more preterm infants with a GA of 196 d (median) or less compared to patients with a GA greater than 196 d. The value of η-shrinkage in the final model was appropriate at 16.2%. The 95% CI values for all parameters were confirmed not to contain 0. The parameter values calculated by bootstrapping converged to the final parameters with a high success rate (100%), indicating robustness. To confirm the accuracy of the final model visually, the relationship between measured and estimated CAF concentrations was evaluated. The estimation error was found to be improved in the final model (Model 6; Figs. 3C, D) compared to the base model (Model 1; Figs. 3A, B). In addition, the estimation of individual patient parameters using the Bayesian method (Figs. 3B, D) showed a better correlation than the estimation of population mean parameters with measured values (Figs. 3A, C), suggesting that the parameters estimated in the final model (Model 6) were appropriate.
Table 3. Parameter Estimates of Model 6 (Final Model) and Bootstrap Evaluation
| Parameters | Final model | Bootstrap (1000 simulations) |
|---|
| Estimates | RSE (%) | 95% CI | Mean | 95% CI |
|---|
| θ1 (L/h/kg) | 0.00603 | 5.24 | 0.00541–0.00665 | 0.00605 | 0.00540–0.00666 |
| θ2 | 0.210 | 19.2 | 0.202–0.218 | 0.212 | 0.131–0.289 |
| θ3 | 0.877 | 8.61 | 0.734–1.02 | 0.881 | 0.732–1.02 |
| ω2 | 0.0316 | 28.5 | 0.0139–0.0493 | 0.0301 | 0.0143–0.0488 |
| σ (mg/L) | 3.03 | 48.6 | 2.21–3.66 | 2.99 | 2.23–3.65 |
CI: confidence interval; RSE: relative standard error (RSE = 100 * SE/(parameter estimate)).
DISCUSSION
We aimed to quantify how developmental changes occur, especially determining the effect of the length of the gestational period on CAF clearance. We performed PPK analysis using NONMEM and evaluated the fit of six models. A total of 115 samples were obtained from 52 patients with a mean age of 34.3 ± 18.2 d. The median values of GA and PNA were 196 and 31 d respectively. C/D ratioBSA was dependent on PMA rather than PNA, which supports the findings of the previous study. The results from NONMEM analysis provided the following final model of oral clearance: CL/F = 0.00603∙WT∙ ∙0.877GA ≤ 196 L/h. This model takes into account developmental changes in prenatal and postnatal periods separately and successfully described the variation in clearance of CAF. The key thing to note is that GA of 196 d (equal to 28 weeks) is just at the beginning of late pregnancy and preterm birth less than 28 weeks has both physiologic and diagnostic implications. Our findings suggest that the dosage of CAF in preterm infants should be determined based not only on WT but also on both PNA and GA.
Sandra et al.17) reported a best-fit model of elimination clearance of propofol that took into account the maturational effect on elimination until birth (by GA) and postpartum (by PNA and GA). In addition, Wu et al.18) reported a developmental model in which GFR depends on WT, PNA, and GA, rather than a model using covariates such as WT, PMA, and/or BSA. These findings suggest that the rate of developmental change in drug clearance and/or physiological functions, including hepatic metabolism and renal elimination, are not always the same during the gestation and postnatal period. These findings are consistent with our results that developmental changes in CAF clearance in preterm infants were better described by GA and PNA than by PMA (Table 2).
There have been several maturation models to describe the physiological features such as drug clearance in children. Gao et al.10) used an allometric scaling for WT as a covariate of body size and reported that clearance of CAF could be better described with PMA than GA and PNA in a PPK analysis of Chinese preterm infants. The age range for their population was 31.1 (26.4–38.0) weeks for PMA and 28.3 (25.0–33.4) weeks for GA, which was similar to our study. In contrast, we successfully developed the model of CAF clearance with incorporation of both GA and PNA as covariates. It is noteworthy that we did not use an allometric scaling for WT because separating GA and PNA were possible to confound with an allometric scaling for WT in terms of developmental changes in CAF clearance. In a different approach, we tried to incorporate Hill function using PMA in the model development of CAF clearance. However, these models were poorly fitted to the data, probably because our preterm newborns were too immature to metabolize CAF in the liver. In fact, serum concentrations of the major metabolite of CAF (Theophylline, Theobromine, Paraxanthine) were negligible in the present study (data not shown).
Premature delivery may have severe effects on kidney development. Since most of the nephrons are formed during the gestation period between 20 and 34–36 weeks, renal formation during gestation is likely to be interrupted or at least to change its pattern by delivery in extremely premature infants.19) Sutherland et al.20) reported that the preterm kidney may have fewer functional nephrons, thereby increasing vulnerability to impaired renal function even in the early postnatal period. Therefore, preterm kidneys (GA at birth of 24–35 weeks and PNA of 2–68 d) had a greater percentage of morphologically abnormal glomeruli (0.2–13%) and a significantly larger cross-sectional area of the renal corpuscle, which is suggestive of renal hyperfiltration. These reports are consistent with our finding that it is reasonable to consider the effect during gestational period when assessing developmental changes in preterm infants.
There were some limitations in the present study. First, the effect of GA could not be taken as a continuous variable of CAF clearance. Second, we took no account of GFR or other indexes of renal function as covariates. Third, we could not recruit preterm infants with both small GA and PNA, which resulted in a biased distribution of the patient’s ages (Fig. 2). Finally, the relationship between CAF exposure and its effects is still unclear in preterm infants. Our findings should be warranted in future studies of postnatal developmental change in CAF effects.
In conclusion, we have successfully described the developmental effects on CAF clearance in preterm infants by using GA and PNA separately rather than using PMA alone. This study provides insights into the clinical management of CAF therapy as well as developmental changes during neonatal and/or childhood periods and their impact on the pharmacokinetics of drugs.
Acknowledgments
This work was supported by JST SPRING (Grant Number: JPMJSP2145) and the Japanese Society for the Promotion of Sciences (JSPS KAKENHI Grant Number: 21K06687) in part.
Conflict of Interest
The authors have declared that no competing interests exist concerning this article. Akane Hara works at Laboratory of Pharmaceutical Quality Assurance and Assessment (University of Toyama), which is an endowed laboratory supported by an unrestricted Grant from Nichi-Iko Pharmaceutical Co., Ltd. (Toyama, Japan).
Supplementary Materials
This article contains supplementary materials.
REFERENCES
- 1) Henderson-Smart DJ, Steer PA. Caffeine versus theophylline for apnea in preterm infants. Cochrane Libr., 2010, CD000273 (2010).
- 2) Miao Y, Zhou Y, Zhao S, Liu W, Wang A, Zhang Y, Li Y, Jiang H. Comparative efficacy and safety of caffeine citrate and aminophylline in treating apnea of prematurity: a systematic review and meta-analysis. PLOS ONE, 17, e0274882 (2022).
- 3) Moschino L, Zivanovic S, Hartley C, Trevisanuto D, Baraldi E, Roehr CC. Caffeine in preterm infants: where are we in 2020? ERJ Open Res., 6, 00330-2019 (2020).
- 4) Koch G, Schönfeld N, Jost K, Atkinson A, Schulzke SM, Pfister M, Datta AN. Caffeine preserves quiet sleep in preterm neonates. Pharmacol. Res. Perspect., 8, e00596 (2020).
- 5) Tang-Liu DD, Williams RL, Riegelman S. Disposition of caffeine and its metabolites in man. J. Pharmacol. Exp. Ther., 224, 180–185 (1983).
- 6) Aldridge A, Aranda JV, Neims AH. Caffeine metabolism in the newborn. Clin. Pharmacol. Ther., 25, 447–453 (1979).
- 7) Aranda JV, Collinge JM, Zinman R, Watters G. Maturation of caffeine elimination in infancy. Arch. Dis. Child., 54, 946–949 (1979).
- 8) Koch G, Datta AN, Jost K, Schulzke SM, van den Anker J, Pfister M. Caffeine citrate dosing adjustments to assure stable caffeine concentrations in preterm neonates. J. Pediatr., 191, 50–56.e1 (2017).
- 9) Taguchi M, Kawasaki Y, Katsuma A, Mito A, Tamura K, Makimoto M, Yoshida T. Pharmacokinetic variability of caffeine in routinely treated preterm infants: preliminary considerations on developmental changes of systemic clearance. Biol. Pharm. Bull., 44, 69–74 (2021).
- 10) Gao XB, Zheng Y, Yang F, Wang CH, Jiang ZH, Wu YE, Jacqz-Aigrain E, Ni SQ, Zhao W. Developmental population pharmacokinetics of caffeine in Chinese premature infants with apnoea of prematurity: A post-marketing study to support paediatric labelling in China. Br. J. Clin. Pharmacol., 87, 1155–1164 (2021).
- 11) Kuwayama K, Tsujikawa K, Miyaguchi H, Kanamori T, Iwata YT, Inoue H. Time-course measurements of caffeine and its metabolites extracted from fingertips after coffee intake: a preliminary study for the detection of drugs from fingerprints. Anal. Bioanal. Chem., 405, 3945–3952 (2013).
- 12) Suresh Babu AR, Thippeswamy B, Vinod AB, Ramakishore EG, Anand S, Senthil D. Determination of theophylline in rabbit plasma by triple quadrupole LC/MS. Pharm. Methods, 2, 211–217 (2011).
- 13) Beal SL, Sheiner LB, Boeckmann A, Bauer RJ. NONMEM users guides. NONMEM Proj. Group, Univ. California, San Fr. (1992).
- 14) Lietman PS, Aranda JV, Cook CE, Gorman W, Collinge JM, Loughnan PM, Outerbridge EW, Aldridge A, Neims AH. Pharmacokinetic profile of caffeine in the premature newborn infant with apnea. J. Pediatr., 94, 663–668 (1979).
- 15) Du Bois D, Du Bois EF. A formula to estimate the approximate surface area if height and weight be known. 1916. Nutrition, 5, 303–311, discussion, 312–313 (1989).
- 16) Lindbom L, Pihlgren P, Jonsson N. PsN-Toolkit—a collection of computer intensive statistical methods for non-linear mixed effect modeling using NONMEM. Comput. Methods Programs Biomed., 79, 241–257 (2005).
- 17) Sandra L, Smits A, Allegaert K, Nicolaï J, Annaert P, Bouillon T. Population pharmacokinetics of propofol in neonates and infants: gestational and postnatal age to determine clearance maturation. Br. J. Clin. Pharmacol., 87, 2089–2097 (2021).
- 18) Wu Y, Allegaert K, Flint RB, Simons SHP, Krekels EHJ, Knibbe CAJ, Völler S. Prediction of glomerular filtration rate maturation across preterm and term neonates and young infants using inulin as marker. AAPS J., 24, 38 (2022).
- 19) Moritz KM, Wintour EM, Black MJ, Bertram JF, Caruana G. Factors influencing mammalian kidney development: implications for health in adult life. Adv. Anat. Embryol. Cell Biol., 196, 1–78 (2008).
- 20) Sutherland MR, Gubhaju L, Moore L, Kent AL, Dahlstrom JE, Horne RSC, Hoy WE, Bertram JF, Black MJ. Accelerated maturation and abnormal morphology in the preterm neonatal kidney. J. Am. Soc. Nephrol., 22, 1365–1374 (2011).