Abstract
This study aimed to validate the In vitro Dissolution Absorption System 2 (IDAS2) containing a biological barrier of Caco-2 or Madin–Darby canine kidney (MDCK) cell monolayer through dose sensitivity studies. Metoprolol and propranolol were selected as Biopharmaceutics Classification System (BCS) Class I model drugs, and atenolol as a Class III model drug. The IDAS2 is comprised of a dissolution vessel (500 mL) and two permeation chambers (2 × 8.0 mL) mounted with Caco-2 or MDCK cell monolayer. One or two immediate-release tablet(s) of the model drug were added to the dissolution vessel, and the time profiles of dissolution and permeation were observed. Greater than 85% of metoprolol and propranolol (tested at two dosing concentrations) were dissolved by 15 min, and all drugs were fully dissolved by 30 min. All three drugs were more permeable across Caco-2 cells than MDCK cells with a linear increase in permeation across both cells at both dose concentrations. Thus, the dose sensitivity of the IDAS2 was demonstrated using both cell barriers. These results indicate a successful qualification of IDAS2 for the development/optimization of oral formulations and that MDCK cells can be utilized as a surrogate for Caco-2 cells.
INTRODUCTION
In vitro Dissolution Absorption Systems 2 (IDAS2) has been developed to simultaneously assess the dissolution and permeation profiles of oral products in biorelevant conditions.1) The patent has been registered in the U.S. (9546991), Europe (3221696), and Japan (JP2017536557A5). The IDAS2 is comprised of one dissolution vessel (500 mL) and two permeation chambers (2 × 8.0 mL) which are inserted into the dissolution vessel with Caco-2 cell monolayers mounted at the interface of the dissolution and permeation chambers.1) The dose concentration is determined by 2 doses (tablets or capsules) per 500 mL, which is equivalent to the Biopharmaceutics Classification System (BCS) of standard, the highest dose per 250 mL. A good correlation between the permeated amount and the oral absorption in humans for indomethacin micronized and nanosized formulations was previously demonstrated using the IDAS2.1) Furthermore, the IDAS2 demonstrated that BCS Class II drugs were profoundly affected by the viscosity in terms of their dissolution and permeation.2) More recently, the IDAS2 was used to demonstrate the effect of supersaturation on the dissolution and permeation profiles of BCS Class II drugs, and the plasma concentration-time profiles were successfully predicted by combining with a modeling approach.3,4)
Our next goal is to utilize the IDAS2 as an in vitro bioequivalence (BE) decision tool. However, the difference in the in vitro permeated amount among formulations as a reflection of in vivo oral absorption in humans has not previously been reported and the permeation profiles were observed from a single dose strength.1–4) The IDAS2 has a much smaller absorptive surface area (SA) per volume ratio (SA/V) than other in vitro systems.1–11) Thus, there is a concern that the permeated amount may not increase with increasing the drug dose due to the saturation of cell monolayer permeation. If the IDAS2 is insensitive to the applied dose, all test formulations will be erroneously deemed BE due to the lack of the ability to detect the difference in the permeated amount. In general, the sensitivity to dose for parenteral formulations is investigated according to the guidance issued by U.S. Food and Drug Administration (FDA).12) To further characterize IDAS2, the sensitivity to dose as expressed through the permeation profiles was investigated in this study. The effect of dose strength of typical BCS Class I (metoprolol tartrate and propranolol hydrochloride) and III (atenolol) drugs on permeation was investigated in the IDAS2 with Caco-2 and Madin–Darby canine kidney (MDCK) cell monolayers. Caco-2 cells are typically used as a biological barrier for permeation in the IDAS2 and the culture duration is 21 d. This long culture duration to establish polarized, differentiated Caco-2 cell monolayers is a disadvantage for the high-throughput screening of oral formulations; thus, MDCK cells, with a 7-d culture time, were also utilized to investigate another bio-relevant barrier as an alternative.
MATERIALS AND METHODS
MaterialsMetoprolol tartrate, propranolol hydrochloride, atenolol, glucose, and MES were obtained from Sigma-Aldrich (St. Louis, MO, U.S.A.). Hanks’ balanced salt solution 10X (HBSS 10X), 1 M N-(2-hydroxyethyl)piperazine-N′-2-ethanesulfonic acid (HEPES), Dulbecco’s modified Eagle’s medium (DMEM), fetal bovine serum (FBS), MEM nonessential amino acids (MEM NEAA), MEM sodium pyruvate, and penicillin-streptomycin (10000 U/mL) were obtained from Gibco Laboratories (Lenexa, KS, U.S.A.). Bovine serum albumin (BSA) was procured from Tocris Bioscience (Minneapolis, MN, U.S.A.). The simulated intestinal fluids containing sodium taurocholate and lecithin was purchased from Biorelevant (London, U.K.). All other reagents were of the highest purity.
Cell CultureCaco-2 (C2BBe1 clone) and MDCK cells were obtained from American Type Culture Collection (Manassas, VA, U.S.A.) and cultured in DMEM supplemented with 10% FBS, 1% NEAA, 1 mM sodium pyruvate, 100 IU/mL penicillin, and 100 µg/mL streptomycin in a humidified incubator (37 °C, 5% CO2). When the stock cultures were approx. 80% confluent, the cells were harvested by trypsinization and seeded at a density of 60000 cells/cm2 onto rat-tail type I collagen-coated microporous (0.4 µm pore size) polycarbonate membrane in 6-well Snapwell plates to grow cell monolayers for dissolution-permeability studies. After cells were seeded on Snapwell plates, the culture medium was changed every other day until use (21 d for Caco-2 cells, 7 d for MDCK cells). To ensure cell integrity, the transepithelial electrical resistance (TEER) value was measured using an epithelial volt ohm meter, EVOM2 (World Precision Instruments, Sarasota, FL, U.S.A.). Caco-2 monolayers with TEER values >450 Ω cm2 and MDCK monolayers with TEER values >1000 Ω cm2 were used. Furthermore, the permeability for propranolol and atenolol was internally checked using the randomly selected cell monolayers from the same batch (same seeded date) before running the studies. The cell monolayers that passed the internal criteria were used for this study.
Preparation of pH 6.5 Fasted-State Simulated Intestinal Fluid (FaSSIF)The pH 6.5 FaSSIF was prepared by mixing HBSS (1X), glucose (15 mM), MES (10 mM), sodium taurocholate (3 mM), and lecithin (0.75 mM).10) The pH of the final FaSSIF mixture was adjusted to 6.5 using 10 N NaOH.
Preparation of pH 7.4 4.5% BSA-HBSSgThe pH 7.4 4.5% BSA-HBSSg was prepared by mixing HBSS (1X), glucose (15 mM), HEPES (10 mM), and BSA (4.5%). The pH of final BSA-HBSSg mixture was adjusted to 7.4 using 10 N NaOH.
IDAS2 AssayThe IDAS2 is comprised of a dissolution vessel and two permeation chambers. The cell monolayers were mounted in the interface between a dissolution vessel (500 mL, pH 6.5 FaSSIF) and two permeation chambers (2 × 8 mL, pH 7.4 4.5% BSA-HBSSg). The paddle speed of the dissolution vessel was set at 50 rpm and warmed at 37 °C. One or two oral tablet(s) of the model drug listed in Table 1 was added to the dissolution vessel and the dissolution (2.0 mL) and permeation (1.0 mL) samples were collected up to 2 h. The dissolution samples were immediately filtered through a polytetrafluoroethylene filter (SECO PTFE Syringe Filter, pore size: 0.45 µm, Scientific Equipment Company, Aston, PA, U.S.A.). The filtrates were diluted 5-fold using an HPLC mobile phase and stored at −80 °C until HPLC-UV analysis. The permeation samples were replaced by the same volume of fresh and pre-warmed receiver buffer. A permeation sample (0.1 mL) was mixed with acetonitrile (0.9 mL) to precipitate the protein. After vigorous vortexing, the mixture was centrifuged at 20000 × g for 20 min. The supernatant (0.1 mL) was dried under nitrogen gas. The dried samples were reconstituted with 0.15 mL of water for metoprolol and atenolol, or water : acetonitrile (75 : 25) for propranolol.
Table 1. Summary of BCS Class, the Experimental Setup, and Results for Three Model Drugs
| Drug | BCS class | Dose strength (mg) | Dose concentrationa) (mg/mL) | Caco-2 | MDCK |
|---|
| Permeation rateb) (ng/h) | Ratio of permeation ratec) (high/low dose) | Percent permeated/chamber /2hd) (%) | Permeation rateb) (ng/h) | Ratio of permeation ratec) (high/low dose) | Percent permeated/chamber /2hd) (%) |
|---|
| Metoprolol | I | 100 | 0.2 | 10006 ± 279 | 1.9 | 0.018 ± 0.00055 | 1671 ± 175 | 2.1 | 0.0029 ± 0.00030 |
| 200 (100 × 2) | 0.4 | 19354 ± 1162 | 0.018 ± 0.0011 | 3446 ± 147 | 0.0030 ± 0.00013 |
| Propranolol | I | 40 | 0.08 | 5008 ± 596 | 2.2 | 0.025 ± 0.0025 | 4215 ± 192 | 2.0 | 0.020 ± 0.00094 |
| 80 (40 × 2) | 0.16 | 10823 ± 498 | 0.027 ± 0.0014 | 8580 ± 486 | 0.021 ± 0.0010 |
| Atenolol | III | 100 | 0.2 | 292 ± 45 | 2.1 | 0.00052 ± 0.000085 | 22.4 ± 2.0 | 1.8 | 0.000045 ± 0.0000052 |
| 200 (100 × 2) | 0.4 | 613 ± 42 | 0.00056 ± 0.000035 | 39.4 ± 5.4 | 0.000037 ± 0.0000046 |
a) The fluid volume of dissolution vessel: 500 mL. b) The data represent an average ± standard deviation (S.D.) (n = 5–6). c) The slope of the time course of the permeated amount (15–120 min). d) The data represent an average ± S.D. (n = 5–6).
Drug concentrations in the dissolution samples were quantified using an HPLC system with a UV detector (Agilent Technologies 1200 Series, CA, U.S.A.). A reverse-phase analytical column (C18 3.0 µm, 50 × 4.6 mm, Shimadzu, Kyoto, Japan) was used. The mobile phase consisted of 10 mM KH2PO4 (pH 3.0) and acetonitrile at the ratios of 20 : 80 for metoprolol, 40 : 60 for propranolol, and 70 : 30 for atenolol. An isocratic mode was employed with a flow rate of 1.0 mL/min with UV wavelengths of 221 nm for metoprolol, 291 nm for propranolol, and 275 nm for atenolol. The standard curves were linear with a correlation coefficient (r2) of at least 0.9991. The acceptance criterion for calibration standards and QCs were accuracy within ±5% of the nominal concentrations and at least 75% of calibration standards met this criterion in each analytical batch.
Sample Analysis Using Liquid Chromatography-Tandem Mass Spectrometry (LC/MS/MS)Drug concentrations in the permeation samples were quantified using an LC system (Agilent Technologies 1200 Series) equipped with a tandem mass spectrometer (PE SCIEX API 4000). As a reverse-phase analytical column, Thermo BDS Hypersil C18 30 × 2.1 mm, 1.7 µm was used. Mobile phases were composed of 10% 25 mM ammonium formate, pH 3.5 in water (solvent A), and 10% 25 mM ammonium formate, pH 3.5 in acetonitrile (solvent B) with a flow rate of 0.7 mL/min. A 5.0 µL aliquot of the samples was injected into the LC/MS/MS system. The precursor/product transitions (m/z) were 268.2/116.1 for metoprolol, 260.2/116.1 for propranolol, and 267.2/145.1 for atenolol. The standard curves were linear with a correlation coefficient (r2) of at least 0.9993. The limit of qualification was 0.1 ng/mL for atenolol and 10 ng/mL for propranolol and metoprolol. The acceptance criterion for calibration standards and QCs were accuracy within ±15% of the nominal concentrations and at least 75% of calibration standards met this criterion in each analytical batch.13,14)
RESULTS AND DISCUSSION
Dissolved Concentration–Time ProfilesGreater than 85% of metoprolol and propranolol for two tested doses were dissolved within 15 min (Fig. 1). Also, all model drugs tested at all doses were completely dissolved within 30 min, demonstrating the immediate-release nature of formulations and high solubility of BCS Class I and III drugs.
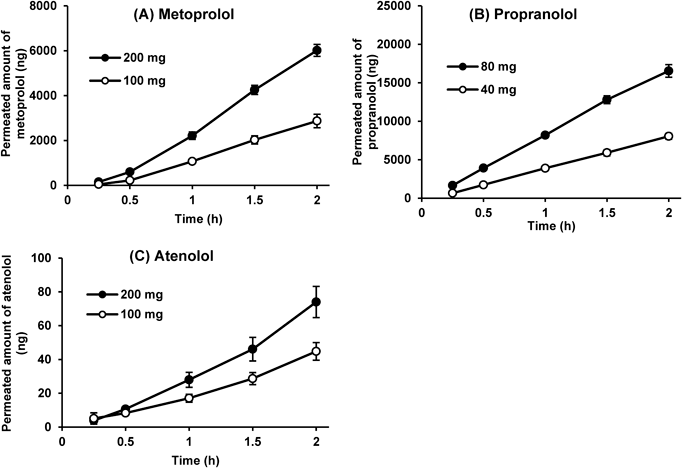
Permeated Amount–Time ProfilesThe dose-proportional permeation rates (the slope of the time course of the permeated amount) were observed between the two tested doses for all model drugs and both cell monolayers (Figs. 2, 3). All permeation profiles in Figs. 2 and 3 have an r2 value >0.98 and were considered linear (constant).12) The ratios of permeation rate (high dose/low dose) of model drugs were within ±10% (1.8 to 2.2) of the dose ratio (2.0) for both cell monolayers (Table 1). The current study followed the guidance issued by FDA where the deviation of the calibration curve and QCs should be within ±15% of the theoretical concentrations and at least 75% of calibration samples should meet this criterion.13,14) Given the analytical deviation, the ±10% deviation for the ratios of permeation rate was considered acceptable. Therefore, it was concluded that the IDAS2 with Caco-2 or MDCK cells can assess the effect of the dose strength on permeation with low deviations.
The percentage of permeated amount was quite low for all drugs, especially atenolol. Atenolol showed 0.00052–0.00056 and 0.000037–0.000045% permeated across Caco-2 and MDCK cells, respectively (Table 1). In contrast, in the previous study, the percentages permeated for metoprolol, propranolol, and atenolol in the IDAS1, an earlier and smaller-scale device, were 4.51, 8.52, and 0.085%, much higher than those in the IDAS2.5) This is due to the difference in the SA/V ratio between both systems. The IDAS2 (SA:1.12 cm2, SA/V: 0.00224/cm) has a large donor volume and thus a much smaller SA/V ratio than the IDAS1 (SA: 1.77 cm2, SA/V: 0.22/cm),10) resulting in much lower permeation clearance [SA (or SA/V) × Peff] in the IDAS2.
The rank order of % permeated was propranolol > metoprolol > atenolol for both cell lines. Therefore, Caco-2 cells can be replaced with MDCK cells to shorten the duration of cell culture and expand options to assess permeability in other cell models. The absolute permeated amounts of drugs were higher in Caco-2 cells than in MDCK cells, which is consistent with the results of a previous report15) and the higher TEER values in the MDCK cells. The impact of cell lines on propranolol permeability was relatively small compared with the other drugs; the permeation rates of propranolol, metoprolol, and atenolol across MDCK cell monolayer were approximately 79–84, 17–18, and 6.4–7.7% of those across Caco-2 cell monolayer. This, along with the log D values for propranolol, metoprolol, and atenolol (1.23, −0.28, and −1.81, respectively),16) indicates that the relative contribution of the paracellular route for propranolol was smaller than for metoprolol and atenolol.
CONCLUSION
We investigated the effect of the dose on membrane permeation in the IDAS2 with Caco-2 and MDCK cells to validate the system. The IDAS2 demonstrated dose-proportional permeation rates for all model drugs and both cell monolayers. This result indicates that the validation of IDAS2 was accomplished for the development/optimization of oral formulations and that MDCK cells can be utilized as an alternative to Caco-2 cells.
Conflict of Interest
The authors declare no conflict of interest.
REFERENCES
- 1) Li J, Li L, Nessah N, Huang Y, Hidalgo C, Owen A, Hidalgo I. Simultaneous analysis of dissolution and permeation profiles of nanosized and microsized formulations of indomethacin using the in vitro dissolution absorption system 2. J. Pharm. Sci., 108, 2334–2340 (2019).
- 2) Silchenko S, Nessah N, Li J, Li L, Huang Y, Owen A, Hidalgo I. In vitro dissolution absorption system (IDAS2): use for the prediction of food viscosity effects on drug dissolution and absorption from oral solid dosage forms. Eur. J. Pharm. Sci., 143, 105164 (2020).
- 3) Li J, Bukhtiyarov Y, Spivey N, Force C, Hidalgo C, Huang Y, Owen A, Hidalgo I. In vitro and in vivo assessment of the potential of supersaturation to enhance the absorption of poorly soluble basic drugs. J. Pharm. Innov., 15, 591–602 (2020).
- 4) Li J, Spivey N, Silchenko S, Gonzalez-Alvarez I, Bermejo M, Hidalgo I. A differential equation based modelling approach to predict supersaturation and in vivo absorption from in vitro dissolution-absorption system (idas2) data. Eur. J. Pharm. Biopharm., 165, 1–12 (2021).
- 5) Kataoka M, Masaoka Y, Yamazaki Y, Sakane T, Sezaki H, Yamashita S. In vitro system to evaluate oral absorption of poorly water-soluble drugs: simultaneous analysis on dissolution and permeation of drugs. Pharm. Res., 20, 1674–1680 (2003).
- 6) Kataoka M, Masaoka Y, Sakuma S, Yamashita S. Effect of food intake on the oral absorption of poorly water-soluble drugs: in vitro assessment of drug dissolution and permeation assay system. J. Pharm. Sci., 95, 2051–2061 (2006).
- 7) Kataoka M, Itsubata S, Masaoka Y, Sakuma S, Yamashita S. In vitro dissolution/permeation system to predict the oral absorption of poorly water-soluble drugs: effect of food and dose strength on it. Biol. Pharm. Bull., 34, 401–407 (2011).
- 8) Masada T, Takagi T, Minami K, Kataoka M, Izutsu K, Matsui K, Yamashita S. Bioequivalence of oral drug products in the healthy and special populations: assessment and prediction using a newly developed in vitro system “BE Checker”. Pharmaceutics, 13, 1136 (2021).
- 9) Takagi T, Masada T, Minami K, Kataoka M, Yamashita S. Development of an in vitro methodology to assess the bioequivalence of orally disintegrating tablets taken without water. Pharmaceutics, 15, 2192 (2023).
- 10) Higashino H, Develin C, Higashino C, Lim T, Martin A, Zhou F, Strab R, Patel R, Bhoopathy S, Hidalgo I. In vitro digestion-diffusion model for predicting in vivo performance of lipid-based formulations. J. Drug Deliv. Sci. Technol., 83, 104439 (2023).
- 11) Higashino H, Develin C, Higashino C, Lim T, Miezeiewski B, Strab R, Patel R, Bhoopathy S, Hidalgo I. The impact of surface area per volume (SA/V) ratio on drug transport from supersaturated solutions of ketoconazole. Eur. J. Pharm. Biopharm., 188, 147–152 (2023).
- 12) “In vitro release test studies for topical drug products submitted in ANDAs guidance for industry.”: ‹https://www.fda.gov/media/162476/download›, accessed October 2022.
- 13) “Bioanalytical Method Validation Guidance for Industry.”: ‹https://www.fda.gov/files/drugs/published/Bioanalytical-Method-Validation-Guidance-for-Industry.pdf›, accessed May 2018.
- 14) “Guideline on bioanalytical method validation in pharmaceutical development.”: ‹https://www.pmda.go.jp/files/000206209.pdf›, accessed September 2013.
- 15) Troutman MD, Thakker DR. Novel experimental parameters to quantify the modulation of absorptive and secretory transport of compounds by P-glycoprotein in cell culture models of intestinal epithelium. Pharm. Res., 20, 1210–1224 (2003).
- 16) Andrés A, Rosés M, Ràfols C, Bosch E, Espinosa S, Segarra V, Huerta JM. Setup and validation of shake-flask procedures for the determination of partition coefficients (logD) from low drug amounts. Eur. J. Pharm. Biopharm., 76, 181–191 (2015).