Abstract
Background:
The intra-left atrial (LA) blood flow from pulmonary veins (PVs) to the left ventricle (LV) changes under various conditions and might affect global cardiac function. By using phase-resolved 3-dimensional cine phase contrast magnetic resonance imaging (4D-Flow), the intra-LA vortex formation was visualized and the factors affecting the intra-LA flow dynamics were examined.
Methods and Results:
Thirty-two patients with or without organic heart diseases underwent 4D-Flow and transthoracic echocardiography. The intra-LA velocity vectors from each PV were post-processed to delineate streamline and pathline images. The vector images revealed intra-LA vortex formation in 20 of 32 patients. All the vortices developed during the late systolic and early diastolic phases and were directed counter-clockwise when viewed from the subjects’ cranial side. The flow vectors from the right PVs lengthened predominantly toward the mitral valves and partly toward the LA appendage, whereas those from the left PVs directed rightward along the posterior wall and joined the vortex. Patients with vortex had less organic heart diseases, smaller LV and LA volume, and greater peak flow velocity and volume mainly in the left PVs, although the flow directions from each PV or PV areas did not differ.
Conclusions:
4D-Flow can clearly visualize the intra-LA vortex formation and analyze its characteristic features. The vortex formation might depend on LV and LA volume and on flow velocity and volume from PVs. (Circ J 2015; 79: 144–152)
The left atrium (LA) serves as a reservoir/contractile chamber and a conduit, and hemodynamics in the LA have been evaluated mainly by Doppler-mode echocardiography.1,2
The flow dynamics in the LA; however, remain relatively unexplored.
In addition to conventional echocardiography, phase-resolved 3-dimensional (D) cine phase contrast magnetic resonance imaging (4D-Flow) has attracted great interest and can express a streamline image that is an assembly of flow vectors at each phase, and a pathline image that consists of traces of blood particles during the cardiac cycle.3–7
4D-Flow is a reliable tool for analysis and visualization of normal characteristic flow features in great vessels, which has been recently applied for the analysis of 3D blood flow in humans.8–13
Some studies have shown vortex formation within the LA and left ventricle (LV). However, the analysis of intra-cardiac flow dynamics focused on normal variants and on patients with limited conditions (eg, Fontan circulation); therefore, it remains unknown how cardiac volume and function affect the flow dynamics in the LA.8–10
Using streamline and pathline imaging of 4D-Flow, we aimed to clarify the flow dynamics in the LA by analyzing flow vectors from the pulmonary veins (PVs) to the LV. We also examined morphological and functional factors that can affect the flow dynamics in patients with or without organic heart diseases.
Methods
Subjects
We prospectively enrolled 32 consecutive patients with sinus rhythm who underwent cardiac magnetic resonance imaging (MRI) and transthoracic echocardiography (TTE) for analyses of intra-cardiac hemodynamics from August 2012 to December 2012. The patients comprised those with or without organic heart diseases. The definition of organic heart disease was based on guidelines (for prior myocardial infarction and cardiomyopathies) or cardiac MRI and TTE findings (for other cardiac diseases).14–17
Patients were regarded to have organic heart diseases when they showed a high serum N terminal pro-brain natriuretic peptide (NT-proBNP) level (>125 pg/ml) and either LV dilatation, LV hypertrophy, low LV ejection fraction (EF), asynergy, late gadolinium enhancement, or moderate to severe valve diseases in cardiac MRI or TTE. Patients without organic heart disease underwent cardiac MRI to examine cardiac involvement of systemic disease or to rule out organic heat disease for arrhythmias, and were chosen when cardiac MRI and TTE did not show any abnormalities, and when the serum NT-proBNP level was within a normal range (<125 pg/ml).
We also examined 4D-Flow in 9 healthy volunteers (4 males/5 females; 39±11 years old) without any organic heart disease and without any conventional risk factors for cardiovascular diseases; these subjects served as the normal controls.
Data collection and analysis were performed with the approval of an institutional review board, and all patients gave informed consent.
MRI
All examinations were performed by using a 3-T MR scanner (Discovery MR750; GE Healthcare, Waukesha, WI, USA), with a maximum gradient strength of 50 mT/m and a maximum slew rate of 200 mT·m–1·ms–1, and a commercially available 12-channel phased array body coil. The details of MR sequences are described elsewhere.18
Typically, 2D-fast imaging employing steady state acquisition (FIESTA) and late gadolinium enhancement images were acquired in the short axis, vertical long axis and horizontal long axis orientations. The slice thickness/gap was typically 10 mm/0 mm (6–9 slices). 2D-FIESTA cine images were based on the steady state free precession sequence, and delayed myocardial enhancement imaging was based on the inversion recovery prepared-fast gradient echo sequence.
4D-Flow provides time-resolved 3D voxel data, each of which has 3D flow velocity components.19,20
Imaging parameters used for coronal 3D Fourier transform fast spoiled gradient echo (FSPGR)-based 4D-Flow were as follows: repetitive time ((TR; ms)/echo time (TE; ms)/flip angle (FA; degree)/number of excitations (NEX) of 4.5–5.0/2.0/15/1), field of view (FOV) of 32 cm, matrix of 224×224, 2 mm thickness, 60 partitions, 20 phases during 1 cardiac cycle, velocity encoding (VENC) of 200 cm/s, and receiver band width (RBW) of 83.3 kHz. Respiratory-compensated retrospective cardiac gating was also combined. The resultant approximate imaging time was 10 min with a reduction factor of 2 for an auto-calibrating reconstruction for Cartesian (ARC) sampling.19
Raw data from 4D-Flow were transferred to a personal computer (Intel Xeon E3-1270 (3.4 GHz/Quad-core) DDR3, 16 GB ECC, Linux) and reconstructed. Contrast-enhanced 3D FSPGR MR angiography was performed for geometric information. Imaging parameters for coronal 3D FSPGR MR angiography were as follows: TR (ms)/TE (ms)/FA (degree)/NEX of 2.7/1.0/12/1, FOV (cm) of 32, matrix of reconstructed matrix with the aid of zero fill interpolation of 224×224, RBW of 83.3 kHz, and imaging time of 33 s for 4 phases. A bolus injection of 0.1 mmol/kg gadolinium (Gd) chelate, Gd-DTPA-BMA (Omniscan; Daiichi Pharma Co, Tokyo, Japan) or Gd-DTPA (Magnevist; Bayer Healthcare, Osaka, Japan) was performed at an injection rate of 2.0 ml/s followed by 20 ml of saline at the same injection rate. A power-injector (Sonic Shot GX; Nemoto Kyorindo, Tokyo, Japan) was used for the injection.
Post Processing
4D-Flow and MR angiographic data sets mentioned above were formatted by DICOM and analyzed on a personal computer. We decided the regions of interest including PVs, LA and LV, from the 4D-Flow and MR angiographic data sets. Segmentation was performed for heart and vascular wall structures from 3D data sets of MR angiography at the peak of the R wave with magnitude images of 4D-Flow using the region growing method. Then, their shapes were created by the Marching cubes method.21
We measured the LV end-systolic and -diastolic volume (LVESV and LVEDV), stroke volume and LVEF.
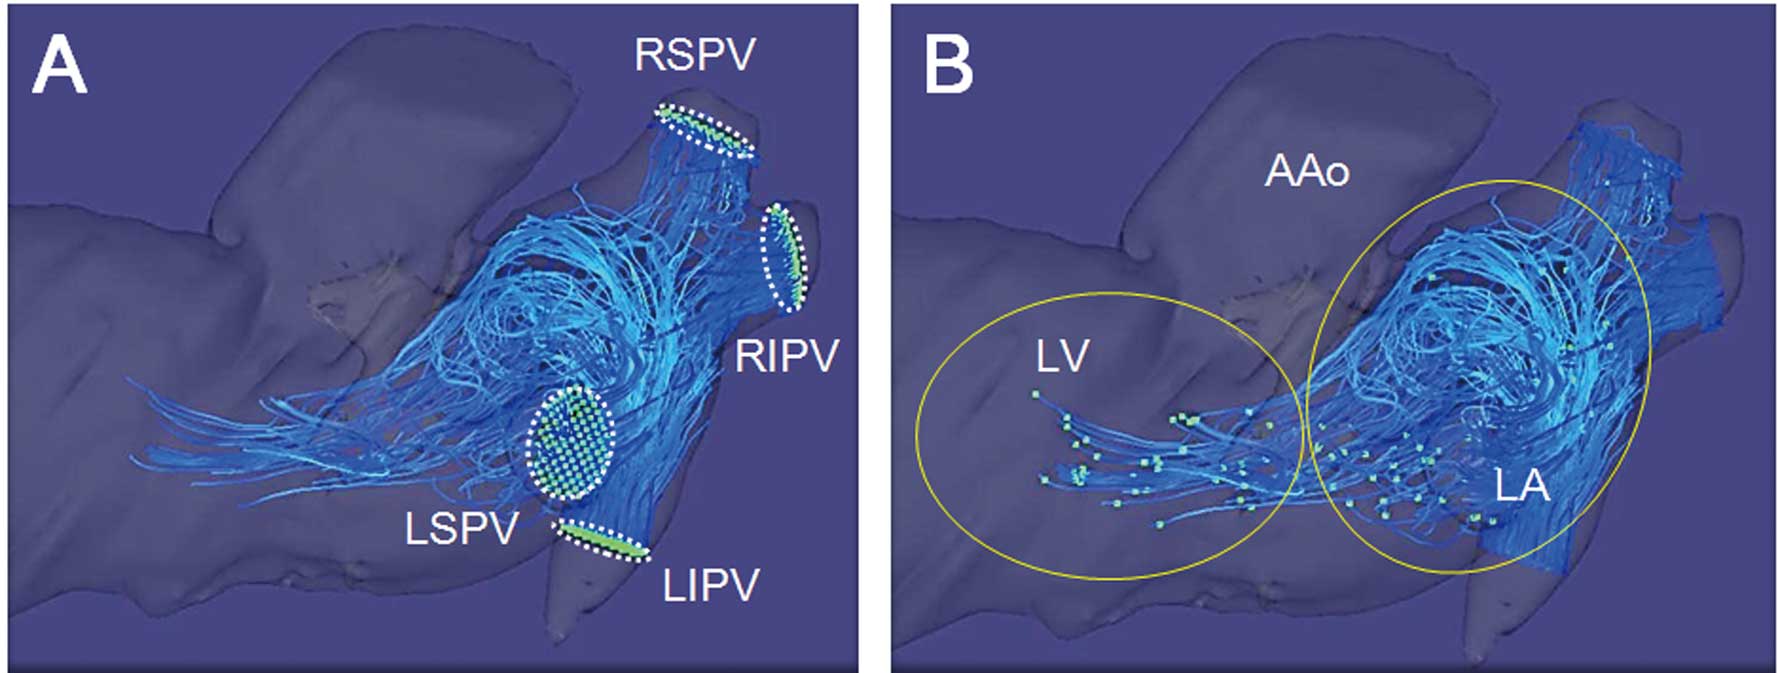
To visually identify intra-LA flow patterns, 3D visualization was used by an image analyzing software (Flova; R’-Tech Co, Hamamatsu, Japan). The 3D flow information was interpolated with the spatial resolution of 2×2×2 mm using the 3D data sets. We evaluated the number of PVs, setting 4 planes traversing PVs, subsequently generating 3D streamlines and pathlines using the Runge-Kutta method.22
The overall post processing time was approximately 60 min. We then evaluated the presence and timing of the vortex in the LA. The presence of vortex, as determined independently by 2 expert cardiologists (K.S. and T.S.) without knowledge of the clinical information, was defined as the presence of at least 1 streamline circuit in the LA. When there was a difference in opinion, the final assessment was determined in conference. Thereafter, we pursued the trace of blood particles from the PVs to the LV during a cardiac cycle using pathline imaging.
We also analyzed the angles between PVs and the LA using FSPGR MR angiographic data. The angle was measured between a perpendicular line from the entrance plane of each PV and the left heart axis (generated by a line between the center of the posterior wall of the LA and LV apex;
Figure 1). We finally obtained the maximum flow velocity curve of each PV by using image analyzing software (Flova), and the maximum flow velocity multiplied by the cross-sectional area of each PV was regarded as the maximum flow volume.
TTE
2D and Doppler modes of TTE were performed before MRI in all patients by experienced sonographers using a commercially available ultrasound system (iE33; Phillips Medical Systems, Andover, USA) equipped with a multi-frequency probe (2.5 MHz transducer). LV end-diastolic and end-systolic dimension (LVDd and LVDs), thickness of the inter-ventricular septum and posterior wall, and left atrial dimension were measured on B-mode images obtained in the parasternal long-axis view. In the apical view, the LA volume was calculated by the formula: 3/(8π)×(area in 4 chamber view×area in 2 chamber view/the shorter length of LA).23
Data of pulsed-wave Doppler (E wave, A wave, deceleration time of E, and the E/A ratio) and tissue Doppler (E’, A’ and E/E’) were obtained with the sample volume set at the tip of the mitral leaflet or at the septal annular border.
Statistical Analysis
Continuous data are expressed as mean±standard deviation or as medians with interquartile range, and categorical data are shown as numbers and percentages. Continuous variables were compared by the 2-sided unpaired t-test or Mann-Whitney U-test. Categorical variables were compared by using Fisher’s exact test. The inter-observer variability for the determination of the presence or absence of intra-LA vortex was evaluated by calculating Cohen’s κ coefficient. Values of P<0.05 were considered statistically significant. Additionally, a multivariate regression analysis was performed among MRI and TTE parameters that were associated with a P<0.05 within the univariate analyses. All the statistical analyses were performed using a statistical software package (SPSS 18.0; SPSS Inc, Chicago, IL, USA).
Results
Patient Characteristics
Baseline heart diseases are summarized in
Table 1. Seventeen patients had organic heart diseases, including prior myocardial infarction, dilated cardiomyopathy, hypertrophic cardiomyopathy, Takotsubo cardiomyopathy, aortic regurgitation or hypertensive heart disease. Patients without organic heart disease underwent cardiac MRI to assess for cardiac involvement of systemic scleroderma, sarcoidosis and mixed connective tissue disease or to rule out organic heart diseases in the context of non-sustained ventricular tachycardia and paroxysmal supraventricular tachycardia.
Table 1.
Baseline Heart Diseases
| |
Patients (n) |
| With organic heart disease |
17 (6) |
| Prior myocardial infarction |
8 (2) |
| Dilated cardiomyopathy |
3 (1) |
| Hypertrophic cardiomyopathy |
3 (2) |
| Takotsubo cardiomyopathy |
1 (1) |
| Aortic regurgitation |
1 (0) |
| Hypertensive heart disease |
1 (0) |
| Without organic heart diseases |
15 (14) |
| Systemic scleroderma |
7 (7) |
| Sarcoidosis |
5 (4) |
| Mixed connective tissue disease |
1 (1) |
| Non-sustained ventricular tachycardia |
1 (1) |
| Paroxysmal supraventricular tachycardia |
1 (1) |
The numbers in parentheses indicate the numbers of patients with intra-left atrial vortex.
The intra-LA 4D-Flow analysis was feasible in all patients. In the morphological analysis, 29 patients had 2 right PVs and 2 left PVs, whereas 3 patients had an additional right PV. Streamline images showed that 20 out of 32 patients had an intra-LA vortex flow. In the normal controls (healthy volunteers), 8 out of 9 subjects (88%) showed an intra-LA vortex flow. Inter-observer variability for the initial determination concerning the presence or absence of the vortex flow was small, with a κ strength of agreement of 0.867 (excellent agreement).
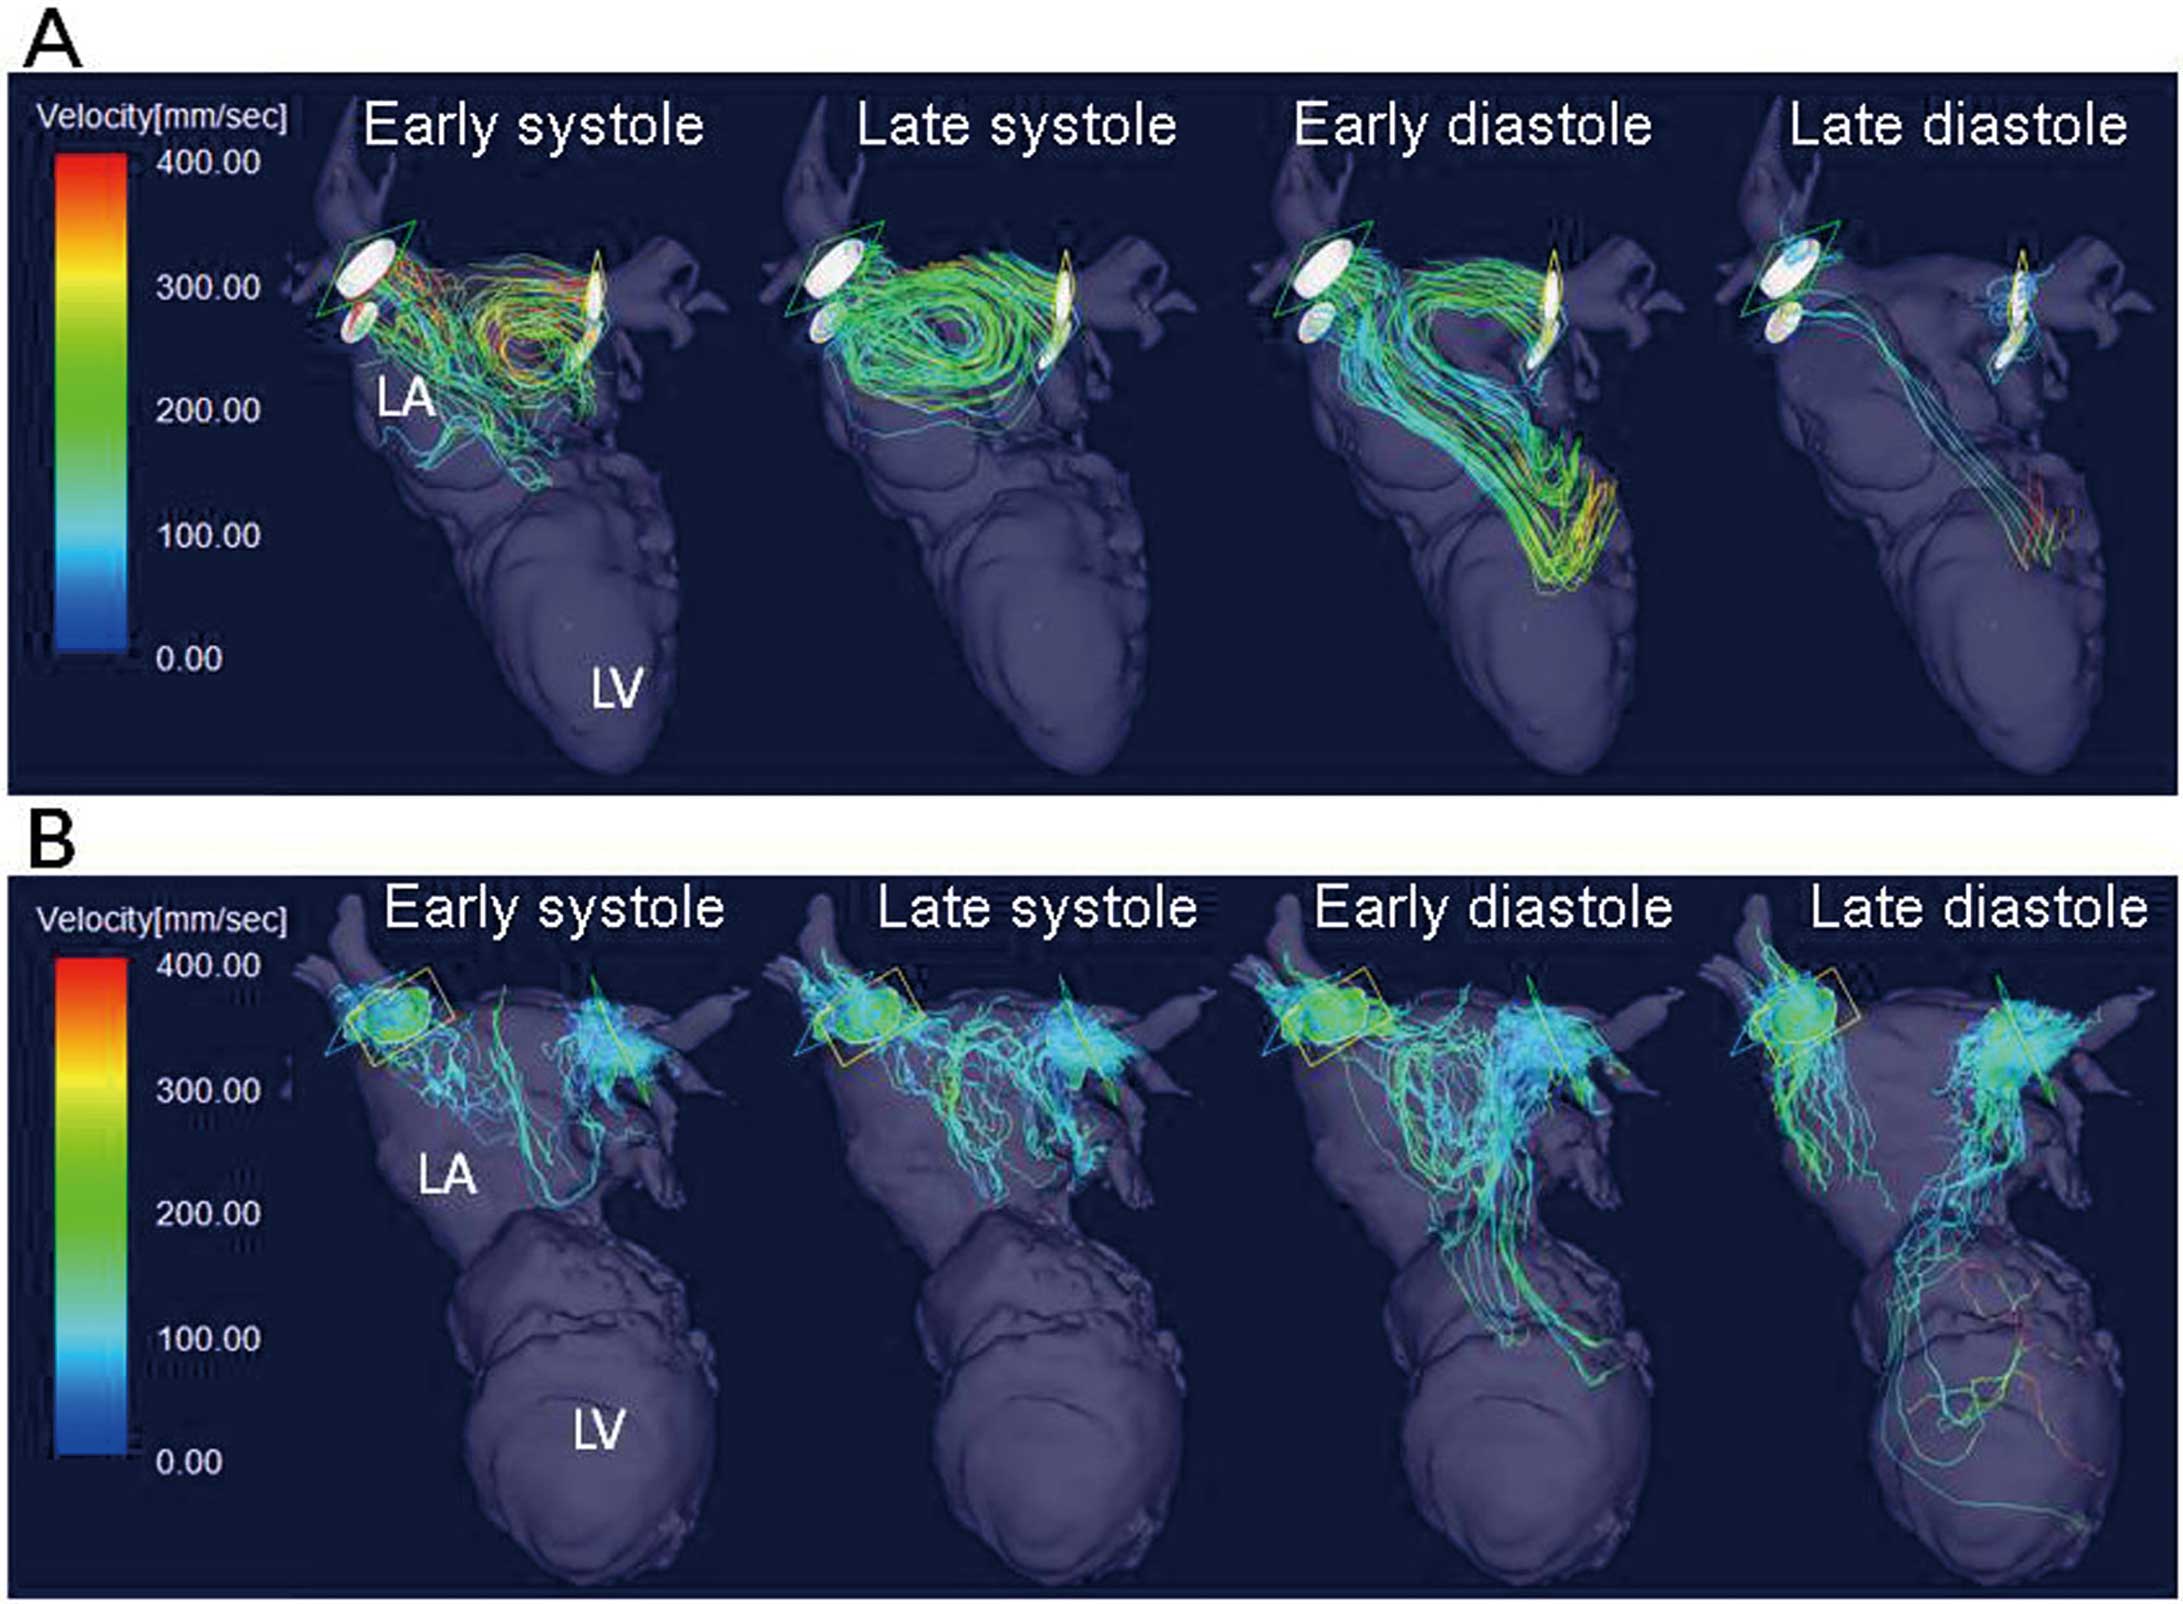
The representative images of a patient with a vortex are shown in
Figure 2A
(and
Movie S1). All the vortices developed during the ventricular late systolic phase and the early diastolic phase and were directed counter-clockwise when viewed from the subjects’ cranial side. In patients with vortices, most of the flow vectors from the right PVs lengthened toward the mitral valves, but some of the flow vectors were directed toward the LA appendage. The flow vectors from the left PVs were directed rightward along the posterior wall and joined the vortex (Figure 3A). In patients without vortex, the flow vectors from PVs did not rotate but collided with each other, as shown in
Figure 2B
(and
Movie S2) and
Figure 3B.
Figure 4
demonstrates representative pathline images in a patient with vortex at the early systolic (Figure 4A) and late diastolic phases (Figure 4B). Therein, most of the particles from each PV passed the LA with spiral flow patterns and reached the LV, whereas a small portion of them were retained in the LA.
To investigate factors contributing to the formation of intra-LA vortex, we initially compared clinical, MRI and TTE features between patients with and without vortex.
Table 2
shows that 11 patients (92%) without vortex had organic heart diseases, whereas only 6 patients (30%) with vortex had organic heart diseases (P<0.001). The serum NT-proBNP level in patients with vortex was significantly lower than that in those without vortex (P<0.001). There were no significant differences in other clinical features. With regard to MRI parameters, LVEDV and LVESV were significantly smaller in patients with vortex. With regard to TTE parameters, LA volume was significantly smaller in patients with vortex. A multivariate logistic regression analysis showed that LA volume was the only factor that related to the vortex formation when LVEDV, LVESV and LA volume were incorporated (Table 2). LVEDV, LVESV and LVEF in the normal controls (healthy volunteers) were 92.4±17.9 ml, 25.4±8.2 ml and 72.9±5.5%, respectively. The prevalence of intra-LA vortex in the normal controls was significantly larger than that in patients with organic heart diseases (P=0.009), but it was not different from those without organic heart disease (P=NS). The subject who did not show an intra-LA vortex was the oldest male (56 years old) in the normal controls.
Table 2.
Clinical, Magnetic Resonance Imaging and Transthoracic Echocardiography Features in Patients With and Without Vortex
| Variables |
Patients with
vortex (n=20) |
Patients without
vortex (n=12) |
P value |
| (A) Univariate analysis |
| Characteristic |
| Age (years) |
57±14 |
62±14 |
0.40 |
| Male |
10 (50) |
7 (58) |
0.72 |
| Height (cm) |
159±9 |
162±10 |
0.40 |
| Body weight (kg) |
57±15 |
65±17 |
0.16 |
| Organic heart diseases (%) |
6 (30) |
11 (92) |
<0.001 |
| Hypertension (%) |
7 (35) |
7 (58) |
0.28 |
| Diabetes mellitus (%) |
2 (10) |
2 (16) |
0.61 |
| Lipid disorder (%) |
7 (35) |
5 (41) |
0.72 |
| Smoking (%) |
3 (15) |
5 (41) |
0.11 |
| NT-proBNP (pg/ml) |
93 (43–253) |
1,943 (512–3,153) |
<0.001 |
| MRI data |
| LVEDV (ml) |
102±28 |
159±67 |
0.007 |
| LVESV (ml) |
43±25 |
91±59 |
0.009 |
| SV (ml) |
58±12 |
67±25 |
0.24 |
| LVEF (%) |
60±14 |
49±21 |
0.11 |
| TTE data |
| IVST (mm) |
9 (8–10) |
9 (7–10) |
0.86 |
| PWT (mm) |
10 (8–10) |
9 (9–10) |
0.54 |
| LAD (mm) |
32±6 |
38±10 |
0.07 |
| LA volume (ml) |
39±14 |
56±17 |
<0.001 |
| E wave (cm/s) |
74±20 |
78±35 |
0.74 |
| A wave (cm/s) |
74±24 |
71±26 |
0.80 |
| E/A ratio |
1.0 (0.9–1.3) |
1.2 (0.7–1.6) |
0.13 |
| Deceleration time (ms) |
210±48 |
217±66 |
0.74 |
| E’ (cm) |
7±2 |
6±3 |
0.30 |
| A’ (cm) |
9±2 |
8±3 |
0.37 |
| E/E’ ratio |
11 (9–12) |
13 (11–18) |
0.31 |
| Variables |
OR |
95% CI |
P value |
| (B) Multivariate logistic regression analysis |
| LVEDV (ml) |
0.98 |
0.92–1.1 |
0.75 |
| LVESV (ml) |
0.99 |
0.93–1.1 |
0.49 |
| LA volume (ml) |
0.92 |
0.86–0.99 |
0.03 |
CI, confidence interval; E/A ratio, the ratio of E and A waves in mitral inflow velocities; E/E’ ratio, the ratio of the E wave and early peak of diastolic annular velocity (E’); IVST, thickness of the inter-ventricular septum; LAD, left atrial dimension; LVDd and LVDs , left ventricular (LV) end-diastolic and end-systolic dimension; LVEDV and LVESV, LV end-diastolic and end-systolic volume; LVEF, LV ejection fraction; MRI, magnetic resonance imaging; NT-proBNP, N terminal pro-brain natriuretic peptide; OR, odds ratio; PWT, thickness of the LV posterior wall; TTE, transthoracic echocardiography; SV, stroke volume. Values are presented as mean±standard deviations (SD) or medians. Values in parentheses are first to third quartiles. The differences are examined by an unpaired t-test or Mann-Whitney U-test.
We examined angles between each PV and the left heart axis (Figure 1) and also examined flow velocity from each PV to the LA (eg,
Figure 5) in patients with or without vortex. There were no differences in the angles between patients with and without vortex (left superior PV [LSPV]: 112±13° vs. 111±16°; left inferior PV [LIPV]: 126±7° vs. 122±14°; right superior PV [RSPV]: 56±12° vs. 59±14°; right inferior PV [RIPV]: 48±12° vs. 56±17°; P=NS, respectively).
In contrast, the systolic peaks of maximal flow velocity from the left PVs and the RSPV were significantly greater in patients with vortex (Table 3). There were no differences in PV areas, and the systolic peak of maximal flow volume from the LSPV was also significantly greater in patients with vortex.
Table 3.
(A) Systolic Peak of Maximal Flow Velocity, (B) the Cross-Sectional Areas and (C) the Systolic Peaks of Maximal Flow Volume in PVs
| |
Patients with
vortex (n=20) |
Patients without
vortex (n=12) |
P value |
| (A) The systolic peak of maximal flow velocity (cm/s) |
| LSPV |
44.0 (37.2–49.8) |
25.0 (18.0–31.2) |
<0.001 |
| LIPV |
39.0 (31.1–47.6) |
20.3 (17.8–24.1) |
0.002 |
| RSPV |
46.7 (40.0–57.1) |
33.3 (28.8–36.8) |
0.002 |
| RIPV |
40.0 (34.8–47.6) |
33.2 (27.1–36.2) |
0.09 |
| (B) Cross-sectional area (cm2) |
| LSPV |
1.5 (1.2–1.6) |
1.4 (0.96–2.0) |
0.95 |
| LIPV |
0.97 (0.80–1.2) |
1.1 (0.81–1.4) |
0.74 |
| RSPV |
2.0 (1.6–2.6) |
2.2 (1.7–2.5) |
0.60 |
| RIPV |
1.5 (0.96–1.8) |
1.6 (1.2–1.9) |
0.72 |
| (C) The systolic peak of maximal flow volume (ml/s) |
| LSPV |
58.6 (52.3–82.4) |
32.8 (25.7–54.1) |
0.03 |
| LIPV |
42.1 (23.3–51.4) |
22.2 (15.7–35.8) |
0.05 |
| RSPV |
90.0 (48.6–12.4) |
72.2 (54.7–87.4) |
0.27 |
| RIPV |
52.9 (35.1–80.0) |
50.8 (36.1–58.0) |
0.55 |
LIPV, left inferior pulmonary vein (PV); LSPV, left superior PV; RIPV, right inferior PV; RSPV, right superior PV. Values are medians with interquartile ranges (in parentheses). The maximal flow volume is calculated by multiplying the maximal flow velocity and the cross-sectional area of each PV.
Discussion
The present study examined intra-LA flow dynamics in 32 patients with or without organic heart diseases and in 9 normal controls (healthy volunteers) using 4D-Flow. This study demonstrated that: (1) the streamline images revealed vortex flow in 20 patients and in 8 normal controls; (2) all the vortices developed during the ventricular late systolic phase and early diastolic phase and were directed counter-clockwise when viewed from the subjects’ cranial side; (3) the flow vectors from the right PVs mainly lengthened toward the mitral valves, and those from the left PVs were directed rightward along the posterior wall; and (4) patients with vortex had less organic heart diseases, smaller LV and LA volume, and greater maximal systolic flow velocity and volume, especially in the left PVs. This is the first report to clarify particular features of intra-LA blood flow and to examine potential factors contributing to intra-LA vortex formation.
Imaging of the Intra-LA Vortex With 4D-Flow
Recent developments in vector flow mapping in TTE has enabled evaluation of local flow dynamics in cardiac chambers,24
and this technique has been applied to various pathological states.25–27
However, this technique is available only in the 2D mode of TTE, is difficult to use in the evaluation of vortex, and is limited in terms of sub-optical images in patients with obesity or emphysema. 4D-Flow can clearly and non-invasively measure all 3D components of the vectors of blood velocity relative to all 4 spatio-temporal dimensions of the heart and great vessels, which has otherwise been difficult in TTE.3,28
Thus, 4D-Flow has the potential to allow detection of flow dynamic factors related to the initiation or progression of various heart and vessel diseases. To date, using 4D-Flow techniques, we have visualized hemodynamics in intra-cranial arteries, aneurysms, and celiac-mesenteric anastomosis.11–13
We have found formation of intra-LA vortex in approximately two-thirds of patients, according to streamline imaging. All the vortices developed during the late systolic phase and the early diastolic phase and were directed counter-clockwise when viewed from the subjects’ cranial side. The phase of vortex formation was similar to that found in previous studies. Kilner et al29
reported that the intra-LA vortex showed counter-clockwise rotation when viewed from the front, whereas Föll et al10
described both clockwise and counter-clockwise rotation. However, those studies did not analyze the cardiac phases of intra-LA flow vectors. By using the Flova software, we could observe the flow vectors from each PV separately and showed the phase-by-phase changes of intra-LA flow dynamics more precisely.
Factors Contributing to the Formation of Intra-LA Vortices
In the analysis of clinical features, patients with vortex had less organic heart diseases, and they showed smaller LV and LA volume when compared with those without vortex, while there were no differences in the LV functional parameters. A multivariate analysis regarded LA volume as a critical factor for the formation of vortex. Föll et al
showed that aging and high blood pressure decreased duration and velocity of intra-LA vortices, whereas heart rate or LVEF did not.10
We could not find any difference in age or prevalence of hypertension between patients with vs. without vortex, but the oldest subject among the normal controls (healthy volunteers) did not have vortex. Therefore, these factors could be potential for LA enlargement, and the estimation of LA size may predict the intra-LA flow dynamics.
We then examined factors that might affect the driving force to generate vortex flow in the LA. The angles between PVs and the left heart axis did not differ in patients with vs. without vortex. PVs might keep similar angles in the process of LA enlargement. Next, the maximal systolic flow velocity and volume from PVs, especially those from left PVs, were greater in patients with vortex. In patients with organic heart diseases, the increase in LA volume, overall decreases in the maximal systolic flow velocity and volume, and unbalanced flow between right and left PVs might decrease the driving force, thereby disturbing the formation of the intra-LA vortex.
Clinical Significance of Intra-LA Vortex
The physiological and pathological significance of intra-LA vortex remains elusive. In the present study, pathline images in a patient with vortex showed that most of the particles from each PV smoothly passed the LA without confliction during the cardiac cycle. Thus, the formation of an intra-LA vortex might help to maintain energy efficiency in flow dynamics from the PVs to the LV. Kilner et al also suggested that the intra-cardiac vortex flow in conjunction with the looped formation of the heart might be fundamental for stable blood flow, prevention of energy losses, and optimal atrial and ventricular coupling.29
Conversely, because patients without vortex had a larger LA volume, the disturbed intra-LA flow pattern might increase the wall stress, causing LA enlargement, decreased LV filling and a resultant worsening of cardiac function.
Furthermore, the flow vectors from the left PVs were directed rightward along the posterior wall, whereas those from the right PVs were directed toward the mitral valves and partly toward the LA appendage. These flow dynamics might play a role in the prevention of an intra-LA thrombus generation. In patients without vortex, the flow vectors from the left and right PVs collided with each other, and the intra-LA blood might stagnate and cause thrombus formation when atrial fibrillation is present. Further studies, especially in patients with paroxysmal atrial fibrillation or atrial fibrillation with relatively regular R-R, are necessary to clarify these issues.
Study Limitations
4D-Flow is not a real-time imaging modality; rather, data are derived from the summation of cyclically repeating flow. Hence, the long acquisition time (approximately 10 min) might be burdensome for patients and is vulnerable to the influence of ectopic heart beats and body movement, which might otherwise decrease the quality of the data. The low spatial and temporal resolution is another limitation of the 4D-Flow technique and also of analyses with the Flova software. While relatively large and stable flow can be visualized, unstable flow might be missed. Therefore, this technique cannot be applied to patients with irregular heartbeats (eg, those with atrial fibrillation and frequent ventricular/supraventricular premature contractions) or for the smaller chambers or vessels (eg, LA appendage and coronary arteries). The long post-processing time might also be a limitation when this technique is applied to large patient populations. We defined the presence of vortex by the consensus of the 2 observers and analyzed the characteristic features qualitatively but not quantitatively. Although inter-observer variability was small, data for the size, velocity and duration of vortex were lacking. The VENC setting at a relatively high velocity that might also decrease the signal to noise ratio, but this influence could mostly be resolved by a contrast enhancement. The development of new equipment and software is required for further reduction of total scan time with increased spatial and temporal resolution, and for automated determination and quantitative analyses of vortex flow. Finally, the small sample size, heterogeneous patient population and the definition of organic heart disease in the present study might limit extrapolations of our data to a more diverse group of patients.
Conclusions
4D-Flow clearly demonstrated intra-LA vortex formation and its characteristic features. Vortex formation might depend on the LV and LA volume, and on flow velocity and volume from the PVs. Further refinement of this technique and further studies in larger patient populations might help define the physiological and pathological significance of intra-LA flow dynamics.
Acknowledgments
The authors thank the sonographers in the clinical laboratory of Hamamatsu University Hospital for their help with the data collection in terms of TTE. This study was supported by the Ministry of Education, Culture, Sports, Science and Technology, Grants-in-Aid for Scientific Research (Grant Number 25461050).
Disclosures
Dr Wakayama is an employee of GE Healthcare Japan. The other members report no conflicts.
Supplementary Files
Supplementary File 1
Movie S1. A movie of intra-LA flow dynamics in a patient with vortex.
Supplementary File 2
Movie S2. A movie of intra-LA flow dynamics in a patient without vortex.
Please find supplementary file(s);
http://dx.doi.org/10.1253/circj.CJ-14-0562
References
- 1.
Thomas L, Levett K, Boyd A, Leung DY, Schiller NB, Ross DL. Compensatory changes in atrial volumes with normal aging: Is atrial enlargement inevitable? J Am Coll Cardiol 2002; 40: 1630–1635.
- 2.
Thomas L, Levett K, Boyd A, Leung DY, Schiller NB, Ross DL. Changes in regional left atrial function with aging: Evaluation by doppler tissue imaging. Eur J Echocardiogr 2003; 4: 92–100.
- 3.
Markl M, Kilner PJ, Ebbers T. Comprehensive 4D velocity mapping of the heart and great vessels by cardiovascular magnetic resonance. J Cardiovasc Magn Reson 2011; 13: 7.
- 4.
Kilner PJ, Yang GZ, Mohiaddin RH, Firmin DN, Longmore DB. Helical and retrograde secondary flow patterns in the aortic arch studied by three-directional magnetic resonance velocity mapping. Circulation 1993; 88: 2235–2247.
- 5.
Frydrychowicz A, Harloff A, Jung B, Zaitsev M, Weigang E, Bley TA, et al. Time-resolved, 3-dimensional magnetic resonance flow analysis at 3T: Visualization of normal and pathological aortic vascular hemodynamics. J Comput Assist Tomogr 2007; 31: 9–15.
- 6.
Frydrychowicz A, Berger A, Russe MF, Stalder AF, Harloff A, Dittrich S, et al. Time-resolved magnetic resonance angiography and flow-sensitive 4-dimensional magnetic resonance imaging at 3 tesla for blood flow and wall shear stress analysis. J Thorac Cardiovasc Surg 2008; 136: 400–407.
- 7.
Bachler P, Pinochet N, Sotelo J, Crelier G, Irarrazaval P, Tejos C, et al. Assessment of normal flow patterns in the pulmonary circulation by using 4D magnetic resonance velocity mapping. Magn Reson Imaging 2013; 31: 178–188.
- 8.
Fyrenius A, Wigstrom L, Ebbers T, Karlsson M, Engvall J, Bolgerc AF. Three dimensional flow in the human left atrium. Heart 2001; 86: 448–455.
- 9.
Fluckiger JU, Goldberger JJ, Lee DC, Ng J, Lee R, Goyal A, et al. Left atrial flow velocity distribution and flow coherence using four-dimensional flow MRI: A pilot study investigating the impact of age and pre- and post-intervention atrial fibrillation on atrial hemodynamics. J Magn Reson Imaging 2013; 38: 580–587.
- 10.
Föll D, Taeger S, Bode C, Jung B, Markl M. Age, gender, blood pressure, and ventricular geometry influence normal 3d blood flow characteristics in the left heart. Eur Heart J Cardiovasc Imaging 2013; 14: 366–373.
- 11.
Yamashita S, Isoda H, Hirano M, Takeda H, Inagawa S, Takehara Y, et al. Visualization of hemodynamics in intracranial arteries using time-resolved three-dimensional phase-contrast MRI. Magn Reson Imaging 2007; 25: 473–478.
- 12.
Isoda H, Ohkura Y, Kosugi T, Hirano M, Takeda H, Hiramatsu H, et al. In vivo hemodynamic analysis of intracranial aneurysms obtained by magnetic resonance fluid dynamics (MRFD) based on time-resolved three-dimensional phase-contrast MRI. Neuroradiology 2010; 52: 921–928.
- 13.
Mano Y, Takehara Y, Sakaguchi T, Alley MT, Isoda H, Shimizu T, et al. Hemodynamic assessment of celiaco-mesenteric anastomosis in patients with pancreaticoduodenal artery aneurysm concomitant with celiac artery occlusion using flow-sensitive four-dimensional magnetic resonance imaging. Eur J Vasc Endovasc Surg 2013; 46: 321–328.
- 14.
Thygesen K, Alpert JS, Jaffe AS, Simoons ML, Chaitman BR, White HD; The Writing Group on behalf of the Joint ESC/ACCF/AHA/WHF Task Force for the Universal Definition of Myocardial Infarction. Third universal definition of myocardial infarction. J Am Coll Cardiol 2012; 60: 1583–1597.
- 15.
Richardson C, McKenna W, Bristow M, Maisch B, Mautner B, O’Connell J, et al. Report of the 1995 World Health Organization/International Society and Federation of Cardiology task force on the definition and classification of cardiomyopathies. Circulation 1996; 93: 41–42.
- 16.
Eitel I, von Knobelsdorff-Brenkenhoff F, Bernhardt P, Carbone I, Muellerleile K, Aldrovandi A, et al. Clinical characteristics and cardiovascular magnetic resonance findings in stress (takotsubo) cardiomyopathy. JAMA 2011; 306: 277–286.
- 17.
Park SJ, Enriquez-Sarano M, Song JE, Lee YJ, Ha MR, Chang SA, et al. Contractile reserve determined on exercise echocardiography in patients with severe aortic regurgitation. Circ J 2013; 77: 2390–2398.
- 18.
Matoh F, Satoh H, Shiraki K, Saitoh T, Urushiba T, Katoh H, et al. Usefulness of delayed enhancement magnetic resonance imaging to differentiate dilated phase of hypertrophic cardiomyopathy and dilated cardiomyopathy. J Card Fail 2007; 13: 372–379.
- 19.
Markl M, Chan FP, Alley MT, Wedding KL, Draney MT, Elkins CJ, et al. Time-resolved three-dimensional phase-contrast MRI. J Magn Reson Imaging 2003; 17: 499–506.
- 20.
Bammer R, Hope TA, Aksoy M, Alley MT. Time-resolved 3d quantitative flow MRI of the major intracranial vessels: Initial experience and comparative evaluation at 1.5T and 3.0T in combination with parallel imaging. Magn Reson Med 2007; 57: 127–140.
- 21.
Lorensen WE, Cline HE. Marching cubes: A high resolution 3D surface construction algorithm. Comput Graph 1987; 21: 163–169.
- 22.
Liu Z, Moorhead RJ 2nd, Groner J. An advanced evenly-spaced streamline placement algorithm. IEEE Trans Vis Comput Graph 2006; 12: 965–972.
- 23.
Lang RM, Bierig M, Devereux RB, Flachskampf FA, Foster E, Pellikka PA, et al. Recommendations for chamber quantification: A report from the American society of echocardiography’s guidelines and standards committee and the chamber quantification writing group, developed in conjunction with the European association of echocardiography, a branch of the European society of cardiology. J Am Soc Echocardiogr 2005; 18: 1440–1463.
- 24.
Tanaka M, Sakamoto T, Sugawara S, Nakajima H, Katahira Y, Ohtsuki S, et al. Blood flow structure and dynamics, and ejection mechanism in the left ventricle: Analysis using echo-dynamography. J Cardiol 2008; 52: 86–101.
- 25.
Nogami Y, Ishizu T, Atsumi A, Yamamoto M, Kawamura R, Seo Y, et al. Abnormal early diastolic intraventricular flow ‘kinetic energy index’ assessed by vector flow mapping in patients with elevated filling pressure. Eur Heart J Cardiovasc Imaging 2013; 14: 253–260.
- 26.
Son JW, Park WJ, Choi JH, Houle H, Vannan MA, Hong GR, et al. Abnormal left ventricular vortex flow patterns in association with left ventricular apical thrombus formation in patients with anterior myocardial infarction: A quantitative analysis by contrast echocardiography. Circ J 2012; 76: 2640–2646.
- 27.
Tayyareci Y, Yildirimturk O, Aytekin V, Memic K. Preoperative left atrial mechanical dysfunction predicts postoperative atrial fibrillation after coronary artery bypass graft operation: A velocity vector imaging-based study. Circ J 2010; 74: 2109–2117.
- 28.
Inaba T, Yao A, Nakao T, Hatano M, Maki H, Imamura T, et al. Volumetric and functional assessment of ventricles in pulmonary hypertension on 3-dimensional echocardiography. Circ J 2013; 77: 198–206.
- 29.
Kilner PJ, Yang GZ, Wilkes AJ, Mohiaddin RH, Firmin DN, Yacoub MH. Asymmetric redirection of flow through the heart. Nature 2000; 404: 759–761.