Abstract
Background:
The difference between left atrial (LA) and systemic coagulation activity in paroxysmal atrial fibrillation (PAF) is unclear.
Methods and Results:
We enrolled 100 patients with PAF who underwent AF ablation. Warfarin was stopped 1 day before the procedure. LA volume index and LA emptying fraction were measured by 64-slice multidetector computed tomography. Immediately after transseptal puncture, blood samples were simultaneously collected from the LA and systemic circulation (SC). In addition, to evaluate the effect of warfarin on D-dimer levels we recruited an additional 27 PAF patients on continuous warfarin. Even in patients with low CHADS2
scores (mean 0.59±0.68) and during sinus rhythm, the prevalence of positive LA-D-dimer (≥0.5 µg/ml) was greater than that of SC-D-dimer (23% vs. 10%, P<0.01). The LA-D-dimer-positive patients had a larger mean LA volume index and reduced LA emptying fraction than the LA-D-dimer-negative patients. Multiple logistic regression analysis revealed that LA volume index was independently correlated with positive LA-D-dimer (odds ratio 2.245, 95% confidence interval 1.194−4.626, P=0.0112). The prevalence of positive LA-D-dimer was significantly lower in patients taking continuous warfarin, than in those on discontinuous warfarin (3.7% vs. 23%, P=0.025).
Conclusions:
An enlarged LA volume index was associated with high LA coagulation status in patients with paroxysmal AF. Adequate warfarin control during AF catheter ablation may reduce the prevalence of positive LA-D-dimer. (Circ J 2015; 79: 61–69)
Nonvalvular atrial fibrillation (AF) is associated with increased risk of stroke,1
usually from embolization of thrombus forming within the left atrial appendage (LAA).2
The Atrial Fibrillation Follow-up Investigation of Rhythm Management study revealed that thromboembolic stroke occurs in patients with paroxysmal AF (PAF) and a beneficial effect of warfarin therapy is observed in patients with AF, as well as those with a history of AF but who presumably remain in sinus rhythm (SR).3
However, few studies have evaluated the mechanism of hypercoagulability during SR in patients with PAF.
D-dimer is a fibrin degradation product that forms as a result of thrombogenesis and fibrinolysis. Elevated levels of circulating D-dimer reflect increases in blood coagulation, thrombin formation, and turnover of crosslinked intravascular fibrin, and all of these increases are relevant to several heart diseases.4–6
D-dimer levels in patients with AF has been reported,7,8
but those studies only evaluated D-dimer levels in the systemic circulation (SC). We investigated D-dimer levels in both the SC and the LA, because we hypothesized there would be a significant difference between SC and LA hypercoagulability in patients with AF. The aim of the present study was to investigate (1) whether there was a significant difference between D-dimer levels in the SC and the LA in patients with AF who were undergoing pulmonary vein (PV) isolation and (2) the effect of warfarin control on D-dimer levels in these patients.
Methods
Study Population
Between January 2010 and January 2012, 108 patients with PAF who underwent catheter ablation at Yamagata University Hospital were considered for the study. Exclusion criteria were a history of valvular heart disease, left ventricular (LV) dysfunction, congenital heart disease, or myocardial infarction; unstable angina; surgical or ablation procedure within the preceding 3 months; chronic conditions including infection, renal failure, liver disease; and antiplatelet agent use. We excluded 8 patients because of dabigatran use, so finally enrolled 100 consecutive patients with PAF who were confirmed by continuous monitoring to be in SR ≥48 h before the ablation procedure. All patients underwent baseline transthoracic echocardiography and transesophageal echocardiography within 1 week of the procedure. All antiarrhythmic medications were discontinued 5 half-lives before the procedure, with the exception of amiodarone, which was discontinued ≥6 weeks before the procedure. All patients underwent anticoagulation with warfarin ≥6 weeks before the procedure. The target international normalized ratio (INR) range was defined according to the Japanese guidelines for AF pharmacotherapy: 2.0–3.0 in younger patients (<70 years old) and 1.6–2.6 in elderly patients (≥70 years old).9
Warfarin was stopped 1 day before the procedure and heparin bridging was discontinued 12 h before the procedure. In addition, to evaluate the effect of anticoagulation treatment on D-dimer levels we recruited an additional 27 PAF patients who underwent AF ablation while on continuous warfarin between February 2012 and July 2012. With the same exclusion criteria and blood sampling protocol as above, these consecutive AF patients on continuous warfarin were evaluated. To assess the quality of warfarin control, preprocedural (pre) PT-INR levels on the day of echocardiography (1 week before catheter ablation) were evaluated in 71 patients (71%) on discontinuous warfarin and 22 patients (81%) on continuous warfarin.
Written informed consent was provided by all patients prior to study participation, and the study protocol was approved by the institutional Human Investigations Committee.
Blood Sampling During Catheter Ablation
For the clinical procedure, a conventional single transseptal puncture was performed using a Mullins Transseptal Catheter Introducer (Medtronic Inc, Minneapolis, MN, USA) and a BRK-1 needle (St. Jude Medical Inc, Sunnyvale, CA, USA). Immediately after transseptal puncture and before heparin administration, blood samples were simultaneously collected by 2 cardiologists from the jugular venous sheath (SC sample) and LA sheath. Samples were carefully collected using a slow withdrawal technique10
with the first 10 ml discarded, and the samples then transferred into vacutainer tubes containing 1/10 volume sodium citrate (0.13 mol/L). Blood samples were sent to the hospital laboratory for immediate analysis by immunoturbidometric assay (LPIA-ACE-D-Ddimer II; Mitsubishi Chemical, Tokyo, Japan) with an ACL TOP Family system (Instrumentation Laboratory, Bedford, MA, USA). The detection limit of this assay is 0.5 µg/ml. A D-dimer level ≥0.5 µg/ml was evaluated as a continuous variable. A cutoff value for D-dimer (0.5 µg/ml) was determined based on a previous report.8
Imaging
Cardiac multidetector computed tomography (MDCT) was performed using a 64-slice MDCT scanner (Aquilion 64, Toshiba, Tokyo, Japan). Nitroglycerin was orally administered before scanning. A total of 51–100 ml of contrast media was injected, depending on the patient’s body weight. We used an automatic algorithm in the analysis software (ZIO station, ZIO SOFT Inc, Tokyo, Japan) to calculate LA volumetry, as previously described.11
The LA endocardial border, excluding PVs and the LAA, was manually traced to obtain an area measurement for each slice. By integrating the area measured in each slice along the LA long axis, the LA volume was obtained in each phase of the cardiac cycle. LA emptying fraction was calculated as follows: LA emptying fraction=(maximum LA volume–minimum LA volume)/maximum LA volume×100.12
Echocardiography
Transthoracic echocardiography was performed 7 days before catheter ablation on a Hewlett-Packard/Philips Sonos 7500 ultrasound instrument (Philips Healthcare, Amsterdam, The Netherlands) equipped with a sector transducer (carrier frequency of 2.5 or 3.75 MHz). A 5-MHz phased-array multiplane probe was used for transesophageal echocardiography. LA dimension was measured at end-systole in the 2-dimensional parasternal long-axis view. LV internal diameter and wall thickness were measured at end-diastole and end-systole in the 2-dimensional parasternal long-axis view. LV ejection fraction (LVEF) was calculated using the biplanar method of disks (modified Simpson rule). The peak early (E’) mitral annular velocity was measured, and the ratio of the E-wave to E’ (E/E’) was calculated, as previously described.13
All echocardiographic measurements were calculated as the mean of 5 consecutive cardiac cycles.14
LAA thrombus was diagnosed when a fixed or mobile echogenic mass could be clearly differentiated from the wall of the LA or LAA.13
The severity of spontaneous echocardiographic contrast (SEC) was graded from 0 to 4+ by 2 independent observers who were unaware of the blood data: 0=none; 1+=mild; 2+=mild to moderate; 3+=moderate; and 4+=severe.15
Radiofrequency Catheter Ablation
After a transseptal catheterization, a 7Fr 10-polar ring catheter (Lasso, Biosense Webster, Inc, Diamond Bar, CA, USA) and a 7Fr quadripolar ablation catheter with a 3.5-mm distal electrode and deflectable tip (ThermoCool, Biosense Webster) were positioned in the LA. Intravenous heparin was given to maintain an activated clotting time of 300–350 s during the entire procedure. After selective PV angiography, the single Lasso catheter was positioned inside the PV within 5 mm of the ostium to map PV potentials. Radiofrequency energy was delivered using the temperature control mode with a target temperature of 42℃ and maximum power output of 25–35 W. The endpoint of PV isolation was the creation of an extensive ipsilateral bidirectional conduction block, which was confirmed from the atrium to the PVs and vice versa. The bidirectional conduction block was reconfirmed at least 60 min after successful PV isolation.16
Follow-up After Ablation
The patients remained hospitalized under continuous rhythm monitoring for at least 3 days after the procedure. After discharge, all patients underwent follow-up at 2 weeks post-procedure and then every month. At each hospital visit, the patients underwent 12-lead electrocardiography and intensive questioning regarding any thromboembolic-related symptoms. We performed 24-h Holter monitoring 1, 3, 6, and 12 months after PV isolation.16
Statistical Analysis
Continuous variables are expressed as mean±standard deviation. Skewed variables are presented as median with interquartile range. We used t-tests and chi-square tests to compare continuous and categorical variables, respectively. When the data were not normally distributed, the Mann-Whitney test was used. Uni- and multivariate analyses with a Cox proportional hazard regression model were used to determine significant predictors of LA-D-dimer positivity. Variables that were significant in the univariate analysis were entered into the multivariate Cox proportional hazard analysis. Receiver-operating characteristics (ROC) curves for the LA volume index was constructed to determine the optimal cutoff values for sensitivity and specificity. The area under the curve for LA-D-dimer positivity was calculated according to the trapezoidal rule. A P-value <0.05 was considered statistically significant.
Results
Patients Characteristics
In the first phase of the study involving 100 patients, all underwent successful transseptal puncture and PV isolation, and there were no complications or deaths at 30 days post-procedure. The clinical characteristics of the 100 study subjects are shown in
Table 1. Their mean age was 58±9 years (range, 29–72 years), and 30% were female. A total of 34 patients had hypertension, and diabetes mellitus was identified in 25. However, no patients had a history of congestive heart failure, stroke, or transient ischemic attack (TIA). There were 52, 37, and 11 patients with a CHADS2
score of 0, 1, and 2, respectively. Echocardiographic findings showed no structural heart disease (mean LA diameter, 38.4 mm; mean LVEF, 64.5%; mean E/E’ ratio, 7.5). No LAA thrombus was found. Among patients with positive LA-D-dimer, SEC scores of 0, 1+, 2+, and 3+ were found in 12, 9, 1, and 1 patient, respectively. The prevalence of SEC grades did not differ between patients with positive or negative LA-D-dimer. CT showed that the LA volume index was 57±15 ml/m2
and the LA emptying fraction was 44±8.2%. As for medications, 30 patients received angiotensin-converting enzyme inhibitors and/or angiotensin-receptor blockers. β-blockers were administered to 31 patients during the procedure. After transient interruption of warfarin, 22 patients had a prothrombin INR (PT-INR) ≥2.0.
Table 1.
Clinical Characteristics of Patients With Positive and Negative LA-D-Dimer Levels
| |
All patients
(n=100) |
Positive LA-D-dimer
(n=23) |
Negative LA-D-dimer
(n=77) |
P value |
| Age, years |
58±9 |
59.2±9.0 |
57.7±0.68 |
0.470 |
| Female, n (%) |
30 |
9 (39.1) |
21 (27.3) |
0.276 |
| Body mass index (kg/m2) |
24±3 |
23.2±3.0 |
23.6±2.8 |
0.559 |
| Duration of AF, years |
4.7±3.1 |
5.4±3.1 |
4.4±3.1 |
0.262 |
| History of CHF, n |
0 |
0 |
0 |
|
| Hypertension, n (%) |
34 |
10 (43.4) |
24 (31.1) |
0.460 |
| Diabetes mellitus, n (%) |
25 |
4 (17.4) |
21 (27.3) |
0.340 |
| History of stroke/TIA, n |
0 |
0 |
0 |
|
| CHADS2 score 0/1/2 |
52/37/11 |
11/10/2 |
41/27/9 |
0.747 |
| Mean CHADS2 score |
0.59±0.68 |
0.61±0.65 |
0.58±0.69 |
0.882 |
| Echocardiography |
| LA diameter, mm |
38.4±5.8 |
38.6±7.7 |
38.4±5.1 |
0.867 |
| LVEF, % |
64.5±8.1 |
65.2±7.2 |
64.3±8.4 |
0.670 |
| E/E’ ratio |
7.5±2.8 |
8.1±2.3 |
7.3±2.9 |
0.348 |
| SEC 0/1+/2+/3+/4+ |
44/44/11/1/0 |
12/9/1/1/0 |
32/35/10/0/0 |
0.160 |
| Computed tomography |
| LA volume index, ml/m2 |
57±15 |
64.9±15.1 |
54.2±13.7 |
0.002 |
| LA emptying fraction, % |
44±8.2 |
40.5±10.1 |
45.5±7.3 |
0.013 |
| Medications |
| ACEI and/or ARBs, n (%) |
30 |
8 (34.8) |
22 (28.6) |
0.828 |
| β-blockers, n (%) |
31 |
5 (21.7) |
26 (33.8) |
0.124 |
| Warfarin,# n (%) |
100 |
23 (100) |
77 (100) |
– |
| Baseline blood examination |
| Positive SC-D-dimer (%) |
10 |
7 (30.4) |
3 (3.9) |
<0.001 |
| Pre PT-INR* |
1.99±0.44 |
1.92±0.53 |
2.00±0.41 |
0.546 |
| Pre PT-INR ≥2.0,* n (%) |
28 (39.4) |
3 (21.4) |
25 (43.9) |
0.124 |
| PT-INR# |
1.70±0.50 |
1.63±0.55 |
1.72±0.47 |
0.443 |
| PT-INR ≥2.0,# n (%) |
22 |
3 (13.0) |
19 (24.6) |
0.217 |
| HbA1c, % |
5.5±0.5 |
5.4±0.5 |
5.5±0.5 |
0.403 |
| BNP, pg/ml (IQR) |
33.2 (15.4–53.4) |
30.6 (14.2–52.3) |
33.5 (15.5–54.2) |
0.352 |
| hs-CRP, mg/dl (IQR) |
0.05 (0.03–0.09) |
0.04 (0.02–0.08) |
0.05 (0.03–0.09) |
0.723 |
Data are presented as mean±SD. *Pre PT-INR measured 1 week before catheter ablation (n=71); #warfarin therapy ceased 1 day before blood sampling from left atrium. ACEI, angiotensin-converting enzyme inhibitors; AF, atrial fibrillation; ARB, angiotensin-receptor blocker; BNP, brain natriuretic peptide; CHADS2 score: Congestive heart failure, Hypertension, Age ≥75, Diabetes mellitus, prior Stroke or transient ischemic attack (TIA); HbA1c, glycated hemoglobin; hs-CRP, high-sensitivity C-reactive protein; IQR, interquartile range; LA, left atrial; LVEF, left ventricular ejection fraction; PT-INR, prothrombin international normalized ratio; SC, systemic circulation; SD, standard deviation; SEC, spontaneous echocardiographic contrast.
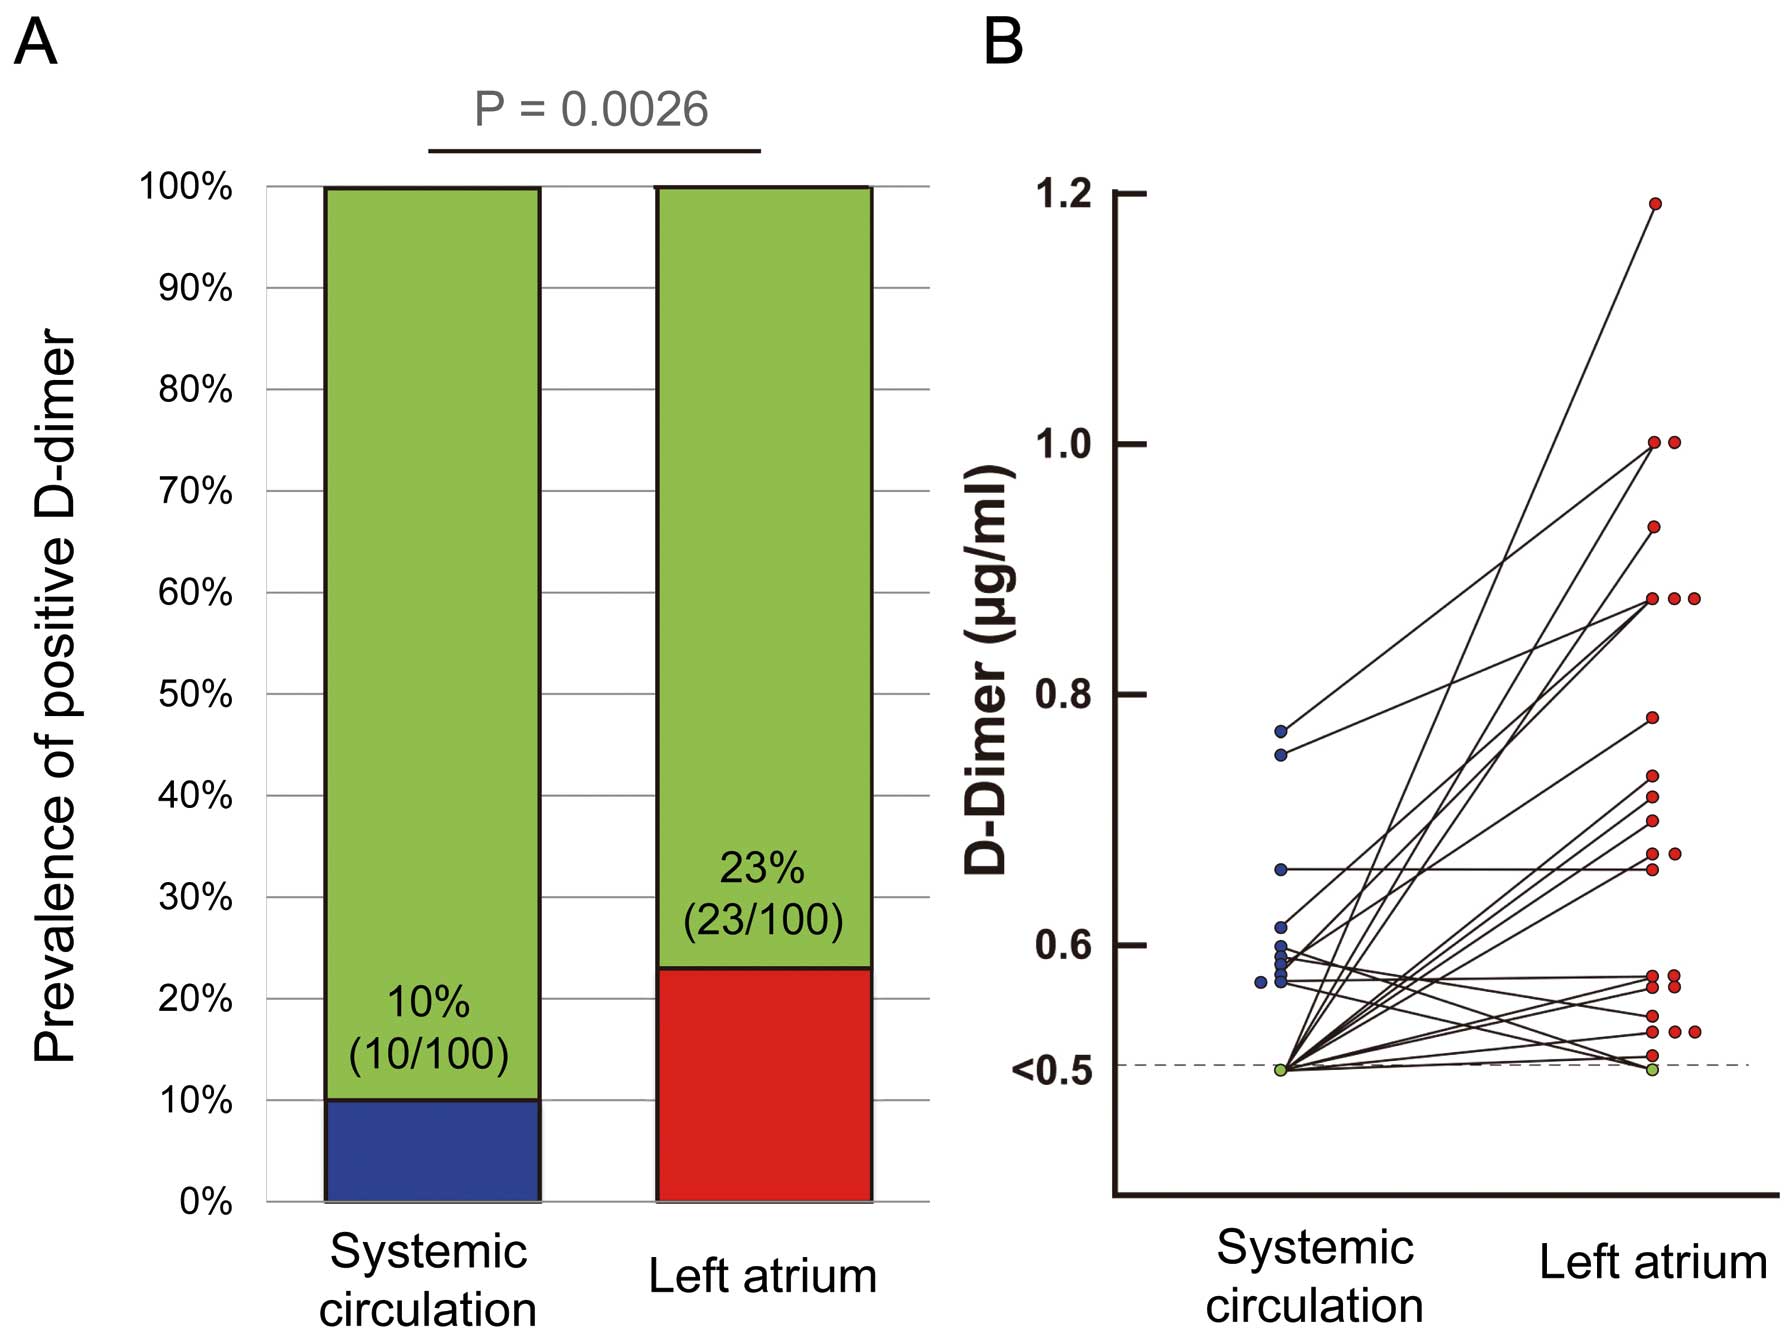
In this study, D-dimer levels ranged from <0.5 to 1.18 µg/ml. The prevalence of D-dimer positivity (≥0.5 µg/ml) was 10% in the SC and 23% in the LA (Figure 1A). D-dimer levels in the LA (LA-D-dimer) were higher than or equal to D-dimer levels in the SC (SC-D-dimer) in most patients (20/23, 87%) (Figure 1B). Among patients with a CHADS2
score of 0, the prevalence of D-dimer positivity did not differ between the SC and LA [11.5% (6/52) vs. 21.2% (11/52), P=0.182]. In patientn with a CHADS2
score of 1, the prevalence of D-dimer positivity was lower in the SC than in the LA [8.1% (3/37) vs.27% (10/37), P=0.029]. In patients with a CHADS2
score of 2, the prevalence of D-dimer positivity did not differ between the SC and LA [9.1% (1/11) vs.18.2% (2/11), P=0.531].
Patients who were positive for LA-D-dimer had a larger mean LA volume index (P=0.002) and decreased LA emptying fraction (P=0.013) than those who were negative for LA-D-dimer. Positive SC-D-dimer prevalence was greater in patients who were positive for LA-D-dimer (P<0.001). There were no significant differences in any other clinical characteristics or medications used (Table 1).
Predictors of LA-D-Dimer Positivity
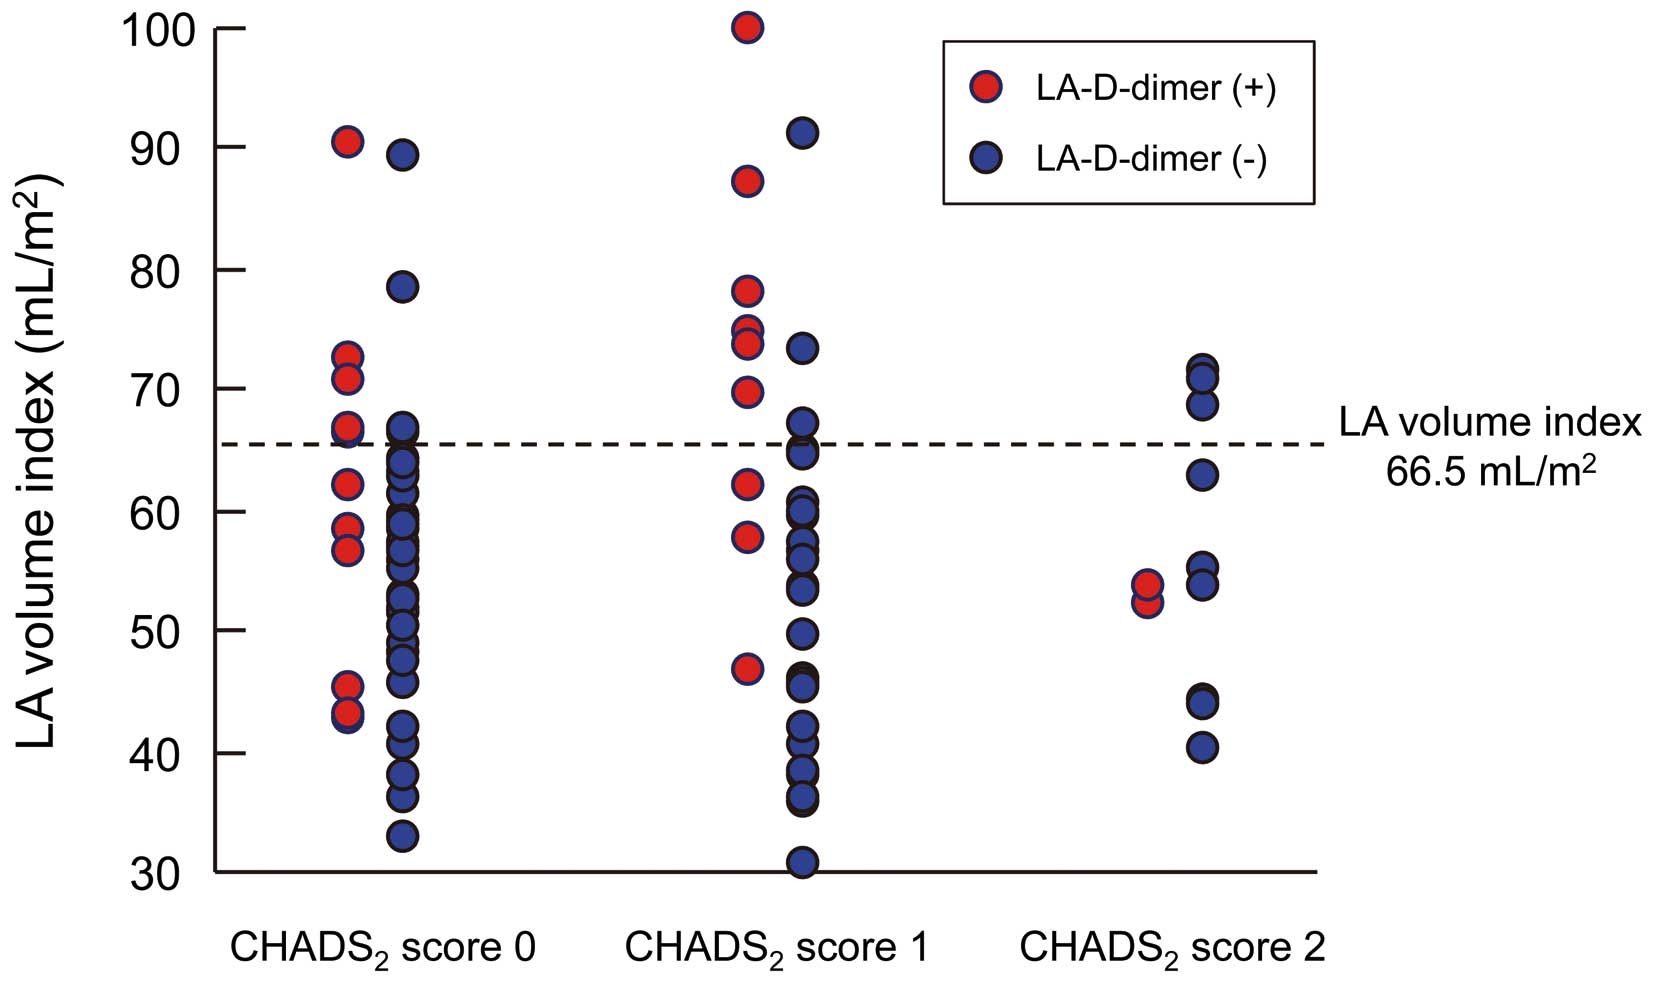
Univariate Cox analysis showed that the LA volume index and LA emptying fraction were significantly associated with LA-D-dimer positivity, but SEC score and pre PT-INR level were not. Multivariate Cox analysis revealed that LA volume index alone was an independent predictor of positive LA-D-dimer status (odds ratio [OR] 2.245, 95% confidence interval [CI] 1.194−4.626, P=0.011) (Table 2). The ROC curve analysis revealed that a LA volume index of 66.5 ml/m2
was the threshold value for LA-D-dimer positively (sensitivity, 49%; specificity, 88%; area under the curve, 0.69). The association between LA volume index, LA-D-dimer and CHADS2
score is shown in
Figure 2. The prevalence of LA-D-dimer positively was higher in patients with a large LA volume index (>66.5 ml/m2) compared with those with a preserved LA volume index (≤66.5 ml/m2).
Table 2.
Uni- and Multivariate Analyses of Factors Predicting Positive LA-D-Dimer in Patients With AF
| |
OR |
95% CI of OR |
P value |
| Univariate analysis |
| Age, per SD (9-year) increase |
1.206 |
0.739–252.6 |
0.457 |
| Male sex |
1.714 |
0.631–4.526 |
0.284 |
| Body mass index, per 1 kg/m2 increase |
0.950 |
0.795–1.123 |
0.552 |
| Duration of AF, per 1-year increase |
1.101 |
0.930–1.305 |
0.260 |
| Presence of |
| Hypertension |
1.481 |
0.519–4.284 |
0.460 |
| Diabetes mellitus |
0.561 |
0.150–1.708 |
0.323 |
| CHADS2 score, per SD (0.68) increase |
1.036 |
0.641–1.634 |
0.881 |
| Echocardiography |
| LA diameter, per SD (5.8 mm) increase |
1.041 |
0.632–1.720 |
0.865 |
| LVEF, per SD (8.1%) increase |
1.119 |
0.689–1.893 |
0.661 |
| E/E’ ratio, per SD (2.8) increase |
1.313 |
0.970–2.336 |
0.347 |
| Nonspontaneous echocardiographic contrast |
1.534 |
0.602–3.909 |
0.370 |
| Computed tomography |
| LA volume index, per SD (15 ml/m2) increase |
2.363 |
1.366–6.771 |
0.001 |
| LA emptying fraction, per SD (8.2%) increase |
0.571 |
0.351–0.913 |
0.017 |
| Use of |
| ACEI and/or ARBs, n |
1.124 |
0.381–3.224 |
0.829 |
| β-blockers, n |
0.412 |
0.120–1.239 |
0.117 |
| Blood examination |
| Pre PT-INR,* per SD (0.44) increase |
0.628 |
0.141–2.796 |
0.527 |
| Pre PT-INR ≥2.0* |
0.349 |
0.088–1.387 |
0.118 |
| PT-INR,# per SD (0.50) increase |
0.815 |
0.466–1.330 |
0.428 |
| PT-INR ≥2.0# |
0.458 |
0.122–1.713 |
0.217 |
| HbA1c, per SD (0.5%) increase |
0.809 |
0.474–1.293 |
0.388 |
| BNP, per SD (52.9 pg/ml) increase |
1.235 |
0.767–1.880 |
0.367 |
| hs-CRP, per SD (0.19 mg/dl) increase |
1.085 |
0.623–1.673 |
0.729 |
| Multivariate analysis |
| Computed tomography |
| LA volume index, per SD (15 ml/m2) increase |
2.245 |
1.194–4.626 |
0.011 |
| LA emptying fraction, per SD (8.2%) increase |
0.768 |
0.446–1.312 |
0.330 |
*Pre PT-INR measured 1 week before catheter ablation (n=71); #warfarin therapyceased 1 day before blood sampling from left atrium.
CI, confidence interval; OR, odds ratio. Other abbreviations as in Table 1.
There were 15 patients who had positive LA-D-dimer and negative SC-D-dimer. As an additional analysis, univariate Cox analysis of these patients was performed. Neither the LA volume index (OR 0.966, 95% CI 0.928−1.005, P=0.088) nor the LA emptying fraction (OR 1.056, 95% CI 0.993−1.124, P=0.082) was associated with positive LA-D-dimer and negative SC-D-dimer.
Correlations Between LA-D-Dimer Level and Other Variables
The correlations between LA-D-dimer levels and other variables were examined among 23 patients who were positive for LA-D-dimer (Table 3). The LA-D-dimer level positively correlated with the LA volume index (r=0.598, P=0.004), but not with any of the other variables.
Table 3.
Relationships Between Clinical Parameters and LA-D-Dimer Level
| |
LA-D-dimer |
| r |
P value |
| Age |
0.287 |
0.207 |
| Body mass index |
−0.425 |
0.055 |
| Duration of AF |
0.005 |
0.983 |
| CHADS2 score |
0.284 |
0.213 |
| Echocardiography |
| LA diameter |
0.031 |
0.890 |
| LVEF |
−0.048 |
0.845 |
| E/E’ ratio |
−0.165 |
0.589 |
| Computed tomography |
| LA volume index |
0.598 |
0.004 |
| LA emptying fraction |
−0.389 |
0.090 |
| Blood examination |
| PT-INR |
−0.030 |
0.897 |
| HbA1c |
0.085 |
0.722 |
| BNP |
0.210 |
0.361 |
| hs-CRP |
−0.007 |
0.973 |
Abbreviations as in Table 1.
In the second phase of the study involving a further 27 patients on continuous warfarin, all underwent successful transseptal puncture and PV isolation, and there were no complications or deaths at 30 days post-procedure. The clinical characteristics of these study subjects are shown in
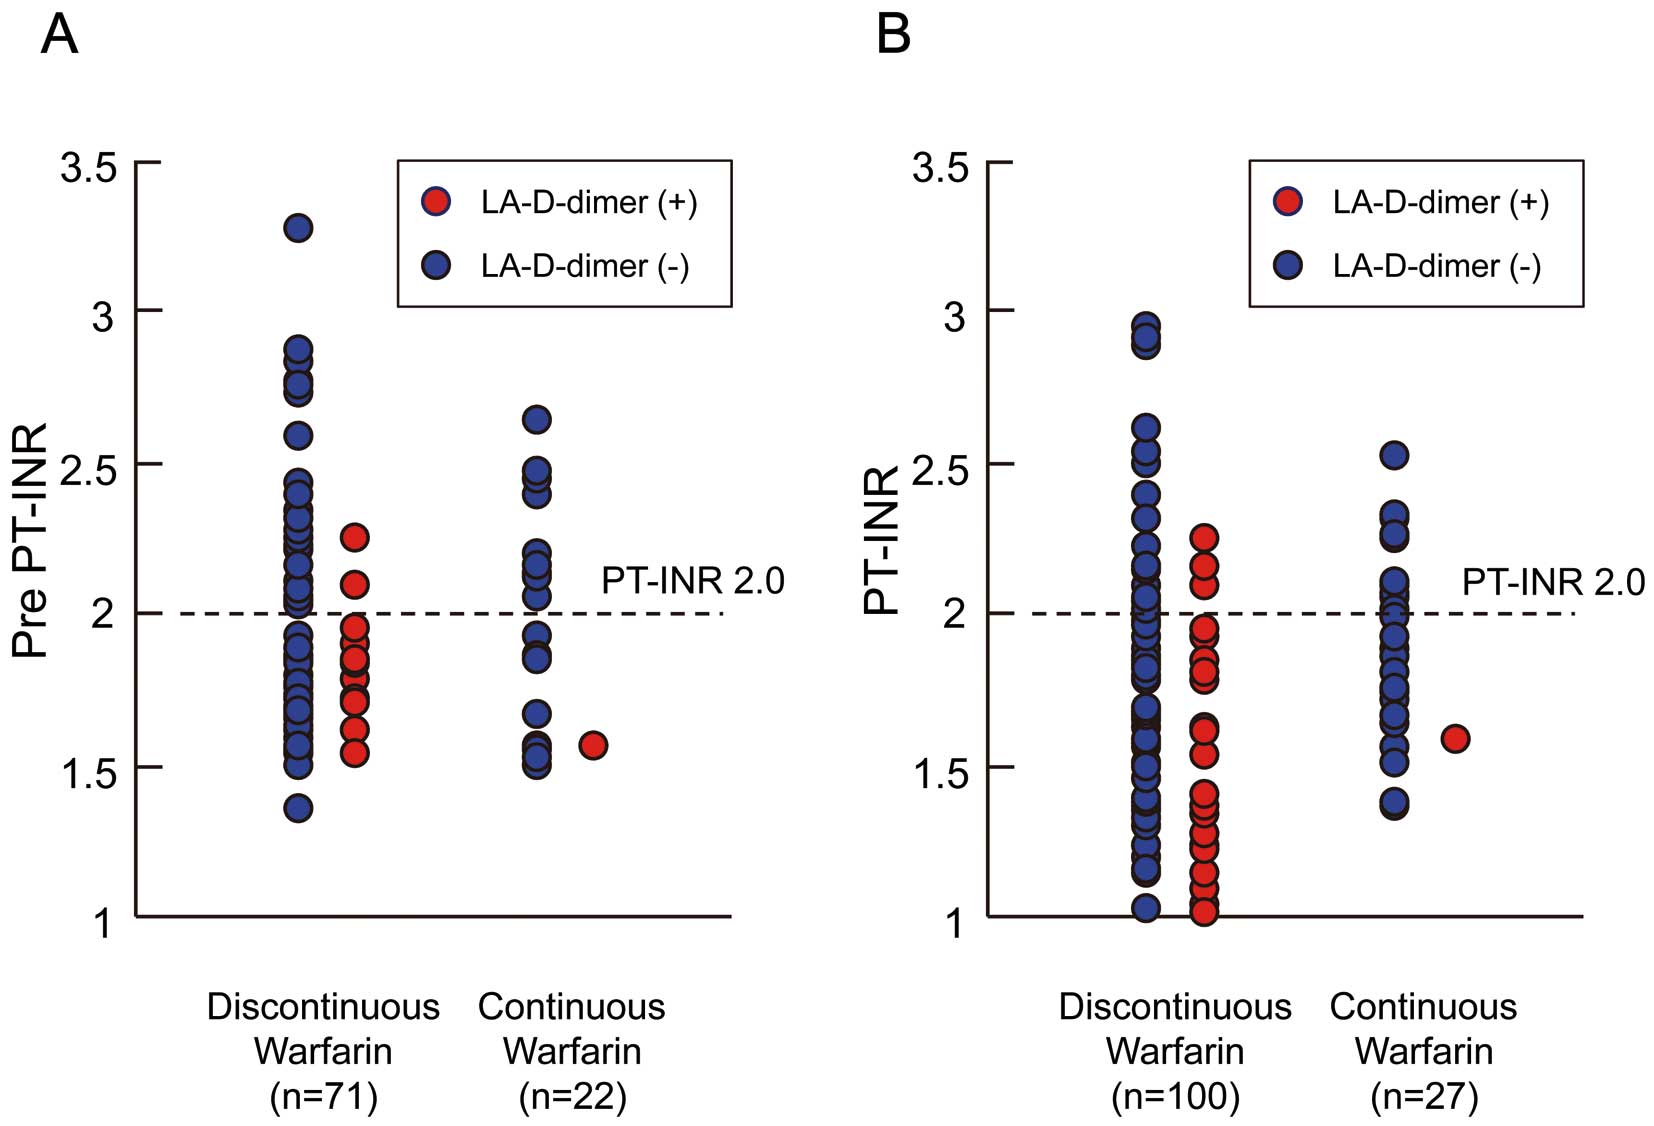
Table 4. The pre PT-INR levels were not different between the patients on discontinuous or continuous warfarin (1.99±0.44 vs. 1.95±0.35, P=0.692) (Figure 3A). The prevalence of pre PT-INR ≥2 was not different between the 2 groups (39.4% vs. 45.5%, P=0.616). The prevalence of pre PT-INR ≥1.6 was also not different between the 2 groups (72.1% vs. 70.8%, P=0.904). PT-INR levels on the day of blood sampling from the LA showed that patients on continuous warfarin were well controlled (1.70±0.50 vs. 1.91±0.31, P=0.03). PT-INR ≥2.0 were confirmed in 22% of those on discontinuous warfarin and in 44.4% of those on continuous warfarin. The prevalence of positive LA-D-dimer was significantly lower in patients on continuous warfarin than in those on discontinuous warfarin [1/27 (3.7%) vs. 23/100 (23%), P=0.025]. Of the patients with PT-INR ≥2, only 3 showed positive LA-D-dimer. Adequate warfarin control may reduce the prevalence of positive LA-D-dimer (Figure 3B).
Table 4.
Clinical Characteristics of Patients on Discontinuous or Continuous Warfarin Therapy
| |
Discontinuous warfarin
(n=100) |
Continuous warfarin
(n=27) |
P value |
| Age, years |
58±9 |
60±10 |
0.59 |
| Female, n (%) |
30 |
5 (18.5) |
0.33 |
| Body mass index (kg/m2) |
24±3 |
24±3.1 |
0.59 |
| Duration of AF, years |
4.7±3.1 |
6.2±6.6 |
0.63 |
| History of CHF, n (%) |
0 |
1 (3.7) |
0.22 |
| Hypertension, n (%) |
34 |
9 (33.3) |
0.73 |
| Diabetes mellitus, n (%) |
25 |
2 (7.4) |
0.28 |
| History of stroke/TIA, n |
0 |
2 (7.4) |
0.12 |
| CHADS2 score 0/1/2/3 |
52/37/11/0 |
13/11/1/2 |
0.66 |
| Mean CHADS2 score |
0.59±0.68 |
0.70±0.86 |
0.78 |
| Echocardiography |
| LA diameter, mm |
38.4±5.8 |
37.8±6.2 |
0.76 |
| LVEF, % |
64.5±8.1 |
64.7±7.1 |
0.96 |
| E/E’ ratio |
7.5±2.8 |
8.8±2.5 |
0.82 |
| SEC 0/1+/2+/3+/4+ |
44/44/11/1/0 |
16/11/0/0/0 |
0.23 |
| Computed tomography |
| LA volume index, ml/m2 |
57±15 |
61±10 |
0.52 |
| LA emptying fraction, % |
44±8.2 |
43±7.8 |
0.79 |
| Medications |
| ACEI and/or ARBs, n (%) |
30 |
4 (14.8) |
0.10 |
| β-blockers, n (%) |
31 |
12 (44.4) |
0.51 |
| Warfarin, n (%) |
100# |
27 (100)§ |
– |
| Baseline blood examination |
| Positive SC-D-dimer (%) |
10# |
0§ |
0.09 |
| Positive LA-D-dimer (%) |
23# |
1 (3.7)§ |
0.03 |
| Pre PT-INR* |
1.99±0.44 |
1.95±0.35 |
0.69 |
| Pre PT-INR ≥2.0,* n (%) |
28 (39.4) |
10 (45.5) |
0.62 |
| PT-INR |
1.70±0.50# |
1.91±0.31§ |
0.03 |
| PT-INR ≥2.0, n (%) |
22# |
12 (44.4)§ |
0.02 |
| HbA1c, % |
5.5±0.5 |
5.4±0.5 |
0.55 |
| BNP, pg/ml (IQR) |
33.2 (15.4–53.4) |
40.6 (13.5–47.8) |
0.20 |
| hs-CRP, mg/dl (IQR) |
0.05 (0.03–0.09) |
0.04 (0.03–0.10) |
0.86 |
Data are presented as mean±SD. *Pre PT-INR measured 1 week before catheter ablation in patients on discontinuous (n=71) or continuous (n=22) warfarin therapy; #warfarin ceased 1 day before blood sampling from left atrium; §warfarin not ceased on the day of blood sampling from left atrium. Abbreviations as in Table 1.
No patient was lost during a mean follow-up period of 35.3±9.6 months (range, 15–53) after ablation. No potential complications, including strokes or thromboembolic events, occurred in any of the patients during the procedure or the follow-up period.
Discussion
The results from this study indicated the following: (1) latent high coagulation activity in the LA was observed in patients with PAF even while in SR; (2) prevalence of positive LA-D-dimer was greater than that of SC-D-dimer: in most patients, LA-D-dimer levels were higher than or equal to the SC-D-dimer levels; (3) LA volume index was positively correlated with LA-D-dimer level and independently associated with positive LA-D-dimer; and (4) prevalence of positive LA-D-dimer was significantly lower in patients on continuous than on discontinuous warfarin.
Several transesophageal echocardiographic studies have demonstrated that LA spontaneous echo contrast developed or increased in approximately 30–35% of patients immediately after electrical cardioversion.17,18
Even brief periods of AF in normal canine hearts result in marked depression of global LA systolic function upon resumption of SR.19
Another clinical study demonstrated that LA thrombus occurs during short periods of AF.2
In addition, LAA stunning has been confirmed even after spontaneous conversion of AF to SR.20
Importantly, our results revealed that LA-D-dimer positivity was observed in 23% of AF patients, even those who were in SR for at least 2 days. An earlier study that included a small number of patients also reported that plasma levels of the thrombin-antithrombin III complex, a marker of thrombin generation, were high in the LA of patients with PAF, even during SR.21
Earlier reports have shown an association between peripheral vein D-dimer and poor outcomes in several clinical settings. In a study by Vene and colleagues, high levels of peripheral vein D-dimer indicated an unfavorable prognosis in AF patients, even during oral anticoagulant therapy.22
Elevated D-dimer (≥0.5 mg/ml) levels in peripheral veins have been associated with both thromboembolic (hazard ratio 15.8, P<0.01) and cardiovascular events (hazard ratio 7.64, P<0.01) in patients with AF during warfarin therapy.8
Anticoagulation control quality affects the peripheral vein D-dimer levels. Well-controlled warfarin and a longer time in the therapeutic PT-INR contributes to low peripheral vein D-dimer levels.7
Among the 100 patients in the first phase of the present study (Figure 1A), 22 patients had a PT-INR ≥2.0 and most of them (86%, 19/22) had negative LA-D-dimer (Table 1, Figure 3B). In addition, among the 27 patients in the second phase of the study (Figure 1B), only 1 patient, who had inadequate warfarin control (PT-INR 1.53), showed positive LA-D-dimer (0.51 µg/ml). Thus, the quality of anticoagulation control may influence the LA-D-dimer level in patients with AF. Di Biase et al23
investigated 1,584 patients undergoing AF catheter ablation, of whom 794 underwent AF catheter ablation while on continuous warfarin. Although periprocedural stroke/TIA occurred in approximately 1% of PAF patients on discontinuous warfarin (warfarin discontinued 2–3 days before the ablation), no stroke/TIA occurred in those on continuous warfarin. Importantly, complications, including major bleeding and pericardial effusion, were equally distributed.24
Our study is in concordance with the analysis from prior studies that continuation of warfarin during AF catheter ablation may reduce LA-D-dimer levels and thus reduce the risk of periprocedural thromboembolism.
Although the CHADS2
scoring method is simple and widely available, this score may not accurately reflect the state of LA hypercoagulability. In a large cohort by Di Biase et al, including patients with stroke/TIA after catheter ablation of AF, 61% of patients had a CHADS2
score ≤1.24
Although the majority of the patients in the present study had low CHADS2
scores, one-quarter were positive for LA-D-dimer. The LA volume index was positively correlated with LA-D-dimer level. In addition, multivariate analysis showed that LA volume index was independently associated with LA-D-dimer positivity. An earlier report demonstrated a close relationship between LA enlargement and thrombus.25
A long history of AF is associated with large LA dimension and LA dysfunction. Manning and colleagues reported that recovery of LA mechanical function is related to the duration of AF before cardioversion.26
Unfortunately, we could not accurately confirm the duration of AF or the frequency of PAF; however, patients with a larger LA volume index may have a longer AF history and experience frequent PAF. Our results suggest that anticoagulation therapy should be considered for patients with a large LA volume index (>66.5 ml/m2), even those with a low CHADS2
score.
LA dimensions were almost identical in the patients who were positive or negative for LA-D-dimer; however, the LA volume was significantly different. Previous reports on AF have investigated the correlation between LA dimension, measured by echocardiography, and LA volume, measured by CT,27,28
and both studies showed a weak correlation. Hof et al reported that among 40 patients with preserved LA dimension, LA volume varied between 67 and 260 ml.27
This reflects the fact that the LA has an asymmetrical shape and enlargement does not occur in a uniform fashion.29
Three-dimensional echocardiography may become a novel tool for non-invasive and reproducible assessment of LA size.30
Study Limitations
Firstly, although assessment of LA coagulation status is important when considering the mechanism of coagulation activity in PAF, current knowledge on the clinical benefit of measuring LA-D-dimer levels is limited. As this study did not include patients at high risk of thromboembolism, most had low CHADS2
scores. Neither thromboembolic complications nor cardiovascular events were observed during follow-up. Further studies that include patients with thromboembolic complications are necessary to better delineate the clinical value of LA-D-dimer. Secondly, D-dimer levels were measured on only 1 occasion during SR. Measurements of D-dimer in patients with persistent and permanent AF may provide additional information about LA hypercoagulation activity. Thirdly, blood samples were not obtained from peripheral veins; however, a previous study clearly demonstrated no difference in coagulation activity between peripheral veins and the SC.31
Fourthly, some selection biases may be present between the discontinuous and continuous warfarin groups. A randomized trial is necessary to increase the accuracy of the present results. Fifthly, we concluded that adequate warfarin control may reduce positive LA-D-dimer prevalence. However, time in the therapeutic range is needed to assess the appropriateness of warfarin control.32
Finally, transseptal puncture may in itself raise LA-D-dimer levels. We did not have LA-D-dimer levels in patients without AF. However, in an earlier report, 15 patients who underwent ablation of a left-sided accessory pathway showed no significant differences in the levels of coagulation activity of the LA associated with transseptal puncture.10
Conclusions
Patients who were positive for LA-D-dimer had a large LA volume index and reduced LA emptying fraction. LA volume index was associated with high LA coagulation status in patients with PAF, even in those with low CHADS2
score and SR periods. Adequate warfarin treatment during AF catheter ablation may reduce the prevalence of positive LA-D-dimer.
Acknowledgments
This work was supported, in part, by a grant-in-aid for Scientific Research (No. 25461039) from the Ministry of Education Culture, Sport, Science and Technology, Japan.
Disclosures
Conflict of Interest: None.
References
- 1.
Numa S, Hirai T, Nakagawa K, Ohara K, Fukuda N, Nozawa T, et al. Hyperuricemia and transesophageal echocardiographic thromboembolic risk in patients with atrial fibrillation at clinically low-intermediate risk. Circ J 2014; 78: 1600–1605.
- 2.
Stoddard MF, Dawkins PR, Prince CR, Ammash NM. Left atrial appendage thrombus is not uncommon in patients with acute atrial fibrillation and a recent embolic event: A transesophageal echocardiographic study. J Am Coll Cardiol 1995; 25: 452–459.
- 3.
Sherman DG, Kim SG, Boop BS, Corley SD, Dimarco JP, Hart RG, et al. Occurrence and characteristics of stroke events in the Atrial Fibrillation Follow-up Investigation of Sinus Rhythm Management (AFFIRM) study. Arch Intern Med 2005; 165: 1185–1191.
- 4.
Danesh J, Whincup P, Walker M, Lennon L, Thomson A, Appleby P, et al. Fibrin D-dimer and coronary heart disease: Prospective study and meta-analysis. Circulation 2001; 103: 2323–2327.
- 5.
Wen D, Du X, Dong JZ, Zhou XL, Ma CS. Value of D-dimer and C-reactive protein in predicting inhospital death in acute aortic dissection. Heart 2013; 99: 1192–1197.
- 6.
Alehagen U, Dahlstrom U, Lindahl TL. Elevated D-dimer level is an independent risk factor for cardiovascular death in out-patients with symptoms compatible with heart failure. Thromb Haemost 2004; 92: 1250–1258.
- 7.
Nakatani Y, Mizumaki K, Nishida K, Hirai T, Sakabe M, Oda Y, et al. Anticoagulation control quality affects the D-dimer levels of atrial fibrillation patients. Circ J 2012; 76: 317–321.
- 8.
Sadanaga T, Sadanaga M, Ogawa S. Evidence that D-dimer levels predict subsequent thromboembolic and cardiovascular events in patients with atrial fibrillation during oral anticoagulant therapy. J Am Coll Cardiol 2010; 55: 2225–2231.
- 9.
JCS Joint Working Group. Guidelines for pharmacotherapy of atrial fibrillation (JCS 2008): Digest version. Circ J 2010; 74: 2479–2500.
- 10.
Lim HS, Willoughby SR, Schultz C, Gan C, Alasady M, Lau DH, et al. Effect of atrial fibrillation on atrial thrombogenesis in humans: Impact of rate and rhythm. J Am Coll Cardiol 2013; 61: 852–860.
- 11.
Iwayama T, Nitobe J, Watanabe T, Ishino M, Tamura H, Nishiyama S, et al. The role of epicardial adipose tissue in coronary artery disease in non-obese patients. J Cardiol 2013; 63: 344–349.
- 12.
Masuda M, Iwakura K, Inoue K, Okamura A, Koyama Y, Kimura R, et al. Estimation of left atrial pump function by mitral annular velocity. Circ J 2012; 76: 1430–1435.
- 13.
Tamura H, Watanabe T, Nishiyama S, Sasaki S, Wanezaki M, Arimoto T, et al. Elevated plasma brain natriuretic peptide levels predict left atrial appendage dysfunction in patients with acute ischemic stroke. J Cardiol 2012; 60: 126–132.
- 14.
Tamura H, Watanabe T, Nishiyama S, Sasaki S, Arimoto T, Takahashi H, et al. Increased left atrial volume index predicts a poor prognosis in patients with heart failure. J Card Fail 2011; 17: 210–216.
- 15.
Fatkin D, Kelly RP, Feneley MP. Relations between left atrial appendage blood flow velocity, spontaneous echocardiographic contrast and thromboembolic risk in vivo. J Am Coll Cardiol 1994; 23: 961–969.
- 16.
Arimoto T, Tada H, Igarashi M, Sekiguchi Y, Sato A, Koyama T, et al. High washout rate of iodine-123-metaiodobenzylguanidine imaging predicts the outcome of catheter ablation of atrial fibrillation. J Cardiovasc Electrophysiol 2011; 22: 1297–1304.
- 17.
Grimm RA, Stewart WJ, Maloney JD, Cohen GI, Pearce GL, Salcedo EE, et al. Impact of electrical cardioversion for atrial fibrillation on left atrial appendage function and spontaneous echo contrast: Characterization by simultaneous transesophageal echocardiography. J Am Coll Cardiol 1993; 22: 1359–1366.
- 18.
Fatkin D, Kuchar DL, Thorburn CW, Feneley MP. Transesophageal echocardiography before and during direct current cardioversion of atrial fibrillation: Evidence for “atrial stunning” as a mechanism of thromboembolic complications. J Am Coll Cardiol 1994; 23: 307–316.
- 19.
Louie EK, Liu D, Reynertson SI, Loeb HS, McKiernan TL, Scanlon PJ, et al. “Stunning” of the left atrium after spontaneous conversion of atrial fibrillation to sinus rhythm: Demonstration by transesophageal Doppler techniques in a canine model. J Am Coll Cardiol 1998; 32: 2081–2086.
- 20.
Grimm RA, Leung DY, Black IW, Stewart WJ, Thomas JD, Klein AL. Left atrial appendage “stunning” after spontaneous conversion of atrial fibrillation demonstrated by transesophageal Doppler echocardiography. Am Heart J 1995; 130: 174–176.
- 21.
Motoki H, Tomita T, Aizawa K, Kasai H, Izawa A, Kumazaki S, et al. Coagulation activity is increased in the left atria of patients with paroxysmal atrial fibrillation during the non-paroxysmal period: Comparison with chronic atrial fibrillation. Circ J 2009; 73: 1403–1407.
- 22.
Vene N, Mavri A, Košmelj K, Stegnar M. High D-dimer levels predict cardiovascular events in patients with chronic atrial fibrillation during oral anticoagulant therapy. Thromb Haemost 2003; 90: 1163–1172.
- 23.
Di Biase L, Burkhardt D, Santangeli P, Mohanty P, Sanchez J, Horton R, et al. Periprocedural stroke and bleeding complications in patients undergoing catheter ablation of atrial fibrillation with different anticoagulation management: Results from the Role of Coumadin in Preventing Thromboembolism in Atrial Fibrillation (AF) Patients Undergoing Catheter Ablation (COMPARE) randomized trial. Circulation 2014; 129: 2638–2644.
- 24.
Di Biase L, Burkhardt JD, Mohanty P, Sanchez J, Horton R, Gallinghouse GJ, et al. Periprocedural stroke and management of major bleeding complications in patients undergoing catheter ablation of atrial fibrillation: The impact of periprocedural therapeutic international normalized ratio. Circulation 2010; 121: 2550–2556.
- 25.
Calvo N, Mont L, Vidal B, Nadal M, Montserrat S, Andreu D, et al. Usefulness of transoesophageal echocardiography before circumferential pulmonary vein ablation in patients with atrial fibrillation: Is it really mandatory? Europace 2011; 13: 486–491.
- 26.
Manning WJ, Silverman DI, Katz SE, Riley MF, Come PC, Doherty RM, et al. Impaired left atrial mechanical function after cardioversion: Relation to the duration of atrial fibrillation. J Am Coll Cardiol 1994; 23: 1535–1540.
- 27.
Hof I, Arbab-Zadeh A, Scherr D, Chilukuri K, Dalal D, Abraham T, et al. Correlation of left atrial diameter by echocardiography and left atrial volume by computed tomography. J Cardiovasc Electrophysiol 2009; 20: 159–163.
- 28.
Parikh SS, Jons C, McNitt S, Daubert JP, Schwarz KQ, Hall B. Predictive capability of left atrial size measured by CT, TEE, and TTE for recurrence of atrial fibrillation following radiofrequency catheter ablation. Pacing Clin Electrophysiol 2010; 33: 532–540.
- 29.
Lester SJ, Ryan EW, Schiller NB, Foster E. Best method in clinical practice and in research studies to determine left atrial size. Am J Cardiol 1999; 84: 829–832.
- 30.
Perez de Isla L, Feltes G, Moreno J, Martinez W, Saltijeral A, de Agustin JA, et al. Quantification of left atrial volumes using three-dimensional wall motion tracking echocardiographic technology: Comparison with cardiac magnetic resonance. Eur Heart J Cardiovasc Imaging 2014; 15: 793–799.
- 31.
Yamamoto K, Ikeda U, Seino Y, Mito H, Fujikawa H, Sekiguchi H, et al. Coagulation activity is increased in the left atrium of patients with mitral stenosis. J Am Coll Cardiol 1995; 25: 107–112.
- 32.
Okuyama Y, Matsuo M, Matsuo H, Sakaguchi Y, Takai H, Horiguchi Y, et al. Introduction of point-of-care testing in Japanese outpatient clinics is associated with improvement in time in therapeutic range in anticoagulant-treated patients. Circ J 2014; 78: 1342–1348.
