Abstract
Background:
Different mechanisms of acute kidney injury (AKI) may exist for acute heart failure (AHF) patients compared with other patients.
Methods and Results:
We analyzed data from 282 patients with AHF. The biomarkers were measured within 30 min of admission. Patients were assigned to a no-AKI (n=213) or AKI group (Class R (n=49), Class I (n=15) or Class F (n=5)) using the RIFLE classifications on admission. We evaluated the relationships between the biomarkers and AKI, in-hospital mortality, all-cause death and HF events (HF re-admission, all-cause death) within 90 days. The serum heart-type fatty acid-binding protein (s-HFABP) levels were significantly higher in the AKI than in the no-AKI group, and the predictive biomarker for AKI was s-HFABP (odds ratio: 6.709; 95% confidence interval: 3.362–13.391). s-HFABP demonstrated an optimal balance between sensitivity and specificity (71.0%, 79.3%; area under the receiver-operating characteristic curve [AUC]=0.790) at 22.8 ng/ml for AKI, at 22.8 ng/ml for Class I/F (90.0%, 71.4%; AUC=0.836) and at 21.0 ng/ml for in-hospital mortality (74.3%, 70.0%; AUC=0.726). The Kaplan-Meier survival curves showed a significantly poorer prognosis in the high s-HFABP group (≥22.9 ng/ml) than in other groups.
Conclusions:
The s-HFABP level can indicate AKI on admission, and a high s-HFABP level is associated with a poorer prognosis for AHF patients. (Circ J 2015; 79: 119–128)
The Risk, Injury, Failure, Loss and Endstage (RIFLE) criteria have been established as a standard method of evaluating acute kidney injury (AKI) in intensive care patients,1,2
and it is also important to evaluate the presence of AKI on admission of cardiovascular patients.3
We previously investigated the relationships among in-hospital mortality, long-term prognosis and AKI as evaluated by the RIFLE criteria in patients with acute heart failure (AHF), and concluded that patients with AKI, especially those in classes I and F, had worse in-hospital mortality and a worse long-term prognosis in comparison with no-AKI patients.4,5
Furthermore, we reported that 33.2% of the AHF patients already had AKI when they were admitted to the intensive care unit (ICU),4
and that the presence of AKI on admission was associated with a worse prognosis.6
The mechanisms and the pathophysiology of AKI in AHF patients are multifactorial, and still incompletely understood. The levels of neutrophil gelatinase-associated lipocalin (NGAL) and liver fatty acid-binding protein (LFABP), which reflect the presence of renal tubular injury, have been investigated to detect AKI in patients with AHF.7–10
In addition, the plasma and urinary NGAL levels after 12–24 h of treatment or before discharge have been reported to predict AKI and adverse outcomes.7,9,10
Meanwhile, the availability of NGAL samples on admission has only been rarely reported. Moreover, the possibility of a lack of significant renal tubular injury despite AKI in AHF patients was demonstrated in a recent report.11
This finding suggested that different mechanisms might underlie AKI in AHF patients compared with those with other diseases. The effect of AKI on AHF depends more on the organ dysfunction-associated disease severity than the presence of “true” (ie, renal tubular injury) AKI. Therefore, a biomarker that reflects heart and general conditions is required for assessing AKI in AHF patients.
In the present study, we hypothesized that the level of the cardiac biomarker, heart-type fatty acid-binding protein (HFABP), can detect the presence of AKI, especially classes I and F, on admission of patients with AHF.
Methods
Subjects
The study group comprised 282 patients with AHF who were admitted to the ICU of Chiba Hokusoh Hospital, Nippon Medical School, between March 2010 and February 2014. AHF was defined as either new-onset HF or decompensation of chronic HF with symptoms sufficient to warrant hospitalization.12
Based on the ESC guidelines for the diagnosis of AHF, an abnormal ECG or the presence of pulmonary edema on a chest X-ray and a B-type natriuretic peptide (BNP) level ≥100 pg/ml or an N-terminal pro-BNP (NT-proBNP) level ≥300 pg/ml are required to diagnose AHF.13
Furthermore, all included patients were administered diuretics or vasodilators for the treatment of AHF. The treating physician in the emergency department diagnosed AHF based on the criteria within 30 min of the patient’s admission and included the patient in the present study by filling out a form. All patients had a New York Heart Association (NYHA) functional class of either III or IV. Patients who had undergone renal replacement therapy before admission were excluded. There was no limitation on treatment of AHF, and the treatment strategy was chosen by each of the physicians.
Urinary Biomarker Excretion and Serum Biomarker Measurements
Urine and blood samples were collected within 30 min of admission (Day 1), in the hospital after 72 h (Day 4) and between days 7 and 21 (Before Discharge). The urine and blood samples were centrifuged within 5 min at 4℃, and immediately frozen at −80℃ until they were analyzed. The serum levels of blood urea nitrogen (BUN), creatinine, β2-microglobulin, α1-microglobulin, osmolality and HFABP, high-sensitivity troponin T (hs-TropT), BNP, NT-proBNP, and procollagen III peptide (PIIIP) were measured at each sampling point. In addition, the urinary BUN, creatinine, osmolality, NGAL, LFABP, β2-microglobulin, acetyl-β-D glucosaminidase (NAG), and albumin excretion were also measured at each sampling point. These urine and serum biomarkers were measured by the Special Reference Laboratory (SRL©, Tokyo, Japan). The urinary level of LFABP was measured with an enzyme-linked immunosorbent assay (ELISA) using a human LFABP ELISA kit (Kyowa Medex Co, Tokyo, Japan) and that of NGAL was measured using the NGAL ELISA Kit (R&D Systems, Inc, Minneapolis, USA). The serum HFABP level was measured using a MARKIT-M HFABP ELISA kit till June 2012 and then a LIBLIA H-FABP latex agglutination turbidimetric immunoassay from July 2012 (DS Pharma Biomedical, Osaka, Japan). The lower and upper limits of detection for the urinary NGAL level were 4 pg/ml and 500 pg/ml, respectively, and the lower limit for the urinary LFABP was 2.9 pg/ml. Urine and serum samples were obtained from all 282 patients on Day 1, 270 patients on Day 4 (4 patients died, 8 samples not collected) and 238 patients Before Discharge (15 patients died within 14 days of admission, 7 patients were discharged within 7 days of admission and data for 22 patients were not collected).
Evaluation of AKI
Because we evaluated AKI on admission, urine output could not be precisely measured in the general ward, and the majority of patients with AHF received treatment with diuretics, which influences urine output, AKI was investigated solely on the basis of the creatinine criteria of the RIFLE classification.2
The RIFLE classification is based on the ratio of the serum creatinine value recorded on admission to the baseline creatinine value. Patients were classified as having no-AKI or Class R (risk), Class I (injury) or Class F (failure) AKI.
The baseline level of creatinine was defined as follows. Patients who had creatinine data from the outpatients clinic between 1 and 12 months was defined as having the most recent value obtained before admission. Patients who had creatinine data from the outpatients clinic within 1 month was defined as having the lowest value recorded between 1 and 12 month before admission. For patients in whom the creatinine value was not measured within the year before admission, the baseline creatinine value was defined as follows. In chronic kidney disease (CKD) patients, the baseline level of creatinine was defined as the lowest value recorded during admission. In patients without CKD, the lower of either the lowest creatinine value during hospitalization or the Modification of Diet in Renal Disease (MDRD) creatinine level was used as the baseline creatinine value. The MDRD creatinine levels were calculated using the MDRD equation as recommended by the Acute Dialysis Quality Initiative. The MDRD equation for serum creatinine was calculated assuming a glomerular filtration rate (GFR) of 75 ml·min–1·1.73 m–2.14,15
CKD diagnosis was based on the creatinine value observed within 1 year. Furthermore, among patients in whom the creatinine value was not measured within 1 year of admission, those who had been previously diagnosed with CKD or at other institute were considered to have CKD. CKD was defined as a syndrome comprising low GFR (<60 ml·min–1·1.73 m–2) of more than 3 months.16
Patients who did not have medical records at Chiba Hokusoh Hospital for the 3 months prior to admission were diagnosed with CKD using another institution’s data for that same time period. Kidney damage, as identified by abnormal findings in the urine and imaging tests,16
was used to diagnose CKD in some of the patients in the present study; that is, CKD was diagnosed only by a low GFR with a longer than 3-month history. In the present study, 164 of 282 patients (58.2%) were diagnosed with CKD, including 107 patients (65.2%) in whom the creatinine value was measured within 1 year and 57 patients (34.8%) with a past medical history of CKD.
In summary, AKI was diagnosed from the ratio of the serum creatinine value recorded on admission to the baseline creatinine value. No-AKI was defined as an increase in serum creatinine <1.5×baseline, Class R as an increase in serum creatinine ≥1.5×baseline, Class I as an increase in serum creatinine ≥2.0×baseline and Class F as an increase in serum creatinine ≥×3.0 baseline.
Procedures
AKI was evaluated by the RIFLE classification on admission: 213 patients were allocated to the no-AKI group, and 69 patients to the AKI group, subdivided as Class R (n=49), Class I (n=15) and Class F (n=5). The urine and serum biomarker levels were compared between the no-AKI and AKI groups, and between the Class I/F patients and other patients. Receiver-operating characteristic (ROC) curves for the urine and serum biomarkers were calculated to predict the optimal cutoff values, and the sensitivity, specificity and area under the ROC curve (AUC) were determined to indicate the optimal values to predict AKI in the overall group and the Class I/F patients specifically.
The factors that were significantly different between the no-AKI and AKI groups, and the Class I/F and other patients by univariate analysis were selected for inclusion in a multivariate logistic regression model.
Urine and Serum Biomarker Levels and Patients’ Prognosis
The cutoff values for the urine and serum biomarkers to detect in-hospital mortality were determined by ROC curves. Furthermore, the mid-term prognosis was also evaluated, and included all-cause death and HF events, including all-cause death and re-admission for HF within 90 days. The patients were clinically followed up at a routine outpatient clinic. Patients who were followed up at other institutes had their prognoses determined by telephone contact. Patients were assigned to 4 groups based on the H-FABP level and the presence of AKI. The prognostic value for 90-day mortality was evaluated using the Cox regression hazard model and Kaplan-Meier curves.
Statistical Analysis
All data were statistically analyzed using the SPSS 20.0 J software program (SPSS Japan Institute, Tokyo, Japan). All numerical data were expressed as the mean±standard deviation or median (25–75% interquartile range). Unpaired Student’s t-tests or the Mann-Whitney U-test were used to compare 2 groups, and a Kruskal-Wallis test was used to compare 3 groups. Normality was assessed using the Shapriro-Wilk W test. Comparisons of all proportions were performed with a chi-square analysis. The significant biomarkers indicating AKI and Class I/F status on admission were determined by the multivariate logistic regression model. ROC curves were calculated to predict the cutoff values, and the sensitivity, specificity and AUC were determined.
A P-value <0.05 was considered to be statistically significant. The prognostic value of the serum HFABP level in the low HFABP and AKI group, high HFABP and no-AKI group and high HFABP and AKI group compared with that observed in the low HFABP and no-AKI group as the referent was assessed using a Cox regression hazard model. Cox regression analysis was performed to obtain the hazard ratio (HR) for 90-day mortality. Thereafter, a multivariate analysis was performed using the variables with P<0.05 in the univariate analysis to examine their independent associations with the 90-day mortality. The survival rates were analyzed between the groups, which were assigned based on the cutoff value of the ROC curves for HFABP, and as having or not having AKI using Kaplan-Meier curves, and significant differences were calculated using the log-rank test.
Ethical Concerns
The institutional review board at Chiba Hokusoh Hospital, Nippon Medical School approved the study protocol.
Results
Patients’ Characteristics and AKI on Admission
The patient cohort comprised 66.7% males, with a median age of 76 years, and 186 (66.0%) patients had new-onset HF: 120 (42.6%) of the patients had ischemic heart disease, and 162 (57.4%) had non-ischemic heart disease, including cardiomyopathy (n=37), hypertensive heart disease (n=44), valvular disease (n=60) and other heart diseases (n=21). The etiology of HF was similar in the no-AKI and AKI groups, and in the Class I/F and other patients. Most patients were in NYHA class IV (77.0%). The median left ventricular ejection fraction (LVEF) on admission was 39.0%, and 143 patients (50.7%) had a reduced LV function (LVEF <40%). Systolic blood pressure (SBP) was significantly lower, lactate level significantly higher, serum levels of sodium significantly lower and serum levels of C-reactive protein (CRP) were significantly higher in the AKI group than in the no-AKI group. Furthermore, SBP values were significantly higher in the Class R and no-AKI patients than in the Class I/F patients (Table 1).
Table 1.
Study Patients’ Characteristics and the RIFLE Criteria for AKI
| Characteristic |
Total (n=282) |
No-AKI (n=213) |
AKI (n=69) |
P value* |
P value† |
| Class R (n=49) |
Class I/F (n=20) |
| Age (years) |
76 (67–82) |
76 (68–82) |
78 (70–83) |
71 (61–80) |
0.906 |
0.088 |
| Type (new onset, %) |
186 (66.0) |
138 (64.8) |
36 (73.5) |
12 (60.0) |
0.559 |
0.626 |
| Etiology (ischemia, %) |
120 (42.6) |
90 (42.3) |
22 (44.9) |
8 (40.0) |
0.889 |
1.000 |
| Sex (male, %) |
188 (66.7) |
150 (70.4) |
22 (44.9) |
16 (80.0) |
0.027 |
0.226 |
| Past medical history |
| Hypertension (yes, %) |
203 (72.0) |
154 (72.3) |
36 (73.5) |
13 (65.0) |
0.878 |
0.450 |
| Diabetes mellitus (yes, %) |
147 (52.1) |
113 (53.1) |
24 (49.0) |
10 (50.0) |
0.580 |
0.821 |
| Dyslipidemia (yes, %) |
135 (47.9) |
108 (50.7) |
19 (38.8) |
8 (40.0) |
0.096 |
0.493 |
| Vital signs and status |
| SBP (mmHg) |
159.5±41.1 |
165.0±36.7 |
153.9±47.4 |
114.5±40.5 |
<0.001 |
<0.001 |
| Pulse (beats/min) |
108.3±29.5 |
109.1±27.9 |
109.3±36.1 |
97.8±24.4 |
0.437 |
0.096 |
| LVEF (%) |
39 (28–50) |
38 (28–50) |
40 (28–56) |
42 (30–62) |
0.308 |
0.408 |
| NYHA (IV, %) |
217 (77.0) |
160 (75.1) |
40 (81.6) |
17 (85.0) |
0.250 |
0.582 |
| Arterial blood gas |
| pH |
7.34 (7.23–7.42) |
7.34 (7.23–7.43) |
7.33 (7.22–7.38) |
7.38 (7.25–7.43) |
0.215 |
0.504 |
| PCO2 (mmHg) |
40 (33–55) |
40 (34–56) |
37 (31–51) |
39 (31–53) |
0.180 |
0.470 |
| PO2 (mmHg) |
91 (66–134) |
92 (67–132) |
93 (64–156) |
81 (65–113) |
0.892 |
0.311 |
| HCO3− (mmol/L) |
21.9 (19.0–24.2) |
22.2 (20.2–24.4) |
18.1 (15.4–22.1) |
22.2 (19.5–24.7) |
<0.001 |
0.861 |
| SaO2 (%) |
96 (92–98) |
96 (92–98) |
96 (91–98) |
95 (93–98) |
0.653 |
0.824 |
| Lactate (mmol/L) |
1.8 (1.2–3.4) |
1.7 (1.2–3.0) |
2.8 (1.8–6.2) |
1.7 (1.4–2.5) |
0.003 |
0.988 |
| Laboratory data |
| Total bilirubin (mg/dl) |
0.6 (0.4–0.9) |
0.6 (0.4–0.9) |
0.6 (0.4–1.1) |
0.9 (0.3–1.3) |
0.247 |
0.393 |
| Uric acid (mg/dl) |
6.9 (5.5–8.3) |
6.6 (5.2–8.0) |
7.9 (6.4–10.7) |
7.8 (7.0–11.5) |
<0.001 |
0.007 |
| Sodium (mmol/L) |
140 (137–142) |
140 (138–142) |
138 (133–142) |
139 (133–142) |
0.006 |
0.130 |
| Potassium (mmol/L) |
4.3 (3.8–4.7) |
4.2 (3.8–4.7) |
4.5 (3.9–5.0) |
4.6 (4.3–5.8) |
0.002 |
0.008 |
| Hemoglobin (g/dl) |
12.3 (10.4–13.9) |
12.4 (10.7–13.9) |
11.6 (10.1–13.9) |
9.8 (8.8–12.4) |
0.015 |
0.002 |
| CRP (mg/dl) |
0.77 (0.18–3.70) |
0.66 (0.15–2.57) |
0.84 (0.32–4.15) |
3.23 (0.31–8.63) |
0.027 |
0.017 |
| BNP (pg/ml) |
735 (439–1,558) |
696 (406–1,256) |
1,200 (618–1,928) |
1,286 (767–2,489) |
<0.001 |
0.018 |
| Serum biomarkers |
| β2-microglobulin (mg/L) |
3.8 (2.7–6.1) |
3.5 (2.4–5.1) |
4.2 (3.3–7.0) |
8.8 (5.4–12.1) |
<0.001 |
<0.001 |
| α1-microgloburin (ng/L) |
22.2 (16.8–32.8) |
21.7 (16.2–31.3) |
22.0 (17.8–31.4) |
33.8 (22.6–42.8) |
0.095 |
0.035 |
| Osmolality (mOsm/L) |
297 (291–305) |
296 (290–303) |
300 (293–310) |
308 (293–319) |
0.002 |
0.036 |
| BUN (mg/dl) |
25.8 (18.3–40.0) |
23.1 (17.5–33.1) |
33.2 (22.6–56.7) |
58.3 (39.4–73.8) |
<0.001 |
<0.001 |
| Creatinine (mg/dl) |
1.17 (0.89–1.88) |
1.09 (0.85–1.69) |
1.31 (1.07–2.18) |
2.57 (2.09–3.79) |
<0.001 |
<0.001 |
| NT-proBNP (pg/ml) |
6,215 (2,537–13,647) |
5,404 (2,225–11,235) |
9,923 (4,615–34,536) |
13,436 (8,423–53,676) |
<0.001 |
<0.001 |
| hs-TropT (ng/ml) |
0.061 (0.033–0.137) |
0.056 (0.031–0.127) |
0.076 (0.042–0.140) |
0.093 (0.065–0.431) |
0.002 |
0.008 |
| PIIIP (U/ml) |
0.80 (0.70–1.10) |
0.80 (0.60–1.00) |
0.85 (1.70–1.13) |
1.30 (1.05–1.70) |
<0.001 |
<0.001 |
| HFABP (ng/ml) |
13.8 (8.3–27.7) |
11.2 (7.3–20.1) |
27.6 (15.5–48.2) |
45.0 (27.8–65.0) |
<0.001 |
<0.001 |
| Urinary biomarkers |
| NGAL (ng/mg·cre) |
86.1 (27.4–297.8) |
66.5 (19.8–230.8) |
122.3 (45.5–382.5) |
140.5 (83.4–544.7) |
<0.001 |
0.046 |
| LFABP (ng/mg·cre) |
58.4 (14.5–184.6) |
49.2 (12.3–163.8) |
88.0 (37.9–329.5) |
66.3 (14.9–160.0) |
0.078 |
0.846 |
| β2-microglobulin (μg/mg·cre) |
663 (158–7,096) |
724 (169–7,784) |
452 (137–7,261) |
406 (230–2,644) |
0.546 |
0.645 |
| NAG (U/mg·cre) |
16.0 (10.0–24.8) |
15.0 (9.5–22.4) |
21.2 (11.6–33.5) |
21.0 (11.7–35.3) |
0.005 |
0.310 |
| Albumin (mg/g·cre) |
491 (150–1,949) |
519 (155–1,984) |
397 (143–1,998) |
508 (180–1,376) |
0.688 |
0.663 |
| Osmolality (mOsm/L) |
433 (371–575) |
477 (391–610) |
384 (347–512) |
340 (319–373) |
<0.001 |
<0.001 |
| BUN (mg/dl) |
451 (286–676) |
471 (304–697) |
475 (249–609) |
343 (276–457) |
0.027 |
0.057 |
| Creatinine (mg/dl) |
75 (39–122) |
72 (39–121) |
75 (38–102) |
104 (61–181) |
0.679 |
0.085 |
| Medication (cases) during the first 5 days |
| Furosemide (yes, %) |
258 (91.5) |
195 (91.5) |
45 (91.8) |
18 (90.0) |
1.000 |
0.683 |
| Nitroglycerin (yes, %) |
137 (48.6) |
114 (53.5) |
17 (34.7) |
6 (30.0) |
0.004 |
0.105 |
| Nicorandil (yes, %) |
50 (17.7) |
40 (18.8) |
6 (12.2) |
4 (20.0) |
0.473 |
0.763 |
| Carperitide (yes, %) |
142 (50.4) |
101 (47.4) |
29 (59.2) |
12 (60.0) |
0.097 |
0.488 |
| Dopamine (yes, %) |
19 (6.7) |
8 (3.8) |
8 (16.3) |
3 (15.0) |
0.001 |
0.142 |
| Dobutamine (yes, %) |
40 (14.2) |
22 (10.3) |
12 (24.5) |
6 (30.0) |
0.002 |
0.047 |
| ACEI/ARB (yes, %) |
102 (36.2) |
86 (40.4) |
15 (30.6) |
1 (5.0) |
0.010 |
0.001 |
| β-blocker (yes, %) |
84 (29.8) |
72 (33.8) |
9 (18.4) |
3 (15.0) |
0.010 |
0.203 |
| Spironolactone (yes, %) |
98 (34.8) |
81 (38.0) |
14 (28.6) |
3 (15.0) |
0.043 |
0.085 |
| Outcome |
| ICU hospitalization (days) |
4.0 (3.0–5.0) |
3.0 (2.8–5.0) |
4.0 (3.0–8.0) |
10.5 (4.5–20.3) |
<0.001 |
<0.001 |
| Total hospitalization (days) |
26 (16–41) |
25 (16–36) |
33 (17–50) |
35 (23–58) |
0.018 |
0.052 |
| In-hospital mortality (yes, %) |
35 (12.4) |
14 (6.6) |
13 (26.5) |
8 (40.0) |
<0.001 |
0.001 |
All numerical data expressed as median (25–75% interquartile range).
*P value between the no-AKI and AKI patients determined by unpaired Student’s t-test, Mann-Whitney U-test or χ2 test. †P value between the Class I/F patients and other patients determined by unpaired Student’s t-test, Mann-Whitney U-test or χ2 test.
ACEI, angiotensin-converting enzyme inhibitor; AKI, acute kidney injury; ARB, angiotensin II receptor blocker; BNP, brain natriuretic peptide; BUN, blood urea nitrogen; CRP, C-reactive protein; HFABP, heart-fatty acid-binding protein; hs-TropT, high-sensitivity troponin T; ICU, intensive care unit; LFABP, liver fatty acid-binding protein; LVEF, left ventricular ejection fraction measured by echocardiography; NAG, N acetyl-β-D glucosaminidase; NGAL, neutrophil gelatinase-associated lipocalin; NT-proBNP, N-terminal pro-brain-type natriuretic peptide; NYHA, New York Heart Association; PIIIP, procollagen III peptide; RIFLE, Risk, Injury, Failure, Loss and Endstage; SBP, systolic blood pressure.
The serum levels of β2-microglobulin, BUN and creatinine were significantly higher in the AKI group than in the no-AKI group. The serum levels of NT-proBNP, hs-tropT and HFABP were also significantly higher in the AKI group than in the no-AKI group (HFABP; 34.4 [19.0–53.7] ng/ml vs. 11.2 [7.3–20.1] ng/ml). The urinary excretion of NGAL, LFABP and NAG was significantly higher in the AKI group (134.8 [46.0–442.5] ng/mg·cre, 75.5 [22.3–269.0] ng/mg·cre and 21.2 [11.6–34.4] U/mg·cre, respectively) than in the no-AKI group (66.5 [19.8–230.8] ng/mg·cre, 49.2 [12.3–163.8] ng/mg·cre and 15.0 [9.5–22.4] U/mg·cre, respectively).
The serum levels of NT-proBNP, hs-tropT and HFABP, and the urinary excretion of NGAL were also significantly higher in the Class I/F patients than in the other patients (Table 1).
The ROC curves are shown in
Figure 1. The value of serum HFABP that produced the optimal balance of sensitivity and specificity to indicate the presence of AKI (71.0% and 79.3%; AUC=0.790, P<0.001) was 22.8 ng/ml for the overall patients was 19.8 U/L for the urinary NAG (56.3% and 68.2%; AUC=0.618, P=0.005), was 19.0 ng/mg·cre for urinary NGAL (98.6% and 24.4%; AUC=0.637, P=0.002) and was 36.6 ng/mg·cre for urinary LFABP (71.0% and 43.7%; AUC 0.570, P=0.048) (Figure 1A). The serum level of HFABP that produced the optimal balance of sensitivity and specificity (90.0% and 71.4%; AUC=0.836, P<0.001) for identifying Class I/F patients was 22.8 ng/ml (Figure 1B). The results of the multivariate logistic regression model for indicating the presence of AKI found that the specific biomarker was the serum HFABP (odds ratio [OR]: 6.709; 95% confidence interval [CI]: 3.362–13.391, P<0.001), and the marker indicating Class I/F status was also serum HFABP (OR: 6.432; 95% CI: 1.646–25.136, P=0.007) (Table 2).
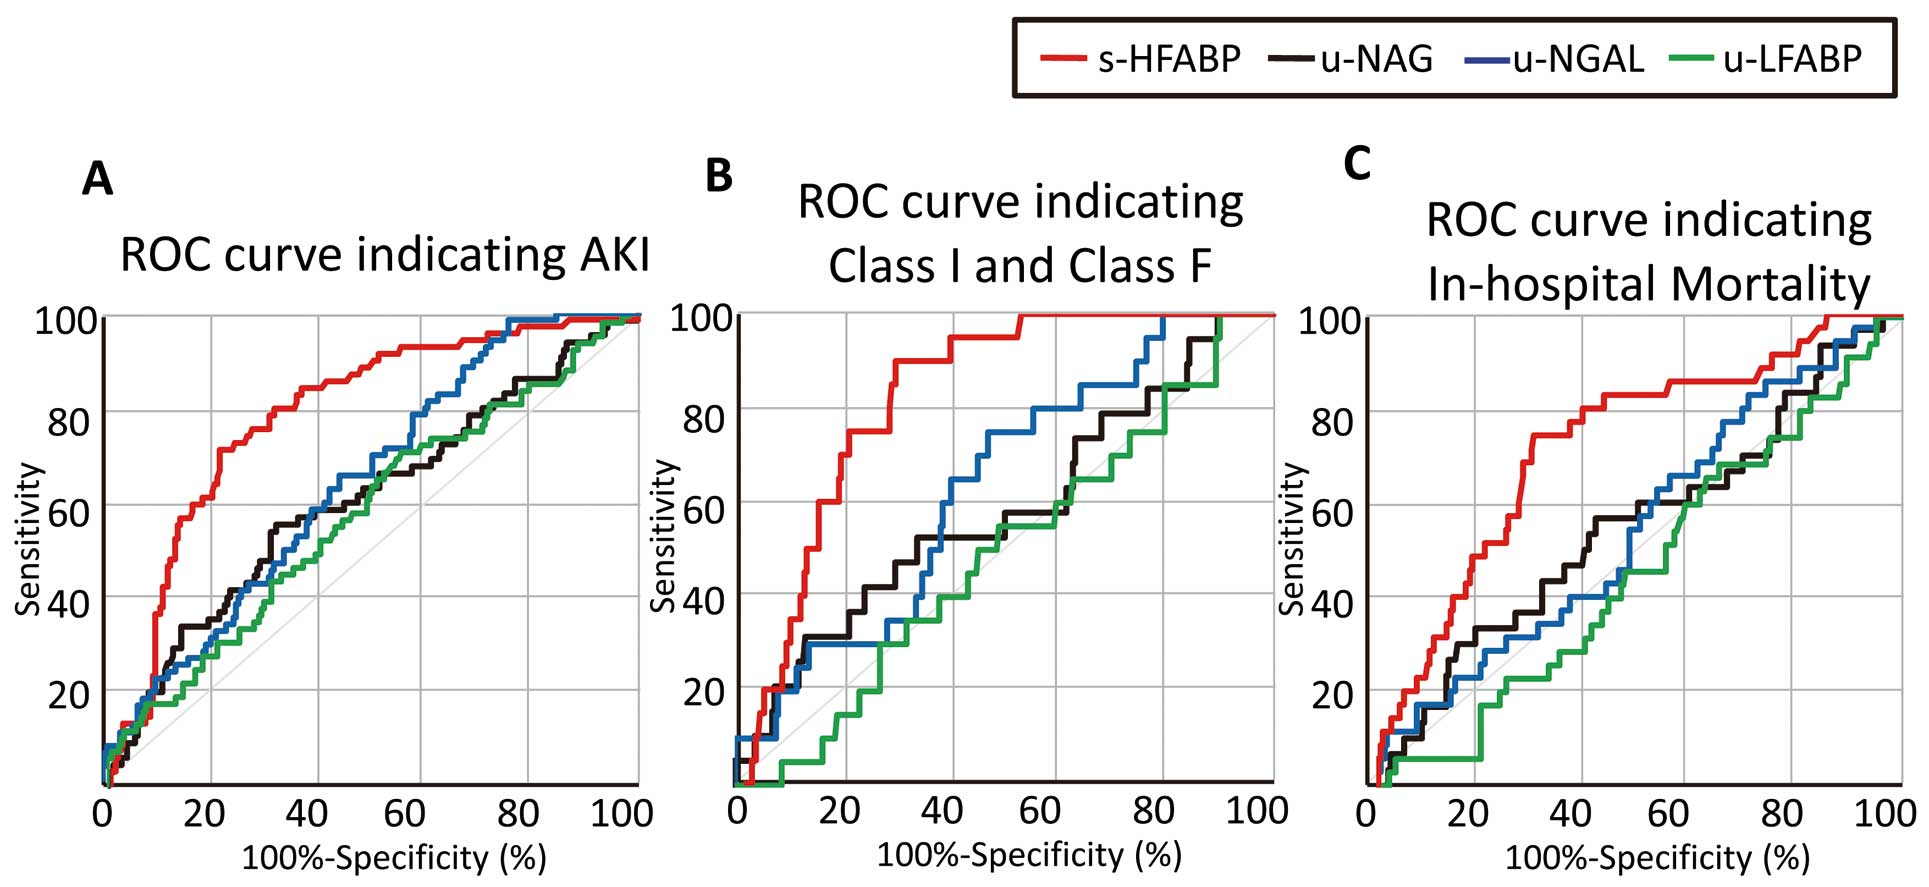
Table 2.
Results of the Univariate and Multivariate Logistic Regression Analyses for the Detection of AKI in Patients With Acute Heart Failure
| |
Univariate analysis |
Multivariate analysis |
| OR |
95% CI |
P value |
OR |
95% CI |
P value |
| Detection of AKI |
| Urinary biomarkers |
| HFABP (≥22.9 ng/ml) |
9.178 |
4.844–17.388 |
<0.001 |
6.709 |
3.362–13.391 |
<0.001 |
| NGAL (≥19.1 ng/mg·cre) |
9.570 |
2.253–40.652 |
0.002 |
5.902 |
1.258–27.687 |
0.024 |
| NAG (≥19.9 U/mg·cre) |
2.589 |
1.454–4.611 |
0.001 |
1.663 |
0.817–3.339 |
0.161 |
| LFABP (≥36.7 ng/mg·cre) |
2.136 |
1.156–3.982 |
0.017 |
1.677 |
0.746–3.769 |
0.211 |
| Adjusting factors |
| Age (per 1 year increase) |
0.989 |
0.967–1.011 |
0.330 |
|
|
|
| SBP (per 10 mmHg increase) |
0.878 |
0.816–0.946 |
0.001 |
0.896 |
0.822–0.977 |
0.012 |
| LVEF (per 1% increase) |
1.009 |
0.994–1.025 |
0.240 |
|
|
|
| Sodium (per 1.0 mmol/L increase) |
0.956 |
0.912–1.001 |
0.057 |
|
|
|
| Hemoglobin (per 1.0 g/dl increase) |
0.912 |
0.831–1.002 |
0.055 |
|
|
|
| Creatinine (per 0.1 mg/dl increase) |
1.001 |
0.998–1.005 |
0.484 |
|
|
|
| hs-TropT (per 0.01 ng/ml increase) |
1.003 |
0.999–1.007 |
0.107 |
|
|
|
| BNP (per 10 pg/ml increase) |
1.002 |
1.000–1.004 |
0.042 |
1.000 |
0.998–1.002 |
0.943 |
| Detection of Class I/F |
| Urinary biomarkers |
| HFABP (≥22.9 ng/ml) |
14.129 |
4.023–49.625 |
<0.001 |
6.432 |
1.646–25.136 |
0.007 |
| NGAL (≥91.1 ng/mg·cre) |
1.506 |
0.324–7.007 |
0.602 |
|
|
|
| NAG (≥34.4 U/mg·cre) |
2.240 |
0.757–6.631 |
0.145 |
|
|
|
| LFABP (≥59.9 ng/mg·cre) |
1.260 |
0.505–3.142 |
0.620 |
|
|
|
| Adjusting factors |
| Age (per 1 year increase) |
0.962 |
0.931–0.994 |
0.021 |
0.963 |
0.920–1.007 |
0.101 |
| SBP (per 10 mmHg increase) |
0.720 |
0.627–0.826 |
<0.001 |
0.815 |
0.705–0.941 |
0.005 |
| LVEF (per 1% increase) |
1.014 |
0.989–1.040 |
0.276 |
|
|
|
| Sodium (per 1.0 mmol/L increase) |
0.907 |
0.851–0.968 |
0.003 |
0.963 |
0.894–1.038 |
0.329 |
| Hemoglobin (per 1.0 g/dl increase) |
0.728 |
0.599–0.884 |
0.001 |
0.769 |
0.615–0.961 |
0.021 |
| Creatinine (per 0.1 mg/dl increase) |
1.002 |
0.998–1.006 |
0.428 |
|
|
|
| hs-TropT (per 0.01 ng/ml increase) |
1.006 |
1.001–1.011 |
0.019 |
1.002 |
0.998–1.006 |
0.389 |
| BNP (per 10 pg/ml increase) |
1.002 |
1.000–1.004 |
0.063 |
|
|
|
CI, confidence interval; HR, hazard ratio. Other abbreviations as in Table 1.
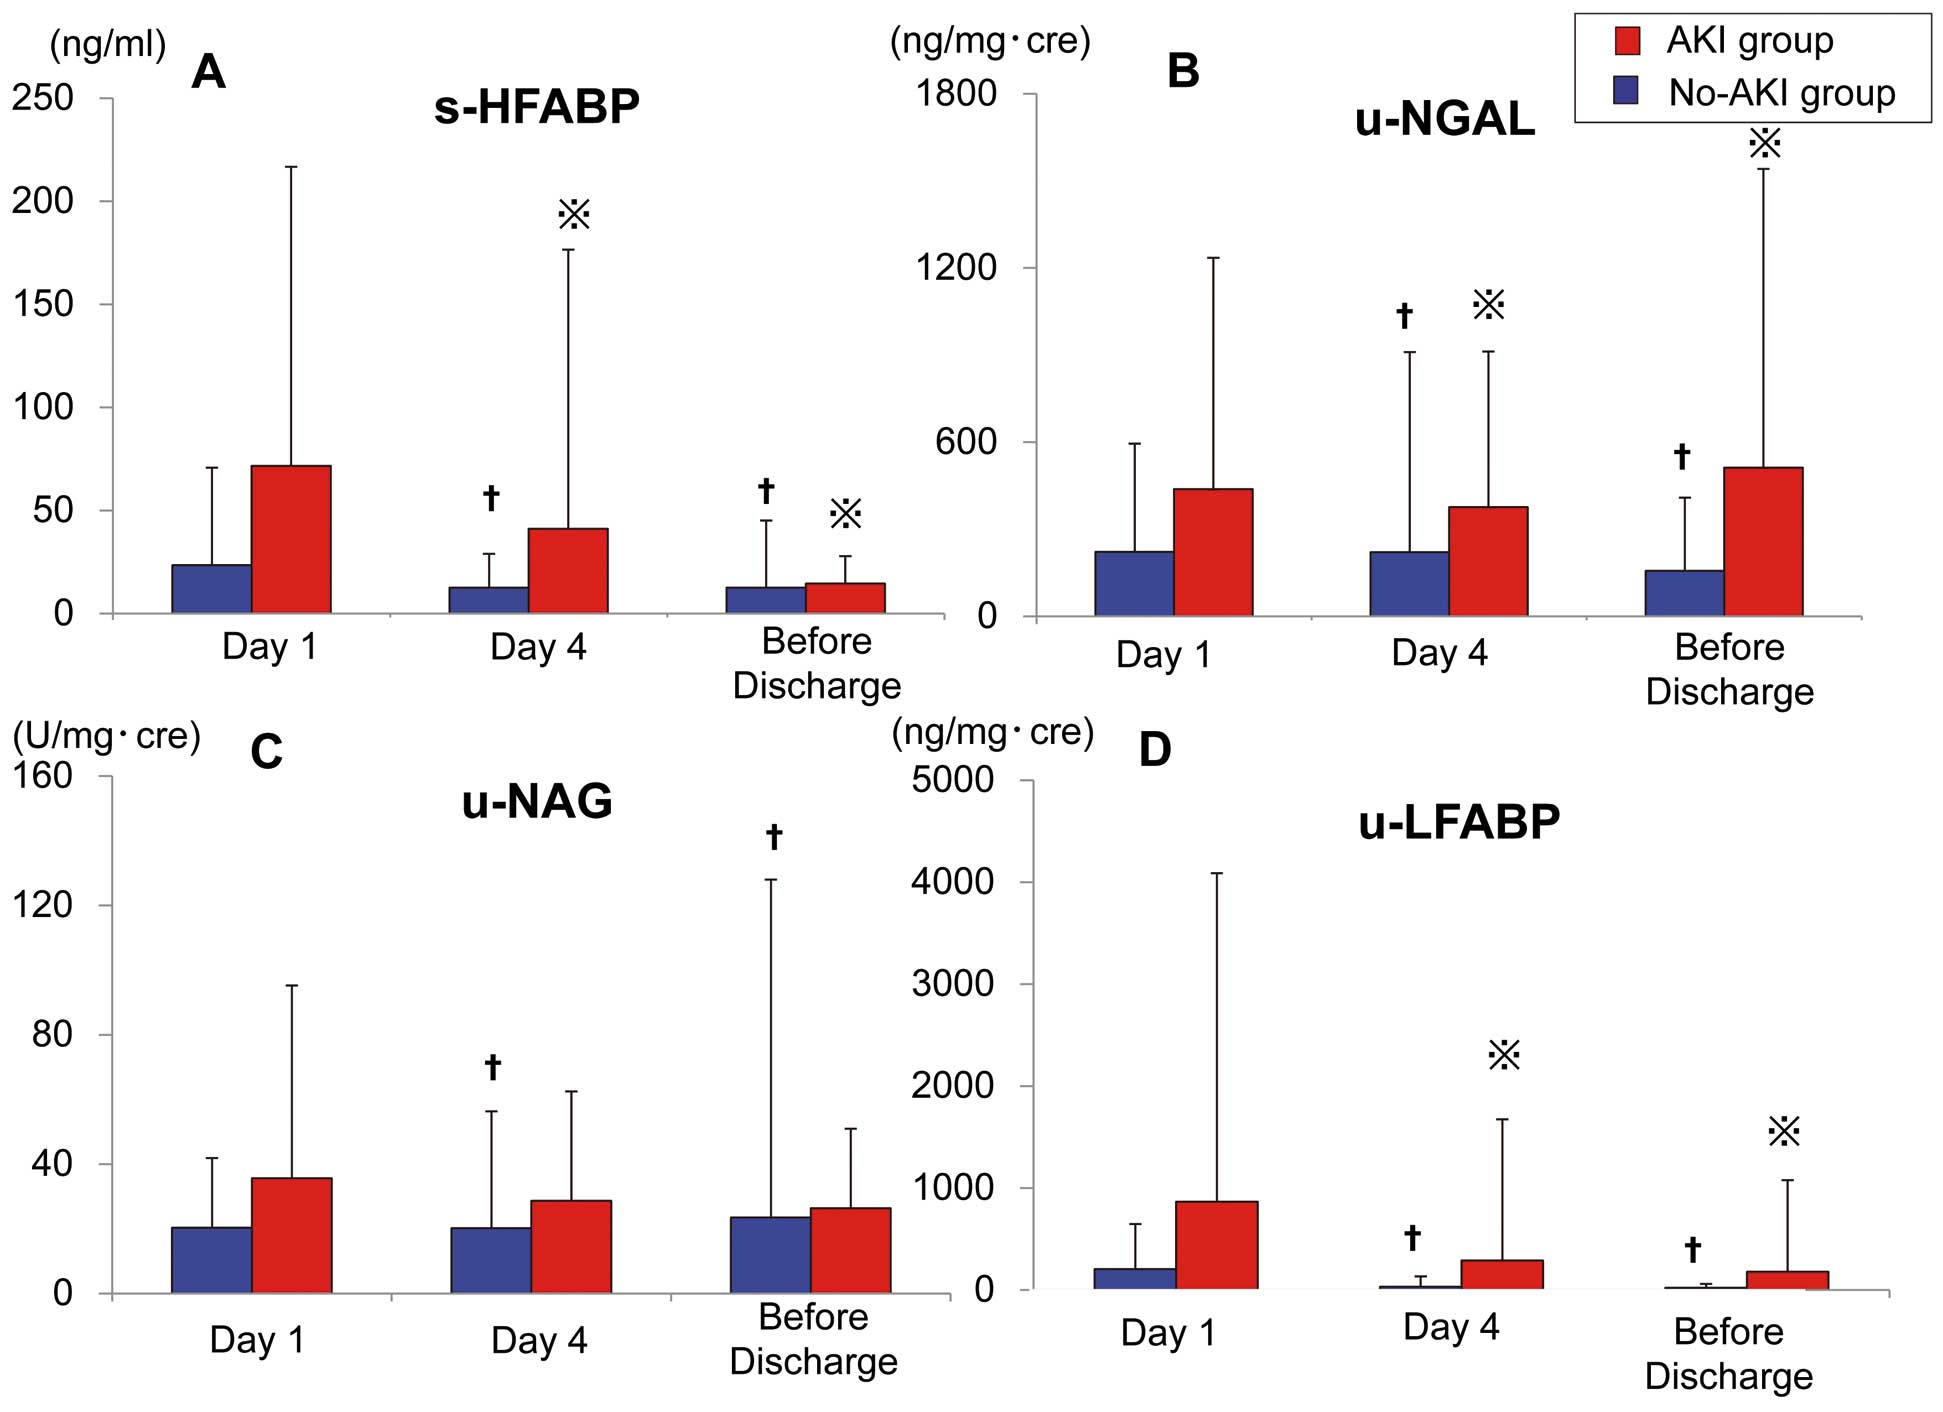
The serum level of HFABP significantly decreased on Day 4 and Before Discharge (15.9 [7.0–34.5] ng/ml and 10.1 [6.5–18.2] ng/ml, respectively) compared with the value on Day 1 (34.4 [19.0–53.7] ng/ml) in AKI patients, while that of HFABP also significantly decreased on Day 4 and Before Discharge (8.2 [5.0–14.2] ng/ml and 6.9 [4.4–12.3] ng/ml) compared with the values observed on Day 1 (11.2 [7.3–20.1] ng/ml) in the no-AKI patients. (Figure 2A) The urinary NGAL and LFABP values exhibited the same results. (Figures 2B,D) The urinary NAG was significantly decreased on Day 4 and Before Discharge in comparison with its value on Day 1 in the no-AKI patients, but was unchanged in the AKI patients (Figure 2C).
Relationship Between the Urine or Serum Biomarkers and Prognosis
The length of ICU hospitalization and total hospitalization was 4 [3–5] days and 26 [16–41] days, respectively, which was significantly longer in AKI patients, especially, the Class I/F patients. A total of 35 of the 282 patients died in the hospital, including 13 of the 49 patients with a Class R status, 6 of the 15 patients with a Class I status and 2 of the 5 patients with a Class F status. The in-hospital mortality rate was significantly higher in the Class I/F group than in the Class R and no-AKI groups. The value of serum HFABP that produced the optimal balance between sensitivity and specificity (74.3% and 70.0%; AUC=0.726, P<0.001) to indicate in-hospital mortality was 21.0 ng/ml (Figure 1C). In the overall patient cohort, 100 patients (35.5%) exhibited a value >21.0 ng/ml.
A total of 53 HF events, including 19 re-admissions for HF, occurred within 90 days; 12 of the 49 patients with a Class R status, 5 of the 15 patients with a Class I status and 2 of the 5 patients with a Class F status died within 90 days. The multivariate Cox regression model indicated that a HFABP level <22.9 ng/ml and AKI (HR: 3.854, 95% CI: 1.107–13.417; P=0.034), HFABP level ≥22.9 ng/ml and no-AKI (HR: 3.891, 95% CI: 1.387–10.919; P=0.010) and HFABP level ≥22.9 ng/ml and AKI (HR: 5.240, 95% CI: 1.980–13.867; P<0.001) were independent predictors of 90-day mortality (Table 3). The cutoff value of HFABP was defined by the ROC curves of AKI. The Kaplan-Meier survival curves showed that prognosis, including all-cause death and HF events, was significantly poorer in the high serum HFABP group (≥22.9 ng/ml) than in the low serum HFABP group (<22.9 ng/ml) (Figures 3A,C). Furthermore, the Kaplan-Meier survival curves showed that prognosis, including all-cause death, were significantly poorer in the high serum HFABP with AKI group than in the low serum HFABP without AKI group (Figure 3B). In addition, prognosis, including HF events, was significantly poorer in the high serum HFABP with AKI group than in the low serum HFABP without AKI group (Figure 3D).
Table 3.
Cox Regression Analysis of the Association Between 90-Day Cumulative Mortality and the Clinical Findings in Patients With Acute Heart Failure
| 90-day mortality |
Univariate analysis |
Multivariate analysis |
| HR |
95% CI |
P value |
HR |
95% CI |
P value |
| HFABP level and AKI status |
| HFABP <22.9 and no-AKI |
1.000 |
|
|
1.000 |
|
|
| HFABP <22.9 and AKI |
5.234 |
1.531–17.889 |
0.008 |
3.854 |
1.107–13.417 |
0.034 |
| HFABP ≥22.9 and no-AKI |
5.137 |
1.862–14.172 |
0.002 |
3.891 |
1.387–10.919 |
0.010 |
| HFABP ≥22.9 and AKI |
9.184 |
3.742–22.543 |
<0.001 |
5.240 |
1.980–13.867 |
0.001 |
| Adjusting factors |
| Age (per 1 year increase) |
1.018 |
0.986–1.052 |
0.271 |
|
|
|
| SBP (per 10 mmHg increase) |
0.793 |
0.724–0.868 |
<0.001 |
0.873 |
0.794–0.958 |
0.004 |
| LVEF (per 1% increase) |
0.993 |
0.973–1.013 |
0.476 |
|
|
|
| Sodium (per mmol/L increase) |
0.914 |
0.881–0.948 |
<0.001 |
0.962 |
0.923–1.004 |
0.075 |
| Hemoglobin (per 1.0 g/dl increase) |
0.922 |
0.808–1.052 |
0.226 |
|
|
|
| Creatinine (per 0.1 mg/dl increase) |
0.999 |
0.992–1.006 |
0.841 |
|
|
|
| hs-TropT (per 0.01 ng/ml increase) |
1.001 |
0.998–1.004 |
0.435 |
|
|
|
| NGAL (per 10 ng/mg·cre increase) |
1.004 |
1.000–1.009 |
0.076 |
|
|
|
| BNP (per 10 pg/ml increase) |
1.001 |
1.000–1.002 |
0.090 |
|
|
|
MBP, mean blood pressure. Other abbreviations as in Tables 1,2.

Discussion
We demonstrated in the present study that the serum HFABP level was the most effective marker for detecting the presence of AKI on admission, especially in Class I/F patients, compared with urinary biomarkers that reflect renal tubular injury. Furthermore, a high level of serum HFABP was found to predict a poor mid-term prognosis, including all-cause death and HF events within 90 days. It may be more reliable to predict the occurrence of AKI and a poor prognosis in the setting of AHF using a marker of cardiac injury and congestion than using a marker of renal tubular injury.
Urinary LFABP, which is produced in the proximal tubules in response to renal hypoxia and oxidative stress, has been identified as a useful marker for the diagnosis of AKI.17,18
NGAL is a 25-kDa protein normally secreted by renal tubular cells, leukocytes and several other types of epithelial cells in response to ischemic or toxic injury.19
In patients with AKI, various stresses first increase the serum NGAL in the circulation, which induces the activation of neutrophils. An increased amount of NGAL is filtered from the glomerular filtrate; some is reabsorbed by the damaged proximal tubules, while others are excreted. Increased urinary NGAL is therefore mainly related to impaired renal re-absorption,19
and it takes relatively longer periods of time for the urinary NGAL level to increase compared with the urine LFABP level. The levels of urinary NGAL and LFABP are therefore useful markers of detecting AKI in AHF patients.7–10
Tubular injury is also considered to play an important role in the pathology of AKI in AHF patients, and the AUC for the 12- to 24-h urine NGAL level for predicting AKI at 72–96 h in AHF patients is satisfactory, with a value of 0.717.10
The prognostic utility of the urinary NGAL level has also been reported, and the AUC for the urine NGAL level for predicting HF re-hospitalization or all-cause mortality within 30 days is also satisfactory at 0.731.9
Meanwhile, Dupont et al reported that the baseline (Day 1) urinary NGAL levels did not predict AKI; thus, a lack of significant renal tubular injury was demonstrated despite the presence of AKI in AHF patients.11
Furthermore, these traditional renal tubular injury markers were elevated with a delay after AKI,10,20
so it might be difficult to detect AKI at the time of AHF onset.
These findings suggest that identification of biomarkers that can detect AKI according to other mechanisms is required for AHF patients. Because cardiac dysfunction induces renal impairment, demonstrated as “cardiorenal syndrome”,21
the co-occurrence of these pathologies might be important for the development of AKI in AHF patients. Traditionally, AKI has been attributed to hypoperfusion of the kidney because of progressive impairment of cardiac output or intravascular volume depletion secondary to the aggressive use of diuretics.22
However, attention has shifted from this cardiac output (“forward failure”) to venous congestion (“backward failure”) as the most important hemodynamic determinant.23
The development of “congestive kidney failure” induced by increased renal venous pressure arising from venous congestion (increased renal afterload) and increased renal interstitial pressure (intrinsic renal compromise) might be important mechanisms underlying the development of AKI in AHF patients.23
Therefore, identification of a diagnostic biomarker that can reflect heart and renal congestion might be especially useful for detecting AKI in AHF patients.
The serum level of HFABP indicates the presence of latent and ongoing cardiomyocyte damage, and is a sensitive marker of minor myocardial injury in patients with congestive HF.24
Elevation of the HFABP level could identify patients with congestive HF at high risk for future cardiac events, as demonstrated in the present study.25
HFABP is rapidly released into the circulation when the myocardium is injured, and the myocardium is easily injured by sudden volume and pressure overload; in other words, heart congestion. In fact, the serum HFABP level was elevated in all AHF patients in the present study, and would be even more highly elevated in severely decompensated AHF. The sickest AHF patients are prone to develop AKI because of the effects of hemodynamic or neurohormonal disturbances. This finding is important evidence for why the serum H-FABP level is a better biomarker for AKI in AHF patients. Various stressors initially increase the serum HFABP level in the circulation of AHF patients, and then the increased amount of HFABP is filtered from the glomerular filtrate, but might not be able to be excreted in the patients already suffering from AKI, which may be another factor making it possible to detect AKI based on the serum HFABP level. In patients with AHF, the more robust association observed between the HFABP level and AKI results from the fact that the HFABP level reflects more severe AHF and congestion. In AHF patients, it may be more effective to use general markers that reflect “cardiorenal syndrome” than to use discriminative markers with the ability to detect “localized” renal tubular injury.
Study Limitations
There are several possible limitations associated with this study. First, diagnosing CKD based on the lowest value recorded within the year before admission was important, but it was difficult to apply to all the patients in the present study. The creatinine level before admission could not be used in 57 patients (34.8%). Second, the present study was a single-center study, and small numbers of patients were included in each of the groups used to evaluate the prognosis, so a patient bias might exist. Third, urinary volume criteria were not used for the definition of AKI in the present study. The definition of AKI used in the present study was based on the presence of AKI on admission; therefore, it was impossible to include urinary criteria. Fourth, the population evaluated in our study was limited to only those patients admitted to the ICU, and AHF patients admitted to general wards were excluded. In other words, patients with severe AHF who required intensive care were included in the present study. Finally, the method used to evaluate the H-FABP level was completely changed by DS Pharma Biomedica in July 2012 from a MARKIT-M HFABP ELISA kit to a LIBLIA H-FABP latex agglutination turbidimetric immunoassay. This is a major limitation in the present study, however; the results with each method had good correlation (r=0.994). The value of HFABP obtained from these different methods would not be different.
Conclusions
The serum HFABP level is the most available biomarker to detect the presence of AKI, especially Class I/F status, on admission of patients with AHF, and produced the optimum balance between sensitivity and specificity to indicate the presence of AKI. Furthermore, high levels of serum HFABP could predict a worse short-term prognosis, including in-hospital mortality, as well as a worse mid-term prognosis, including all-cause death and HF events within 90 days, in patients with AHF.
Acknowledgments
We are grateful to the staff of the ICU and the medical records office at Chiba Hokusoh Hospital, Nippon Medical School, for collecting the medical data.
Disclosures
Name of Grant: None declared.
References
- 1.
Bellomo R, Kellum JA, Ronco C. Defining and classifying acute renal failure: From advocacy to consensus and validation of the RIFLE criteria. Intensive Care Med 2007; 33: 409–413.
- 2.
Bellomo R, Ronco C, kellum JA, Mehta RL, Palevsky P. Acute renal failure: Definition, outcome measures, animal models, fluid therapy and information technology needs – the Second International Consensus Conference of the Acute Dialysis Quality Initiative (ADQI) Group. Crit Care 2004; 8: R204–R212.
- 3.
Hsieh MJ, Chen YC, Chen CC, Wang CL, Wu LS, Wang CC. Renal dysfunction on admission, worsening renal function, and severity of acute kidney injury predict 2-year mortality in patients with acute myocardial infarction. Circ J 2013; 77: 217–223.
- 4.
Hata N, Yokoyama S, Shinada T, Kobayashi N, Shirakabe A, Tomita K, et al. Acute kidney injury and outcomes in acute decompensated heart failure: Evaluation of the RIFLE criteria in an acutely ill heart failure population. Eur J Heart Fail 2010; 12: 32–37.
- 5.
Shirakabe A, Hata N, Kobayashi N, Shinada T, Tomita K, Tsurumi M, et al. Long-term prognostic impact after acute kidney injury in patients with acute heart failure: Evaluation of the RIFLE criteria. Int Heart J 2012; 53: 313–319.
- 6.
Shirakabe A, Hata N, Kobayashi N, Shinada T, Tomita K, Tsurumi M, et al. Prognostic impact of acute kidney injury in patients with acute decompensated heart failure. Circ J 2013; 77: 687–696.
- 7.
Shrestha K, Shao Z, Singh D, Dupont M, Tang WH. Relation of systemic and urinary neutrophil gelatinase-associated lipocalin levels to different aspects of impaired renal function in patients with acute decompensated heart failure. Am J Cardiol 2012; 110: 1329–1335.
- 8.
Sato N, Kamiya M, Yoshira A. A novel marker, urinary liver-type fatty acid binding protein for the detection of renal tubular damage in acute decompensated heart failure. J Am Coll Cardiol 2008; 51: A338.
- 9.
Maisel AS, Mueller C, Fitzgerald R, Brikhan R, Hiestand BC, Iqbal N, et al. Prognostic utility of plasma neutrophil gelatinase-associated lipocalin in patients with acute heart failure: The NGAL EvaLuation Along with B-type NaTriuretic Peptide in acutely decompensated heart failure (GALLANT) trial. Eur J Heart Fail 2011; 13: 846–851.
- 10.
Collins SP, Hart KW, Lindsell CJ, Fermann GJ, Weintraub NL, Miller KF, et al. Elevated urinary neutrophil gelatinase-associated lipocalcin after acute heart failure treatment is associated with worsening renal function and adverse events. Eur J Heart Fail 2012; 14: 1020–1029.
- 11.
Dupont M, Shrestha K, Singh D, Awad A, Kovach C, Scarcipino M, et al. Lack of significant renal tubular injury despite acute kidney injury in acute decompensated heart failure. Eur J Heart Fail 2012; 14: 597–604.
- 12.
Gheorghiade M, Zannad F, Sopko G, Klein L, Piña IL, Konstam MA, et al. Acute heart failure syndromes: Current state and framework for future research. Circulation 2005; 112: 3958–3968.
- 13.
McMurray JJ, Adamopoulos S, Anker SD, Auricchio A, Böhm M, Dickstein K, et al. ESC Guidelines for the diagnosis and treatment of acute and chronic heart failure 2012: The Task Force for the Diagnosis and Treatment of Acute and Chronic Heart Failure 2012 of the European Society of Cardiology: Developed in collaboration with the Heart Failure Association (HFA) of the ESC. Eur Heart J 2012; 33: 1787–1847.
- 14.
Mathew TH, Johnson DW, Jones GR. Chronic kidney disease and automatic reporting of estimated glomerular filtration rate: Revised recommendations. Med J Aust 2007; 187: 459–463.
- 15.
Levey AS, Bosch JP, Lewis JB, Greene T, Rogers N, Roth D. A more accurate method to estimate glomerular filtration rate from serum creatinine: A new prediction equation: Modification of Diet in Renal Disease Study Group. Ann Intern Med 1999; 130: 461–470.
- 16.
Iseki K. Chronic kidney disease in Japan. Intern Med 2008; 47: 681–689.
- 17.
Doi K, Negishi K, Ishizu T, Katagiri D, Fujita T, Matsubara T, et al. Evaluation of new acute kidney injury biomarkers in a mixed intensive care unit. Crit Care Med 2011; 39: 2464–2469.
- 18.
Matsui K, Kamijo-Ikemori A, Sugaya T, Yasuda T, Kimura K. Usefulness of urinary biomarkers in early detection of acute kidney injury after cardiac surgery in adults. Circ J 2012; 76: 213–220.
- 19.
Mori K, Lee HT, Rapoport D, Drexler IR, Foster K, Yang J, et al. Endocytic delivery of lipocalin-siderophore-iron complex rescues the kidney from ischemia-reperfusion injury. J Clin Invest 2005; 115: 610–621.
- 20.
Endre ZH, Pickering JW, Walker RJ, Devarajan P, Edelstein CL, Bonventre JV, et al. Improved performance of urinary biomarkers of acute kidney injury in the critically ill by stratification for injury duration and baseline renal function. Kidney Int 2011; 79: 1119–1130.
- 21.
Ronco C, Haapio M, House AA, Anavekar N, Bellomo R. Cardiorenal syndrome. J Am Coll Cardiol 2008; 52: 1527–1539.
- 22.
Ljungman S, Laragh JH, Cody RJ. Role of the kidney in congestive heart failure: Relationship of cardiac index to kidney function. Drugs 1990; 39: 10–24.
- 23.
Mullens W, Abrahams Z, Francis GS, Sokos G, Taylor DO, Starling RC, et al. Importance of venous congestion for worsening of renal function in advanced decompensated heart failure. J Am Coll Cardiol 2009; 53: 589–596.
- 24.
Goto T, Takase H, Toriyama T, Sugiura T, Sato K, Ueda R, et al. Circulating concentrations of cardiac proteins indicate the severity of congestive heart failure. Heart 2003; 89: 1303–1307.
- 25.
Setsuta K, Seino Y, Kitahara Y, Arau M, Ohbayashi T, Takano T, et al. Elevated levels of both cardiomyocyte membrane and myofibril damage markers predict adverse outcomes in patients with chronic heart failure. Circ J 2008; 72: 569–574.