Abstract
Background:
Postoperative atrial fibrillation (AF) is a common complication following coronary artery bypass grafting (CABG). We investigated the risk factors for postoperative AF and analyzed the relationship between blood sugar concentration (BS) and AF after CABG.
Methods and Results:
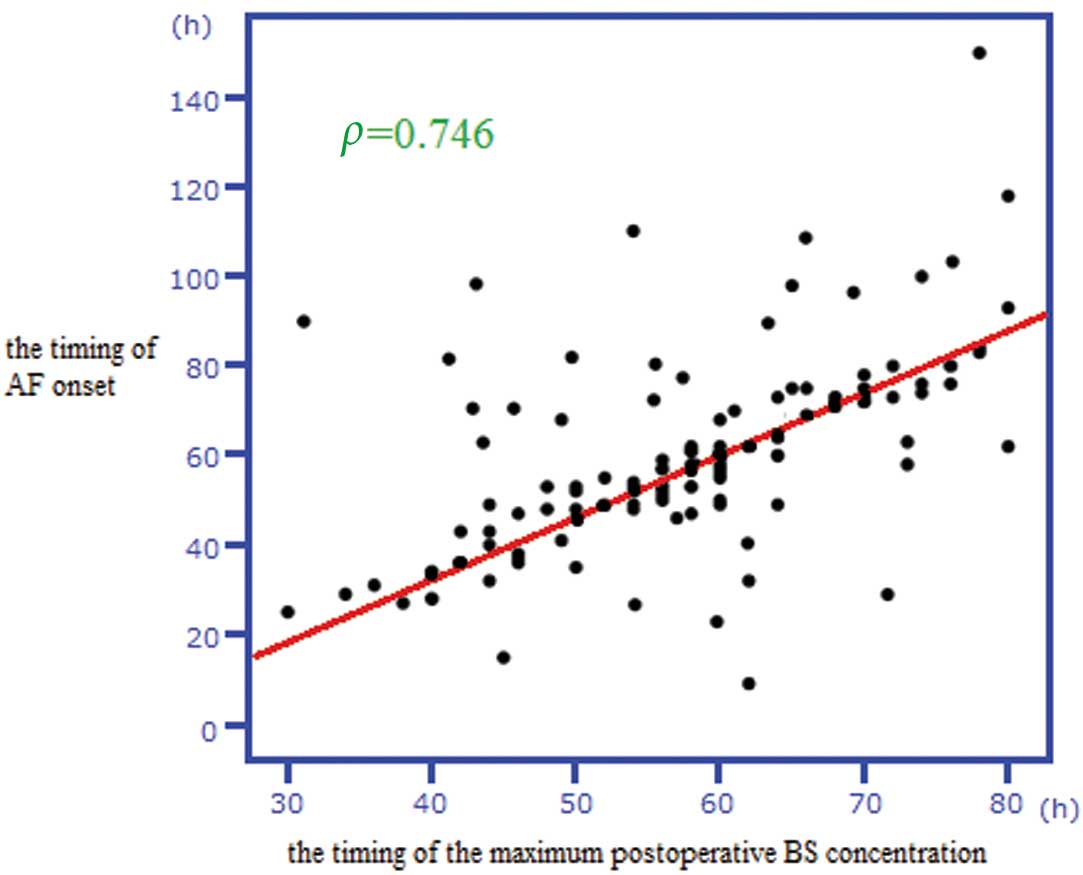
A total of 199 consecutive patients who underwent isolated CABG were retrospectively examined and classified according to the presence (n=95) or absence (n=104) of postoperative AF. On univariate analysis mean postoperative BS (P<0.001), postoperative drainage volume (P<0.001), age (P=0.034), presence of diabetes mellitus (DM; P=0.004), and postoperative estimated glomerular filtration rate (P=0.032) were significant risk factors for postoperative AF. On multivariate analysis mean postoperative BS (OR, 1.041; 95% CI: 1.008–1.079; P<0.001), postoperative drainage volume (OR, 1.003; 95% CI: 1.001–1.006; P=0.001), and age (OR, 1.040; 95% CI: 1.002–1.083; P=0.041) were significant risk factors for postoperative AF. Postoperative AF often occurred in patients with high postoperative BS, irrespective of DM. The BS cut-off that predicted postoperative AF occurrence was 180 mg/dl. A strong positive correlation existed between the time of the maximum postoperative BS and AF onset time (ρ=0.746).
Conclusions:
Mean postoperative BS and postoperative drainage volume are risk factors for AF after CABG. AF was strongly associated with maximum postoperative BS. Intensive glycemic control could reduce AF occurrence after CABG. (Circ J 2015; 79: 112–118)
Postoperative atrial fibrillation (AF) is one of the most common complications following coronary artery bypass grafting (CABG).1–3
The reported incidence of AF after CABG ranges from 15% to 50%.1,3,4
Postoperative AF is undesirable because of its many complications, such as hemodynamic compromise, thromboembolic events, prolonged duration of hospital stay, and increased mortality.2,3,5
Editorial p 45
Although the risk factors for AF after CABG have been reported, these remain controversial.1–3
Recently, it was reported that metabolic diseases,6
including diabetes mellitus (DM) and obesity, are related to AF occurrence.7–9
Surgical stress-induced metabolic changes can cause postoperative complications, including arrhythmia and post-surgical infection.
The aims of the present study were to identify predictors of postoperative AF after CABG, and to investigate the relationship between postoperative blood sugar concentration (BS) and postoperative AF.
Methods
Patients
We retrospectively studied 199 consecutive patients who underwent isolated CABG at Gunma Prefectural Cardiovascular Center between April 2009 and April 2011. Informed consent was obtained from all patients. Patient mean age was 68.9±8.9 years, and 157 were men. The mean number of grafts used per patient was 2.8±1.0. All patients were in sinus rhythm at the time of operation. Patients were excluded from the study if they had: (1) undergone concomitant heart valve surgery, aortic surgery, or congenital heart surgery; (2) exhibited ischemic mitral valve regurgitation; (3) a previous history of cardiac surgery; or (4) a history of AF. Patients undergoing dialysis were also excluded. Renal insufficiency was defined as estimated glomerular filtration rate (eGFR) <60 ml·min−1·1.73 m−2. Patients were divided into 2 groups based on the presence of AF after CABG: with AF (group A, n=95) and without AF (group S, n=104;
Table 1).
Table 1.
Patient Clinical Characteristics
| Variable |
Group A (n=95) |
Group S (n=104) |
P-value |
| Sex (male) |
78 (82.1) |
79 (76.0) |
0.385§ |
| Age (years) |
70.3±8.5 |
67.2±9.1 |
0.034†,# |
| Body mass index (kg/m2) |
22.9 (21.2–25.0) |
23.0 (21.3–25.7) |
0.715‡ |
| Hypertension |
76 (80.0) |
78 (75.0) |
0.304§ |
| Dyslipidemia |
66 (69.5) |
69 (66.3) |
0.685§ |
| HDL/LDL ratio |
2.6 (1.9–3.2) |
3.0 (2.1–3.1) |
0.835‡ |
| Renal insufficiency |
32 (33.7) |
30 (28.8) |
0.206§ |
| Preoperative eGFR (ml·min−1·1.73 m−2) |
50 (34.7–62.4.8) |
59 (38.4–69.2) |
0.247‡ |
| Hyperuricemia |
22 (23.2) |
19 (18.3) |
0.327§ |
| DM |
56 (58.9) |
40 (38.5) |
0.004§,# |
| HbA1c (%) |
7.2±1.1 |
7.1±1.3 |
0.588† |
| Preoperative fasting BS (mg/dl) |
100.4 (81.0–118.5) |
102.3 (83.7–119.0) |
0.331‡ |
| Old MI |
39 (41.1) |
40 (38.5) |
0.857§ |
| PCI |
15 (15.8) |
25 (24.0) |
0.118§ |
| Cerebral infarction |
29 (30.5) |
30 (28.8) |
0.781§ |
| Peripheral vascular disease |
4 (4.2) |
8 (7.7) |
0.224§ |
| Smoking history |
64 (67.4) |
70 (67.3) |
0.897§ |
| COPD |
2 (2.1) |
3 (2.9) |
0.680† |
| Preoperative HR (beats/min) |
70.0 (62–80) |
68.5 (60–79) |
0.461‡ |
| Left atrial diameter |
40.0±6.8 |
38.9±6.9 |
0.374† |
| EF grade |
|
|
0.652§ |
| EF ≥60% |
52 (54.7) |
55 (52.9) |
|
| 40%≤EF<60% |
30 (31.6) |
39 (37.5) |
|
| EF <40% |
13 (13.7) |
10 (9.6) |
|
| MR |
|
|
0.573§ |
| None |
67 (70.5) |
82 (78.8) |
|
| 1 |
20 (21.1) |
16 (15.4) |
|
| 2 |
8 (8.4) |
6 (5.8) |
|
| β-blocker |
24 (25.3) |
30 (28.8) |
0.530§ |
| α-blocker |
19 (20.0) |
22 (21.2) |
0.820§ |
| Calcium channel blocker |
49 (51.6) |
46 (44.2) |
0.286§ |
| Statin |
57 (60.0) |
62 (59.6) |
0.809§ |
| Oral diabetic therapy |
33 (34.7) |
27 (26.0) |
0.061§ |
| Insulin |
17 (17.9) |
20 (19.2) |
0.618§ |
| ACEI |
13 (13.7) |
8 (7.7) |
0.193§ |
| ARB |
50 (52.6) |
53 (51.0) |
0.898§ |
| Diuretic |
31 (32.6) |
30 (28.8) |
0.538§ |
Data given as n (%), mean±SD, or median (IQR). †Independent t-test; ‡Mann-Whitney U-test; §chi-squared test; #P<0.05. Various drugs were given preoperatively.
A, with atrial fibrillation; ACEI, angiotensin-converting enzyme-inhibitor; ARB, angiotensin receptor blocker; BS, blood sugar concentration; COPD, chronic obstructive pulmonary disease; DM, diabetes mellitus; EF, ejection fraction; eGFR, estimated glomerular filtration rate; HDL, high-density lipoprotein; LDL, low-density lipoprotein; MI, myocardial infarction; MR, mitral valve regurgitation; PCI, percutaneous coronary intervention; S, without atrial fibrillation.
A median full sternotomy was performed on all patients. Off-pump surgery was performed on 81 patients (40.5%). During on-pump surgery, ascending aortic and bicaval drainage cannulations were performed. Antegrade tepid blood cardioplegia was infused via the aortic root cannula and given every 20–30 min. All distal anastomoses were end-to-side anastomoses and all proximal anastomoses were achieved by partially clamping the aorta. Diamond anastomoses were performed in sequential grafts. Left internal thoracic artery grafts were exclusively grafted to the left anterior descending arteries; right internal thoracic artery and/or saphenous vein grafts were grafted to the left circumflex arteries; and gastroepiploic artery and/or saphenous vein grafts were grafted to the right coronary arteries.
Monitoring for AF Onset and Anti-Arrhythmia Therapy
Patients were continuously observed postoperatively in the intensive care unit (ICU) using monitors; after discharge from the ICU, they were monitored using telemetry. Twelve-lead electrocardiograms were obtained immediately after the operation and were recorded daily until the 7th postoperative day. Arrhythmia data were recorded for the duration of hospital stay. AF was considered to be present when an irregular rhythm was detected in the absence of P waves and/or an f wave was detected. When AF was detected and lasted >15 min, anti-arrhythmia treatment consisting of pilsicainide hydrochloride hydrate (75–150 mg/day) and/or flecainide acetate (100–200 mg/day) was given orally or by infusion, after consideration of renal function. In addition, heparin sodium infusion was used to achieve an activated partial thromboplastin time of twice the normal value. Verapamil hydrochloride (1–5γ) or diltiazem hydrochloride (1–5γ) was infused in cases of tachycardia (heart rate >100 beats/min). If the AF had not resolved after >3 days of anti-arrhythmia medication, and/or the patient’s hemodynamic instability did not improve, cardioversion was performed.
In this study, postoperative AF was defined as occurrence of the arrhythmia within the first 7 days after CABG. We considered that the influence of the surgical procedure would not be significant after a longer time.
BS Monitoring and Control
Serum BS was recorded every hour in the ICU until 6 h after operation and subsequently every 4 h. On the first day after surgery, meals were started and serum BS was checked before every meal and before patients went to sleep; this was continued until discharge. The maximum postoperative BS was defined as the highest concentration recorded from the operative day to discharge, and mean BS was defined as the meanvalue of the BS measurements on each day. The highest BS overall was recorded after meals, but frequent BS measurement was difficult, especially in the general ward. Therefore, we decided to use the highest BS measurement recorded before a meal as the maximum BS for the purposes of this study.
At Gunma Prefectural Cardiovascular Center, mean BS was controlled to <180 mg/dl using continuous venous insulin infusion (CVII) or sliding scale. The method used to control mean BS was at the discretion of the surgeon. Generally, CVII was used before a meal and sliding scale after a meal. Rapid insulin was used for the CVII and hypodermic injection of ultra-rapid insulin was used in the sliding scale.
Statistical Analysis
SPSS version 17.0 for Windows (SPSS, Chicago, IL, USA) was used to analyze the data. Normality was tested using the Shapiro-Wilk test. To compare the characteristics of the 2 patient groups, the independent t-test (for continuous variables with a normal distribution), Mann-Whitney U-test (for continuous variables with non-normal distribution), and chi-squared or Fisher’s exact tests (nominal scale) were used for univariate analysis. For multivariate analysis, multiple logistic regression was used to compare groups with or without AF with regard to patient characteristics and procedural characteristics. P<0.05 was considered significant in all comparisons. In addition, we performed the same analyses with patients grouped according to the presence or absence of DM.
The mean BS cut-off that would predict postoperative AF occurrence was determined. We used generalized linear regression analysis to determine whether BS of 200 mg/dl or 180 mg/dl was more beneficial for patient outcome, with reference to previous reports.10–12
We also used Spearman’s rank correlation coefficient to investigate the relationship between the time of postoperative AF occurrence and the time at which the maximum postoperative BS was recorded.
Results
The clinical and procedural characteristics are listed in
Tables 1,2. On univariate analysis the following were significant risk factors for postoperative AF: postoperative mean BS (group A, 209.0 mg/dl; range, 183.8–235.1 mg/dl; group S, 170.9 mg/dl; range, 149.2–188.7 mg/dl; P<0.001), postoperative drainage volume (group A, 414 ml; range, 280.4–503.0 ml; group S, 303 ml; range, 210.5–424.2 ml; P<0.001), presence of DM (group A, n=56; group S, n=40; P=0.004), postoperative eGFR (P=0.032), and age (group A, 70.3±8.5 years; group S, 67.2±9.1 years; P=0.034). When the patients were grouped according to the presence or absence of DM, postoperative mean BS (DM, P<0.001; non-DM, P<0.001) and postoperative drainage volume (DM, P=0.040; non-DM, P<0.001) were significant risk factors for AF in each group (Table 3).
Table 2.
Patient Procedural Characteristics
| Variable |
Group A (n=95) |
Group S (n=104) |
P-value |
| Clinical status |
|
|
0.210¶ |
| Elective |
82 (86.3) |
97 (93.2) |
|
| Urgent |
11 (11.5) |
7 (6.7) |
|
| Emergency |
2 (2.1) |
0 (0.0) |
|
| Congestive heart failure |
18 (18.9) |
22 (21.2) |
0.572§ |
| Intra aortic balloon pumping |
14 (14.7) |
16 (15.4) |
0.727§ |
| On pump |
59 (62.1) |
59 (56.7) |
0.216§ |
| Anastomosis |
3.0 (2.0–3.0) |
3.0 (2.0–3.0) |
0.340‡ |
| Operative time (min) |
253.4 (212.0–288.2) |
249.1 (197.0–301.4) |
0.888‡ |
| Aorta clamp time (min) |
69.0 (51.4–84.9) |
67.2 (50.0–82.8) |
0.294‡ |
| CPB time (min) |
114.2 (98.2–126.8) |
115.1 (94.8–140.0) |
0.472‡ |
| Intraoperative hemorrhage (ml) |
438 (360.8–581.2) |
445 (347.0–588.5) |
0.596‡ |
| Blood transfusion |
7 (7.4) |
9 (8.7) |
0.307§ |
| Postoperative drainage volume (ml) |
414 (280.4–503.0) |
303 (210.5–424.2) |
<0.001‡,# |
| Postoperative mean BS (mg/dl) |
209.0 (183.8–235.1) |
170.9 (149.2–188.7) |
<0.001‡,# |
| Postoperative eGFR (ml·min−1·1.73 m−2) |
46.7 (31.0–62.5) |
55.1 (34.2–70.5) |
0.032‡,# |
| Postoperative minimum Hb (g/dl) |
9.2±1.6 |
9.3±1.4 |
0.623† |
| Postoperative maximum CRP (mg/dl) |
9.2 (7.5–11.7) |
9.3 (7.1–11.2) |
0.261‡ |
| Postoperative maximum CPK-MB (IU) |
28 (22.1–37.5) |
28 (19.5–39.9) |
0.420‡ |
| Ventilation time (min) |
299 (218.0–899.4) |
302 (205.0–840.4) |
0.625‡ |
| Volume balance (>1,000 ml) |
69 (72.6) |
69 (66.3) |
0.479§ |
| Length of ICU stay (day) |
4.9 (3.9–6.8) |
5.0 (3.9–6.0) |
0.247‡ |
| Postoperative cerebral infarction |
2 (2.1) |
2 (1.9) |
0.504§
|
Data given as n (%), mean±SD, or median (IQR). †Independent t-test; ‡Mann-Whitney U-test; §chi-squared test; ¶Fisher’s exact test; #P<0.05.
CPB, cardiopulmonary bypass; CPK-MB, myocardial band enzymes of creatine phosphokinase; CRP, C-reactive protein; ICU, intensive care unit. Other abbreviations as in Table 1.
Table 3.
Univariate Risk Factors for Postoperative AF vs. Presence of DM
| Variable |
DM |
Non-DM |
Group A
(n=56) |
Group S
(n=40) |
P-value |
Group A
(n=39) |
Group S
(n=64) |
P-value |
| Age (years) |
69.1±9.2 |
65.7±7.9 |
0.051 |
72.0±7.6 |
68.7±9.9 |
0.078 |
| Postoperative drainage volume (ml) |
378
(264.2–530.8) |
311
(240.0–431.7) |
0.040# |
451
(318.0–528.5) |
321
(220.0–443.1) |
<0.001# |
| Postoperative mean BS (mg/dl) |
213.7
(188.9–240.1) |
173.8
(149.6–190.0) |
<0.001# |
211.0
(181.4–232.6) |
169.1
(143.7–181.1) |
<0.001# |
| Postoperative eGFR (ml·min−1·1.73 m−2) |
41.0
(29.5–60.2) |
54.8
(25.8–66.3) |
0.078 |
46.7
(34–62.1) |
56.1
(35.8–69.4) |
0.187 |
Data given as mean±SD or median (IQR). #P<0.05. The analytic procedure is the same as that used in Tables 1,2.
Abbreviations as in Table 1.
On multivariate analysis, postoperative mean BS (odds ratio [OR], 1.041; 95% confidence interval [CI]: 1.008–1.079; P<0.001), postoperative drainage volume (OR, 1.003; 95% CI: 1.001–1.006; P=0.001), and age (OR, 1.040; 95% CI: 1.002–1.083; P=0.041) were significant and independent risk factors for postoperative AF (Table 4). When patients were separated according to the presence or absence of DM, postoperative mean BS (DM: OR, 1.039; 95% CI: 1.009–1.057; P=0.001; non-DM: OR, 1.045; 95% CI: 1.012–1.074; P<0.001) and postoperative drainage volume (DM: OR, 1.004; 95% CI: 1.001–1.008; P=0.029; non-DM: OR, 1.004; 95% CI: 1.001–1.006; P=0.031) were still significant risk factors for AF in each group. On multivariate analysis, maximum postoperative C-reactive protein (CRP) was also significantly different (OR, 1.139; 95% CI: 1.010–1.198; P=0.047). The other predictors studied were not associated with postoperative AF after CABG.
Table 4.
Multivariate Risk Factors for Postoperative AF
| Variable |
PRC |
SE |
OR |
95% CI |
P-value |
| Total patients |
| Age |
0.047 |
0.022 |
1.040 |
1.002–1.083 |
0.041# |
| DM |
0.037 |
0.293 |
1.006 |
0.637–1.621 |
0.107 |
| Left atrial diameter |
0.022 |
0.028 |
1.023 |
0.969–1.079 |
0.308 |
| MR 1° |
0.271 |
0.448 |
1.497 |
0.598–3.410 |
0.261 |
| MR 2° |
0.014 |
0.688 |
1.050 |
0.248–3.575 |
0.873 |
| Postoperative eGFR |
−0.038 |
0.171 |
0.983 |
0.954–1.032 |
0.081 |
| Postoperative maximum CRP |
0.128 |
0.047 |
1.139 |
1.010–1.198 |
0.047# |
| Postoperative mean BS |
0.037 |
0.012 |
1.041 |
1.008–1.079 |
<0.001# |
| Postoperative drainage volume |
0.007 |
0.001 |
1.003 |
1.001–1.006 |
0.001# |
| Volume balance |
0.037 |
0.308 |
1.051 |
0.538–1.997 |
0.581 |
| DM patients |
| Age |
0.024 |
0.031 |
1.026 |
0.943–1.094 |
0.267 |
| Left atrial diameter |
0.050 |
0.031 |
1.041 |
0.983–1.095 |
0.226 |
| MR 1° |
0.021 |
0.487 |
1.238 |
0.430–2.672 |
0.490 |
| Postoperative eGFR |
−0.018 |
0.014 |
0.974 |
0.952–1.001 |
0.051 |
| Postoperative maximum CRP |
0.060 |
0.049 |
1.053 |
0.971–1.155 |
0.102 |
| Postoperative mean BS |
0.031 |
0.010 |
1.039 |
1.009–1.057 |
0.001# |
| Postoperative drainage volume |
0.005 |
0.003 |
1.004 |
1.001–1.008 |
0.029# |
| Volume balance |
0.093 |
0.550 |
1.173 |
0.472–3.281 |
0.808 |
| Non-DM patients |
| Age |
0.057 |
0.029 |
1.054 |
0.998–1.096 |
0.064 |
| Left atrial diameter |
−0.008 |
0.040 |
1.006 |
0.945–1.080 |
0.831 |
| MR 1° |
0.372 |
0.581 |
1.864 |
0.501–4.973 |
0.276 |
| MR 2° |
−0.041 |
0.764 |
0.728 |
0.201–1.831 |
0.347 |
| Postoperative eGFR |
−0.003 |
0.014 |
1.011 |
0.988–1.024 |
0.140 |
| Postoperative maximum CRP |
0.193 |
0.140 |
1.310 |
1.006–1.702 |
0.027# |
| Postoperative mean BS |
0.050 |
0.013 |
1.045 |
1.012–1.074 |
<0.001# |
| Postoperative drainage volume |
0.003 |
0.002 |
1.004 |
1.001–1.006 |
0.031# |
| Volume balance |
−0.090 |
0.720 |
0.937 |
0.248–3.516 |
0.864 |
#P<0.05. CI, confidence interval; OR, odds ratio; PRC, partial regression coefficient; SE, standard error. Other abbreviations as in Tables 1–3.
Regarding the BS cut-off that would prevent postoperative AF, according to previous reports,10–12
generalized linear regression analysis showed that mean BS of 180 mg/dl rather than 200 mg/dl would improve patient outcome (Table 5).
Table 5.
Cut-Off Comparison
| The OR and the incidence of each BS region were calculated |
| |
AF occurrence/all (%) |
OR (95% CI) |
|
| BS >200 (mg/dl) |
57/74 (77.0) |
Reference |
|
| 180<BS≤200 (mg/dl) |
31/50 (62.0) |
0.487 (0.2225–1.070) |
|
| BS ≤180 (mg/dl) |
7/75 (9.3) |
0.031 (0.012–0.080) |
|
| The OR and CCRs were calculated and the 2 cutoff values (200 mg/dl and 180 mg/dl) were compared |
| |
AF occurrence/all (%) |
OR (95% CI) |
CCR (%) |
| BS >200 (mg/dl) |
57/74 (77.0) |
Reference |
72.4 |
| BS ≤200 (mg/dl) |
38/125 (30.4) |
0.130 (0.067–0.252) |
| BS >180 (mg/dl) |
88/124 (71.0) |
Reference |
78.4 |
| BS ≤180 (mg/dl) |
7/75 (9.3) |
0.042 (0.017–0.102) |
CCR, correct classification rate. Other abbreviations as in Tables 1,3,4.
A strong statistically significant positive correlation was found between the time that the maximum postoperative BS was recorded and the time of postoperative AF onset (ρ=0.746;
Figure).
The only postoperative complication was cerebral infarction, which occurred in 4 patients (group A, n=2; group S, n=2; P=0.504;
Table 2).
Discussion
Many risk factors for AF after CABG have been reported, including hypertension, heart failure, chronic renal failure, cardiopulmonary bypass, electrolyte imbalance, intra-aortic balloon pumping, and dehydration.3,5,13
The mechanisms underlying the occurrence of AF after CABG, however, have not yet been clarified. Increasing age is the only independent risk factor for postoperative AF occurrence that has been consistently identified.2,3
Similarly, age was identified as an independent risk factor for postoperative AF in the present study.
BS and AF Occurrence
The most noteworthy and interesting finding of the present study was the timing of postoperative AF occurrence and its association with elevation of BS. Typically, postoperative BS increases because of impairment in the utilization of glucose. Postoperative AF usually occurs 24–96 h after surgery, with a peak incidence on the second postoperative day.5,14
In the present study, a strong positive correlation was detected between the timing of postoperative AF and maximum postoperative BS. This supports the theory that hyperglycemia induces AF. The mechanisms through which hyperglycemia could induce AF are as follows.
Hyperglycemia prolongs P-wave dispersion, which is an independent risk factor for AF,15–19
and P-wave dispersion is an indirect marker of atrial refractoriness. Some reports show that comparing preoperative and postoperative P-wave dispersion is useful in the prediction of postoperative AF.20,21
Furthermore, Burkett et al reported a relationship between blood glucose and QTc duration;22,23
this may be a result of the dysfunction of the human ether-a-go-go-related gene K+
channel, and hyperglycemia is considered to induce this dysfunction.24,25
As noted previously, hyperglycemia affects cardiac electrical functions, thereby leading to AF. In recent years, it has been reported that abnormal Ca2+
handling is related to ectopic activity that induces AF.26–28
Given that DM and hyperglycemia impair Ca2+
handling,29
they could cause AF.
There are other potential mechanisms through which hyperglycemia causes damage.30
For example, vascular damage caused by hyperglycemia induces tissue inflammation and fibrillation. Furthermore, hyperglycemia induces dysfunction in blood sugar utilization and fat hypermetabolism in cardiac muscle, thus elevating free fatty acids that cause cardiac dysfunction.10
Another mechanism through which hyperglycemia causes damage involves the elevation of serum osmotic pressure, which causes diastolic dysfunction and elevates left arterial pressure.
Influence of DM on AF Onset
It has been reported that DM is a risk factor for AF onset. Huxley et al reported that the relative risk of AF in patients with DM is 1.39 (95% CI: 1.10–1.75; P<0.001).31
Moreover, it has been reported that hemoglobin A1c, poor BS control, and DM are independently associated with an increased risk of AF.7,8
In the present study, postoperative hyperglycemia was a strong risk factor for postoperative AF, irrespective of the presence of DM (Tables 2–4). Although the presence of DM was a risk factor for postoperative AF on univariate analysis, there were no differences in the risk for postoperative AF between patients with and without DM on multivariate analysis. These results indicate that proper BS control may be able to prevent AF in both DM and non-DM patients.
BS Cut-Off
The BS cut-off that would predict postoperative AF was determined as <180 mg/dl in this study. Although BS control is beneficial for preventing postoperative AF,10,11
the best cut-off remains controversial. Many papers have reported that controlling BS to <200 mg/dl is beneficial, while tighter glycemic control, such as reducing BS to <140 mg/dl, improves the early mortality and morbidity associated with infection, ischemic events, and sepsis.10,11
There is a risk, however, of hypoglycemia in such cases,32
and the guidelines from the Society of Thoracic Surgeons recommend mean BS ≤180 mg/dl.12
Apart from the guidelines, in the present study generalized linear regression analysis showed that a mean BS of 180 mg/dl is better than 200 mg/dl. As noted, however, other morbidities may require tighter control of postoperative BS. Given the uncertainties surrounding this issue, we believe that further studies investigating BS cut-off values are required.
Other Risk Factors
Postoperative drainage volume and maximum postoperative CRP are significant risk factors for postoperative AF. The former certainly shows that hemodynamic instability, such as hypovolemia and low output, is related to postoperative AF.1,33
In this study, there was no significant association between AF and maximum postoperative CRP level on univariate analysis. Korantzopoulos et al, however, reported that markers of oxidative injury and inflammation, such as CRP, are elevated in patients with AF.34
Considering that it might be a confounding factor, we therefore included CRP among the factors in multivariate analysis. It has been suggested that there is a relationship between inflammation and AF, which may involve endothelial activation, the production of certain tissue factors from monocytes, increased platelet activation, and an increase in the expression of fibrinogen.35,36
One hypothesis is that interleukin elicits AF and inflammation, so both AF occurrence and CRP elevation are the result of an increase in interleukin. It remains unclear, however, whether inflammation causes AF or vice versa.
Although it has been reported that β-blockers are effective in preventing AF occurrence,37,38
they had no significant effect in this study. The prevalence of β-blocker treatment, however, was only approximately 20%, because the majority of patients were referred by family doctors as soon as myocardial infarction or angina pectoris was suspected or diagnosed. Thus, β-blockers were not given before operation.
Postoperative Cerebral Infarction
Postoperative cerebral infarction after CABG is an undesirable complication because of its negative effect on quality of life. In the present study, cerebral infarction occurred in only 4 cases, regardless of the presence of AF. In all cases, the operative procedures, such as aortic clamping, were thought to be the cause of postoperative cerebral infarction.
Study Limitations
The main limitations of the present study are that it was a retrospective case-control analysis and a single-center study, which may have biased the investigation. Further, glycemic control was not standardized. Based on the present results, an institutional glycemic control scale should be established.
Conclusions
The predictors of postoperative AF after CABG are hyperglycemia, age, postoperative drainage volume, and maximum postoperative CRP. In particular, hyperglycemia and postoperative AF after CABG were found to have a very strong association. Therefore, we believe that BS control should reduce the incidence of AF after CABG. Further studies, however, are necessary to investigate the relationship between postoperative AF and BS control.
Acknowledgments
The authors have no conflicts of interest to declare.
Disclosures
Grants: None.
References
- 1.
Amar D, Shi W, Hogue CW Jr, Zhang H, Passman RS, Thomas B, et al. Clinical prediction rule for atrial fibrillation after coronary artery bypass grafting. J Am Coll Cardiol 2004; 44: 1248–1253.
- 2.
Thorén E, Hellgren L, Jidéus L, Ståhle E. Prediction of postoperative atrial fibrillation in a large coronary artery bypass grafting cohort. Interact Cardiovasc Thorac Surg 2012; 14: 588–593.
- 3.
Shen J, Lall S, Zheng V, Buckley P, Damiano RJ Jr, Schuessler RB. The persistent problem of new-onset postoperative atrial fibrillation: A single-institution experience over two decades. J Thorac Cardiovasc Surg 2011; 141: 559–570.
- 4.
Ommen SR, Odell JA, Stanton MS. Atrial arrhythmias after cardiothoracic surgery. N Engl J Med 1997; 336: 1429–1434.
- 5.
Aranki SF, Shaw DP, Adams DH, Rizzo RJ, Couper GS, VanderVliet M, et al. Predictors of atrial fibrillation after coronary artery surgery: Current trends and impact on hospital resources. Circulation 1996; 94: 390–397.
- 6.
Watanabe H, Tanabe N, Watanabe T, Darbar D, Roden DM, Sasaki S, et al. Metabolic syndrome and risk of development of atrial fibrillation: The Niigata preventive medicine study. Circulation 2008; 117: 1255–1260.
- 7.
Huxley RR, Lopez FL, Folsom AR, Agarwal SK, Loehr LR, Soliman EZ, et al. Absolute and attributable risks of atrial fibrillation in relation to optimal and borderline risk factors: The Atherosclerosis Risk in Communities (ARIC) study. Circulation 2011; 123: 1501–1508.
- 8.
Huxley RR, Alonso A, Lopez FL, Filion KB, Agarwal SK, Loehr LR, et al. Type 2 diabetes, glucose homeostasis and incident atrial fibrillation: The Atherosclerosis Risk in Communities study. Heart 2012; 98: 133–138.
- 9.
Zacharias A, Schwann TA, Riordan CJ, Durham SJ, Shah AS, Habib RH. Obesity and risk of new-onset atrial fibrillation after cardiac surgery. Circulation 2005; 112: 3247–3255.
- 10.
Lazar HL, Chipkin SR, Fitzgerald CA, Bao Y, Cabral H, Apstein CS. Tight glycemic control in diabetic coronary artery bypass graft patients improves perioperative outcomes and decreases recurrent ischemic events. Circulation 2004; 109: 1497–1502.
- 11.
Furnary AP, Gao G, Grunkemeier GL, Wu Y, Zerr KJ, Bookin SO, et al. Continuous insulin infusion reduces mortality in patients with diabetes undergoing coronary artery bypass grafting. J Thorac Cardiovasc Surg 2003; 125: 1007–1021.
- 12.
Lazar HL, McDonnell M, Chipkin SR, Furnary AP, Engelman RM, Sadhu AR, et al; Society of Thoracic Surgeons Blood Glucose Guideline Task Force. The Society of Thoracic Surgeons practice guideline series: Blood glucose management during adult cardiac surgery. Ann Thorac Surg 2009; 87: 663–669.
- 13.
Chua SK, Shyu KG, Lu MJ, Hung HF, Cheng JJ, Lee SH, et al. Association between renal function, diastolic dysfunction, and postoperative atrial fibrillation following cardiac surgery. Circ J 2013; 77: 2303–2310.
- 14.
Solomon AJ, Berger AK, Trivedi KK, Hannan RL, Katz NM. The combination of propranolol and magnesium does not prevent postoperative atrial fibrillation. Ann Thorac Surg 2000; 69: 126–129.
- 15.
Yazici M, Ozdemir K, Altunkeser BB, Kayrak M, Duzenli MA, Vatankulu MA, et al. The effect of diabetes mellitus on the P-wave dispersion. Circ J 2007; 71: 880–883.
- 16.
Li Z, Hertervig E, Carlson J, Johansson C, Olsson SB, Yuan S. Dispersion of refractoriness in patients with paroxysmal atrial fibrillation: Evaluation with simultaneous endocardial recordings from both atria. J Electrocardiol 2002; 35: 227–234.
- 17.
Weber UK, Osswald S, Huber M, Buser P, Skarvan K, Stulz P, et al. Selective versus non-selective antiarrhythmic approach for prevention of atrial fibrillation after coronary surgery: Is there a need for pre-operative risk stratification? A prospective placebo-controlled study using low-dose sotalol. Eur Heart J 1998; 19: 794–800.
- 18.
Tükek T, Akkaya V, Atilgan D, Demirel E, Ozcan M, Güven O, et al. Effect of left atrial size and function on P-wave dispersion: A study in patients with paroxysmal atrial fibrillation. Clin Cardiol 2001; 24: 676–680.
- 19.
Karabag T, Aydin M, Dogan SM, Cetiner MA, Sayin MR, Gudul NE, et al. Prolonged P wave dispersion in pre-diabetic patients. Kardiol Pol 2011; 69: 566–571.
- 20.
Kaireviciute D, Aidietis A, Lip GY. Atrial fibrillation following cardiac surgery: Clinical features and preventative strategies. Eur Heart J 2009; 30: 410–425.
- 21.
Chandy J, Nakai T, Lee RJ, Bellows WH, Dzankic S, Leung JM. Increases in P-wave dispersion predict postoperative atrial fibrillation after coronary artery bypass graft surgery. Anesth Analg 2004; 98: 303–310.
- 22.
Burkett E, Keijzers G, Lind J. The relationship between blood glucose level and QTc duration in the critically ill. Crit Care Resusc 2009; 11: 8–13.
- 23.
Eckert B, Agardh CD. Hypoglycaemia leads to an increased QT interval in normal men. Clin Physiol 1998; 18: 570–575.
- 24.
Zhang Y, Han H, Wang J, Wang H, Yang B, Wang Z. Impairment of human ether-à-go-go-related gene (HERG) K+ channel function by hypoglycemia and hyperglycemia: Similar phenotypes but different mechanisms. J Biol Chem 2003; 278: 10417–10426.
- 25.
Hreiche R, Plante I, David LP, Simard C, Turgeon J, Drolet B. Impact of glucose concentration on cardiac ventricular repolarization under I Kr/I Ks blocking agents. J Mol Cell Cardiol 2009; 47: 210–220.
- 26.
Dobrev D. Atrial Ca2+ signaling in atrial fibrillation as an antiarrhythmic drug target. Naunyn Schmiedebergs Arch Pharmacol 2010; 381: 195–206.
- 27.
Neef S, Dybkova N, Sossalla S, Ort KR, Fluschnik N, Neumann K, et al. CaMKII-dependent diastolic SR Ca2+ leak and elevated diastolic Ca2+ levels in right atrial myocardium of patients with atrial fibrillation. Circ Res 2010; 106: 1134–1144.
- 28.
Heijman J, Voigt N, Nattel S, Dobrev D. Calcium handling and atrial fibrillation. Wien Med Wochenschr 2012; 162: 287–291.
- 29.
Zhang X, Chen C. A new insight of mechanisms, diagnosis and treatment of diabetic cardiomyopathy. Endocrine 2012; 41: 398–409.
- 30.
Teraguchi I, Imanishi T, Ozaki Y, Tanimoto T, Kitabata H, Ino Y, et al. Impact of stress hyperglycemia on myocardial salvage following successfully recanalized primary acute myocardial infarction. Circ J 2012; 76: 2690–2696.
- 31.
Huxley RR, Filion KB, Konety S, Alonso A. Meta-analysis of cohort and case-control studies of type 2 diabetes mellitus and risk of atrial fibrillation. Am J Cardiol 2011; 108: 56–62.
- 32.
Wiener RS, Wiener DC, Larson RJ. Benefits and risks of tight glucose control in critically ill adults: A meta-analysis. JAMA 2008; 300: 933–944.
- 33.
Mathew JP, Fontes ML, Tudor IC, Ramsay J, Duke P, Mazer CD, et al; Investigators of the Ischemia Research and Education Foundation; Multicenter Study of Perioperative Ischemia Research Group. A multicenter risk index for atrial fibrillation after cardiac surgery. JAMA 2004; 291: 1720–1729.
- 34.
Korantzopoulos P, Kolettis TM, Galaris D, Goudevenos JA. The role of oxidative stress in the pathogenesis and perpetuation of atrial fibrillation. Int J Cardiol 2007; 115: 135–143.
- 35.
Endoh Y, Endoh I, Geczy C, Nakagomi A, Kusama Y, Atarashi H. Inflammation and atrial fibrillation. J Arrhythmia 2011; 27: 106–115.
- 36.
Guo Y, Lip GY, Apostolakis S. Inflammation in atrial fibrillation. J Am Coll Cardiol 2012; 60: 2263–2270.
- 37.
Bradley D, Creswell LL, Hogue CW Jr, Epstein AE, Prystowsky EN, Daoud EG; American College of Chest Physicians. Pharmacologic prophylaxis: American College of Chest Physicians guidelines for the prevention and management of postoperative atrial fibrillation after cardiac surgery. Chest 2005; 128 (2 Suppl): 39S–47S.
- 38.
Sezai A, Shiono M. Atrial fibrillation after cardiac surgery. Circ J 2013; 77: 2244–2245.