Abstract
Background:
Management of cardiac amyloidosis (CA) is related to amyloid deposition. Our aim was to assess the effect of amyloid deposition on myocardial function.
Methods and Results:
Twenty-eight patients with transthyretin mutation and a group of 14 controls underwent echocardiography to quantify left ventricular (LV) dimensions, function, and global (G) longitudinal (L), radial (R) and circumferential (C) strain (S). 99mTc-3,3-diphosphono-1,2-propanodicarboxylic-acid-scintigraphy (99mTc-DPD) was used to quantify CA. 99mTc-DPD revealed accumulation in 14/28 patients (CA group) and no accumulation (no-CA group) in 14. Cardiac accumulation was lower-than-bone uptake in 5 (mild-CA group) and higher-than-bone uptake in 9 (severe-CA group). Ejection fraction was similar among groups. GLS was lower (P<0.001) in the severe-CA group (−12.2±4.5) with respect to the no-CA group (−19.3±3.0) and to the control group (−20.9±2.5). Conversely, GCS and GRS were lower (P<0.05) in the mild-CA group (−10.8±4.1 and 9.5±5.7, respectively) with respect to the severe-CA group (−18.9±5.1 and 23.9±6.3 respectively), no-CA group (−19.2±4.1 and 28.4±10.2, respectively) and the control group (−23.9±4.4 and 29.9±8.7, respectively). A correlation was found between the scintigraphic heart retention index (HRI) and LV septal thickness (ρ=0.72), E/E’ (ρ=0.46) and GLS (ρ=−0.40).
Conclusions:
Myocardial deformation is impaired in a different stage of CA. The 99mTc-DPD HRI correlated well with morphologic, diastolic and strain abnormalities. (Circ J 2016; 80: 1998–2003)
Cardiac amyloidosis (CA) is a rare hypertrophic secondary cardiomyopathy caused by myocardial extracellular deposition of fibrillar anomalous proteins called “amyloid”.1,2
There are many subtypes of amyloidosis, but the 3 most frequent systemic amyloidoses are: (1) acquired monoclonal immunoglobulin light chain amyloidosis (AL); (2) wild-type (non-mutant) transthyretin (TTR) – related systemic “senile” amyloidosis; and (3) a rare autosomal dominant disease, caused by a mutation of the gene coding for TTR, called familial amyloidotic polyneuropathy (FAP).2–4
Although there is great variability depending on the TTR variant, the clinical course of CA is strongly related to amyloid deposition and its effect on myocardial function. The clinical course of CA has 3 stages: (1) a “subclinical” stage related to initial amyloid deposition causing mild left ventricular (LV) wall thickening (<15 mm) and impairment of only LV longitudinal function; (2) a “typical” stage caused by marked thickening of the LV wall (>15 mm) and heart failure with preserved systolic function; (3) a “final” stage (end-stage) with systolic and diastolic dysfunction and arrhythmias.5
Of the cardiac imaging techniques, 99mTc-3,3-diphosphono-1,2 propanodicarboxylic acid scintigraphy (99mTc-DPD) has demonstrated high accuracy in direct identification of amyloid deposition in the myocardium of patients with TTR-related amyloidosis (senile amyloidosis and FAP), allowing early and accurate diagnosis of the disease.6–8
Recently, in patients with senile TTR CA, a semiquantitative assessment of 99mTc-diphosphonate retention both identified different degrees of amyloid deposition and showed high correlation with many echocardiographic parameters such as interventricular septal thickness and global longitudinal function.9
Although many echocardiographic studies have investigated myocardial deformation (longitudinal, circumferential and radial) in CA,10–12
to the best of our knowledge, no study exists correlating LV amyloid deposition in TTR-FAP CA (as determined by semiquantitative evaluation of 99mTc-DPD scans) and myocardial deformation.
The main aim of our study was therefore to assess the effect of amyloid deposition detected by 99mTc-DPD on diastolic function, N-terminal pro B-type natriuretic peptide values (BNP) and myocardial deformation detected by strain echocardiography in FAP patients with different degrees of amyloid deposition.
Methods
We included 38 patients from 7 unrelated families with TTR mutation followed at the Department of Neurosciences (University Hospital “G. Martino”, Messina, Italy). The study was approved by the institutional review committee and informed consent was given by all patients. Diagnosis was based on genetic testing for TTR-FAP: the Glu89Gln mutation was detected in 21 patients, the Phe64Leu mutation was detected in 13 patients, and the Thr49Ala mutation was detected in 4 patients. None of the included patients had evidence of monoclonal protein in the serum or urine or a monoclonal population of plasma cells in the bone marrow or other diseases that could be responsible for secondary amyloidosis. Of these 38 patients, 2 were excluded because of a previous myocardial infarction and 8 patients refused 99mTc-DPD scans. All of the remaining 28 patients (9 men, 19 women; mean age, 50±14 years) underwent, on the same day, the following examinations: BNP dosage, 2D Doppler and strain echocardiography, and a 99mTc-DPD scan. At enrolment, all patients were in class I or II according to the New York Heart Association (NYHA) classification and none had a clinical history of previous cardiac disease. Furthermore, we enrolled 14 asymptomatic normal subjects (5 men, 9 women, mean age: 48±9 years) without previous history of heart disease, who had undergone 2D Doppler and strain echocardiography, as the control group.
Echocardiography Data Acquisition and Analysis
Standard echocardiographic examinations were performed in all patients using a commercial ultrasound machine (My Lab ALPHA, Esaote, Florence, Italy) equipped with a 2.5-MHz phased-array transducer. Parasternal short-axis views at the basal, mid and apical levels and 3 standard apical views (4-chamber, 2-chamber and LV outflow long-axis) were acquired. All examinations were performed by the same cardiologist. The diastolic value of the LV anterior septal thickness (LVST), posterior wall thickness, LV volumes [end-diastolic volume (EDV) and end-systolic volume (ESV)], and ejection fraction (EF) were measured according to the recommendations of the American Society for Echocardiography.13
LV mass was calculated using the Devereux formula. LV diastolic function was quantified by the ratio between the E-wave velocity of the pulsed-wave Doppler mitral flow image and the early diastolic velocity of the septum at the mitral annulus level (E’ wave) on tissue Doppler imaging (TDI).14
A 16-segment model was used to divide the LV.13
As previously tested,15–17
a dedicated software package for 2D speckle-tracking echocardiography (2DSTE) (XStrainTM, Esaote) was used for offline quantification of longitudinal strain on the 4- and 2-chamber apical views and of circumferential and radial strain on the basal, mid and apical short-axis views. Global longitudinal strain (GLS) was calculated as the average longitudinal strain of 12 segments on apical views, while global circumferential strain (GCS) and global radial strain (GRS) were calculated as the average of circumferential and radial strain of 16 segments on short-axis views.12
99mTc-DPD Data Acquisition and Analysis
Whole-body scans (anterior and posterior projections) were obtained using a dual-headed gamma camera (MillenniumVG, GE Healthcare, Milwaukee, WI, USA) equipped with low-energy, high-resolution collimators at 5 min and then 3 h after intravenous injection of 740MBq of 99mTc-DPD.
The whole-body scans were visually evaluated by consensus of 2 nuclear medicine physicians experienced in searching for cardiac radiotracer accumulation;6–9
readers were blinded to BNP and echocardiographic data.
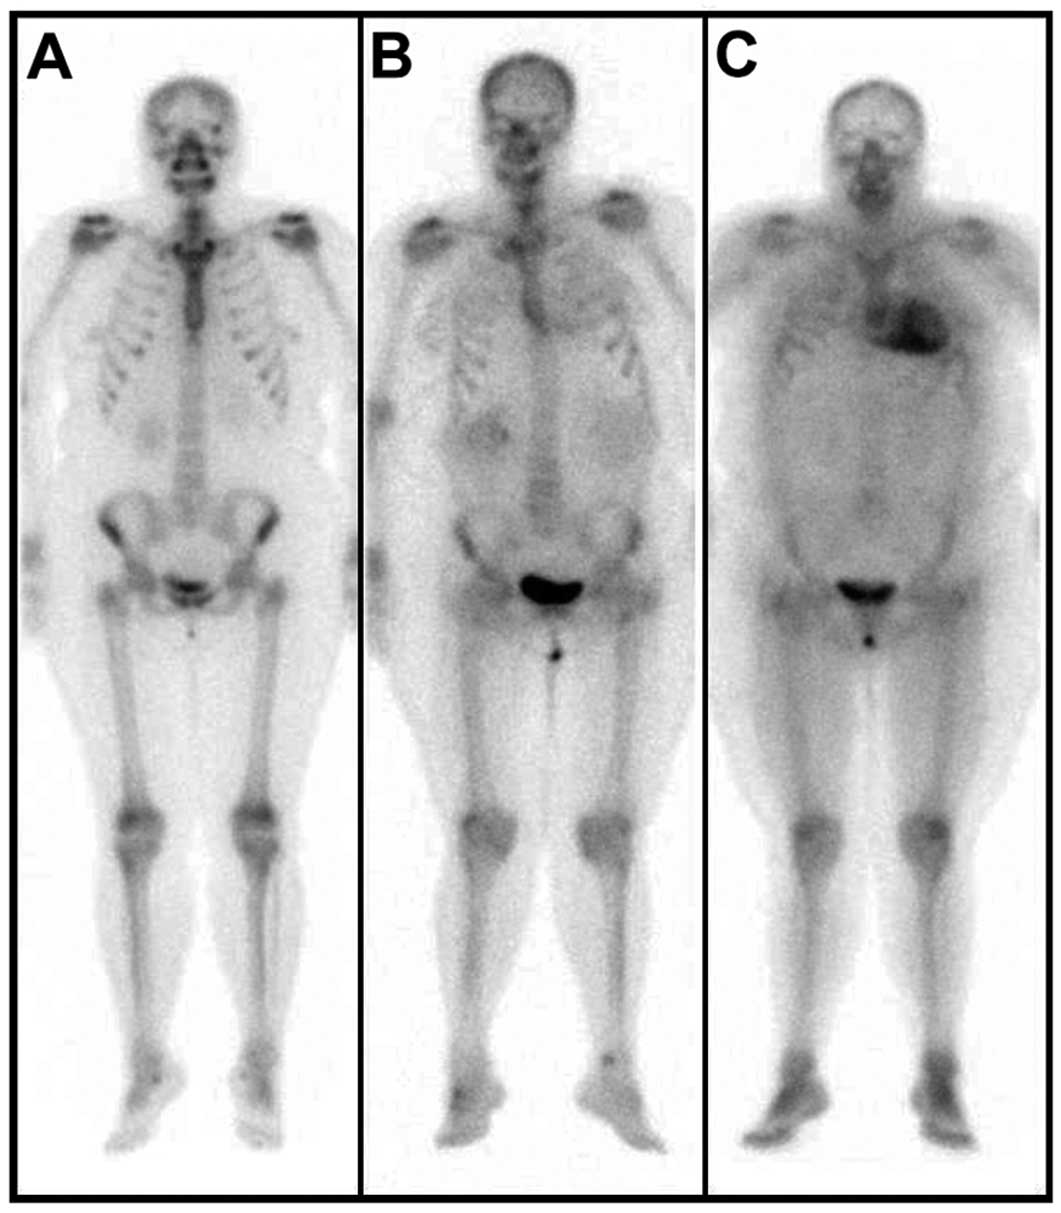
Readers evaluated the eventual presence of cardiac radiotracer accumulation, grading it as follows: grade 0, absent cardiac uptake and normal bone uptake; grade 1, mild cardiac uptake, inferior to bone uptake; grade 2, moderate cardiac uptake equal to bone uptake; grade 3, intense (ie, severe) cardiac uptake superior to bone uptake (Figure 1).
Moreover, a semiquantitative evaluation was performed. Rectangular regions of interest were placed over the heart on the first (5-min) scan and copied to the images obtained 3 h after injection. Total registered counts in the whole-body region of interest at 5 min after injection were assumed to represent total injected activity; counts in the heart region of interest at 3 h after injection were normalized for scan speed and decay corrected and compared with whole-body counts at 5 min, indicating the relative percentage of tracer heart retention (HR). Moreover, the heart-to-whole-body (H/WB) ratio was obtained by dividing counts in the heart by whole-body counts in late images.18–20
Plasma BNP Measurements
Plasma samples for BNP measurement were collected on the same day of ECG, echocardiography and 99mTc-DPD while subjects were in a fasting state. Plasma BNP levels were measured using a validated and commercially available immunoassay kit (Perkin Elmer, MA, USA).21
Statistical Analysis
Quantitative data are expressed as mean±standard deviation, qualitative data as frequency and percentage. The one-sample Kolmogorov-Smirnov test was applied to test the normal distribution of values.
The strength of correlation between variables was assessed by Pearson coefficient (R). The difference among groups in average values of each parameter was tested by analysis of variance (ANOVA) or Welch ANOVA when variances were not equal by Levene’s test. For skewed variables, the difference between median values of each group was tested by the Kruskal-Wallis nonparametric test. Post-hoc tests were conducted using Bonferroni’s correction of significance.
Inter and intra-observer variabilities were assessed using the Bland-Altman method in 15 patients.
P<0.05 was considered to be statistically significant. All tests were two-tailed. Statistical analyses were carried out using JMP statistical software (version 4.0.0; SAS Institute Inc, Cary, NC, USA) and MedCalc 6.00.014 (MedCalc Software, Mariakerke, Belgium).
Results
99mTc-DPD WB scans revealed radiotracer accumulation in 14 of 28 patients (50%) and no cardiac radiotracer accumulation (no cardiac amyloidosis group: no-CA group) in the remaining 14 patients (50%). Cardiac accumulation was mild in 5 patients (mild-CA group) and severe in 9 patients (severe-CA group). No patients showed moderate cardiac uptake.
Clinical Features and BNP Level
The age (P=0.74) and sex (P=0.25) of patients in the groups were similar. BNP values were found to be not normally distributed; a log10 transformation was performed and BNP values were then normally distributed, which is in accordance with previous data.22
Log10-transformed BNP values were significantly higher (adj. P=0.02) in the severe-CA group (2.4±0.9) than in the no-CA group (1.7±0.4).
Echocardiographic Findings
Echocardiographic findings in the different groups are reported in the
Table.
Table.
Echocardiographic Findings in the Control Group and in Patients Assessed for Cardiac Amyloidosis (CA) by
99mTc-DPD Scans
| |
Control group
(n=14) |
No CA group
(n=14) |
Mild CA group
(n=5) |
Severe CA group
(n=9) |
P value |
| HR |
|
3.2±0.5* |
3.6±0.45* |
5±1.47 |
0.001** |
| H/WB |
|
5±0.6* |
5.2±0.65* |
6.9±1.6 |
0.002** |
| LV septal thickness (mm) |
9.5±1.2* |
10.3±1.7* |
12.0±2.8 |
16.0±3.6 |
<0.001** |
| LV inferolateral wall thickness (mm) |
8.8±1.1* |
9.1±1.7* |
10.2±0.4 |
13.6±2.8 |
<0.001** |
| LVEDV (ml) |
75.6±15.3 |
78.5±17.6 |
108.8±54.2 |
79.4±22.9 |
0.58 |
| LVESV (ml) |
27.1±6.3 |
29.0±9.0 |
40.5±26.3 |
35.0±15.8 |
0.69 |
| LVEF (%) |
64.6±4.3 |
62.6±7.1 |
65.6±7.6 |
61.1±10.4 |
0.65 |
| LV mass (g) |
117.2±25.4* |
143.1±33.5* |
221.6±57.6* |
316.0±106.7 |
<0.001** |
| E/E’ ratio |
6.0±1.1* |
4.9±1.4* |
5.1±1.9* |
11.7±4.6 |
<0.001** |
*Adjusted P<0.05 vs. severe-CA group. **Indicated statistical significance. EDV, end-diastolic volume; E/E’ ratio, diastolic dysfunction; EF, ejection fraction; ESV, end-systolic volume; HR, heart retention; LV, left ventricular; WB, whole body.
The severe-CA group showed higher values for anterior septal thickness, posterior wall thickness and of E/E’ than the no-CA group and the control group (adj. P<0.05,
Table). LV mass was higher in the severe-CA group with respect to the no-CA group (adj. P=0.01). EDV and ESV were higher, but still within normal ranges, in the mild-CA group with respect to the other groups. EF was similar among groups (P=0.65).
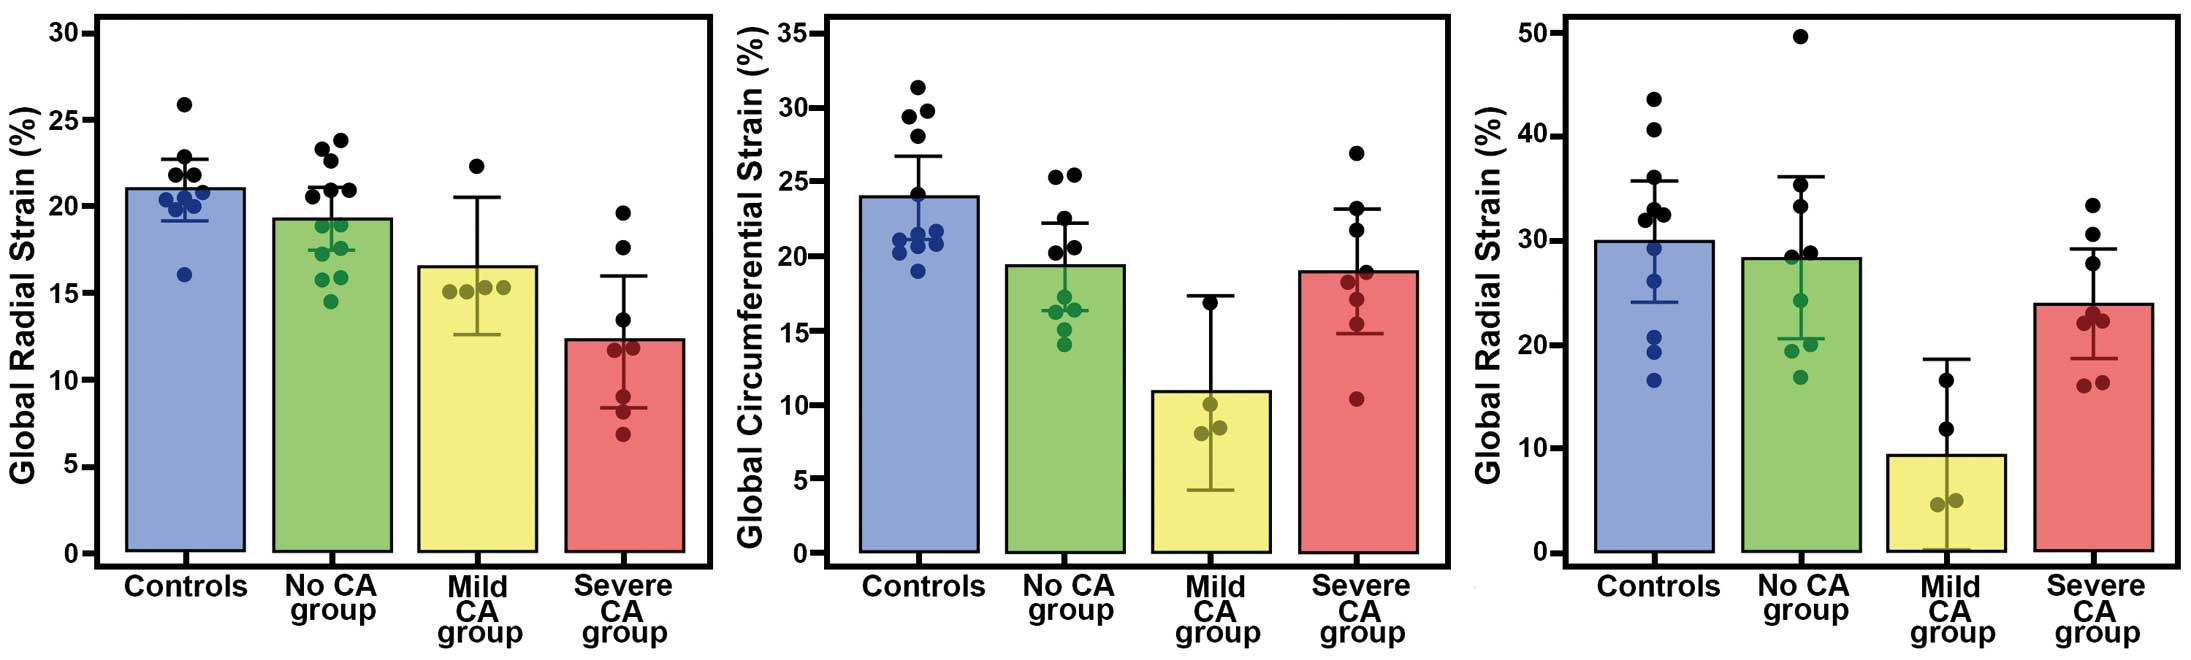
GLS was lower (adj. P≤0.001) in the severe-CA group (−12.2±4.5) with respect to the no-CA group (−19.3±3.0) and to the control group (−20.9±2.5), while a trend without a statistically significant difference (adj. P=0.12) was found between the no-CA and the mild-CA groups (−16.6±3.2) and between the mild-CA and the severe-CA groups (Figure 2).
GCS was lower in the mild-CA group (−10.8±4.1) with respect to the severe-CA group (−18.9±5.1, adj. P=0.03), the no-CA group (−19.2±4.1; adj. P=0.02) and the control group (−23.9±4.4; adj. P<0.001), while no statistically significant difference was found between the no-CA and the severe-CA groups (adj. P=0.99) (Figure 2).
Similarly, GRS was lower in the mild-CA group (9.5±5.7) with respect to the severe-CA group (23.9±6.3, adj. P=0.05), the no-CA group (28.4±10.2; adj. P=0.005) and the control group (29.9±8.7, adj. P=0.001), while no statistically significant difference was found between the no-CA and the severe-CA groups (adj. P=0.79) (Figure 2).
Correlation Between Semiquantitative 99mTc-DPD Indexes and Echocardiographic Findings
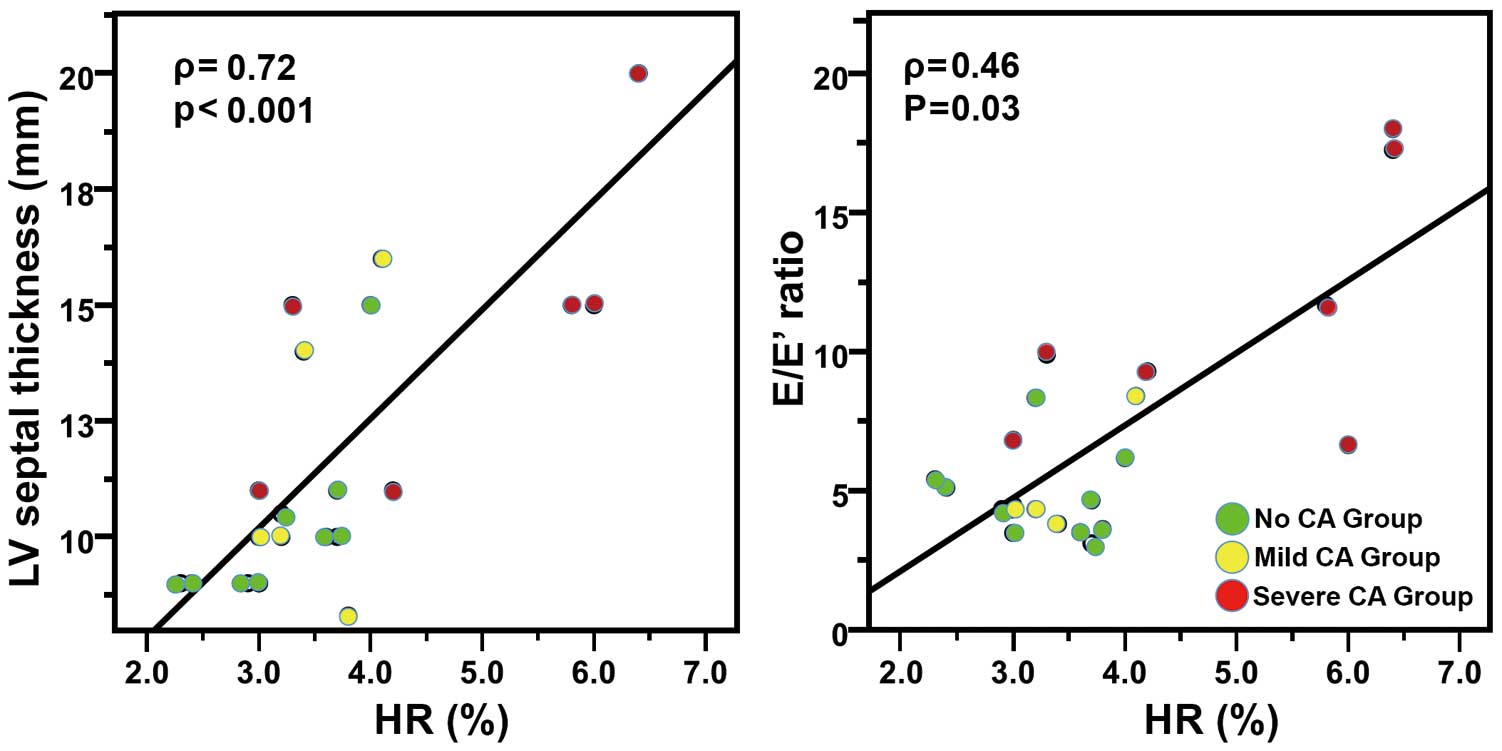
A statistically significant correlation was found between the HR and LVST (ρ=0.72; P<0.001) and E/E’ (ρ=0.46; P=0.03) (Figure 3). An inverse tendency was observed between HR and GLS (ρ=−0.40; P=0.06), while there was a positive trend between HR and BNP values (ρ=0.38; P=0.08). There was no correlation between HR and GCS (ρ=−0.11; P=0.67) and GRS (ρ=−0.26; P=0.30).
H/WB was positively associated with LVST (ρ=0.51; P=0.01). No significant correlations were found between H/WB and other echocardiographic parameters (all P>0.05).
Reproducibility
There was good interobserver agreement concerning longitudinal (mean –1%, SD 3.4), circumferential (mean 2.2%, SD 3.1) and radial strain (mean −1.3%, SD 5.3). Intra-observer agreement of longitudinal (mean 1%, SD 3.5), circumferential (mean 1.5%, SD 2.8) and radial strain (mean 1.3 %, SD 3.9) was also good.
Discussion
To the best of our knowledge, this is the first study relating the degree of cardiac amyloid deposition as assessed by 99mTc-DPD scans (a very sensitive imaging modality for TTR-related amyloidosis19,20) with BNP values and strain echocardiographic data in familial TTR-related amyloidosis patients. The main results of the present study are: (1) LVST was strongly related to the degree of cardiac amyloid deposition; (2) LV longitudinal function decreased with increasing amyloid deposition while circumferential and radial deformations were lower in patients with mild CA than in patients with severe CA; (3) diastolic function was related to the degree of cardiac amyloid deposition but was impaired only in severe CA; (4) and, finally, BNP values significantly increased only in severe CA. Interestingly, these results were obtained in patients without regional contractile dysfunction, with normal EF and in NYHA class I–II; therefore, no end-stage CA patients were enrolled in our population. Early timing of the examination may explain the low incidence of cardiac 99mTc-DPD uptake in our series.
Many studies have shown that septal LV wall thickness on echocardiography is the main parameter for identifying the degree of cardiac amyloid deposition.23,24
Our data also confirmed this ability of LVST when it is compared with other, more complex echocardiographic parameters such as diastolic function from TDI and GLS by 2D strain echocardiography.
Recently, in a study enrolling senile CA patients, Kristen et al9
showed that the scintigraphic HR index can quantify the severity of cardiac amyloid deposition because it is related to impaired longitudinal function and the thickness of the interventricular septum. According to these findings, we observed that when amyloid deposition increased, a worsening of longitudinal function occurred. We used strain echocardiography to quantify not only longitudinal strain, but also circumferential and radial deformations in FAP patients, which is different from the previous study,9
which quantified only longitudinal function by mitral annular plane systolic excursion.
We showed that circumferential and radial deformations decreased with mild amyloid deposition and increased with severe amyloid deposition; these results could be related to a compensatory phenomenon. The effects of amyloid deposition on myocardial deformation can be related to the entity of amyloid deposition and its transmural localization. The subendocardium has a pivotal role in longitudinal function because myocardial fibers are predominantly longitudinal in this region.22,25
Many studies, using biopsy and cardiac magnetic resonance imaging, had shown that amyloidotic deposition occurs from the endocardium to the epicardium.26,27
We think that increasing amyloid deposition in the endocardial layer determines the progressive longitudinal dysfunction, while at the same time, radial and circumferential deformations increase as a compensatory phenomenon. In fact, absent or reduced amyloid deposition in the LV mid-wall is related to the development of compensatory circumferential and radial function to maintain normal EF in the early phase of CA.
The compensatory nature of this phenomenon also is confirmed using the mathematical model of Maciver and Townsend,28
which shows that when long-axis function is already markedly impaired there is an increase of radial function to maintain preserved EF.
Additionally, in the mild-CA group there was an elevation (with no statistically significant difference) of EDV with respect to the other groups. The mechanism underlying the increased EDV (although in the normal range and with no statistically significant difference to the other groups) and the impaired longitudinal, circumferential and radial function observed in the mild-CA group is unclear. However, Nakai et al reported the same findings (impaired longitudinal, circumferential, and radial strain and increased EDV) observed in our mild-CA group in their group of asymptomatic diabetic patients.29
Our echocardiographic findings of abnormalities of myocardial deformation in the different stages of CA could be used for staging, patient management and therapy evaluation. Because strain echocardiography imaging is widely available and does not use ionizing radiation, serial echocardiographic imaging could be used to detect and follow cardiac amyloidosis patients.
On 99mTc-DPD scan, diastolic dysfunction (E/E’) was mildly impaired only in patients with severe amyloid deposition; the mean E/E’ value was within normal ranges in both the mild- and no-CA groups. The absence of severe diastolic dysfunction is linked to the fact that no end-stage CA patients were enrolled in our series; thus, the ventricular restrictive pattern was not fully developed in them.28
Furthermore, the elevation of BNP values only in patients with severe amyloid deposition confirms that mild amyloid deposition on 99mTc-DPD scan is a very early finding.30
Study Limitations
A major limitation of our study was the small number of patients, particularly in the mild-CA group. However, the disease is very rare. Another major weakness was the lack of cardiac biopsy specimens available for histopathologic analysis. However, this analysis had not been proposed in our asymptomatic patients. Nevertheless, the existence of previous studies of the histopathologic changes in CA allows us to hypothesize reliably on the pathologic abnormalities that may correlate with and explain the imaging findings.31,32
In this regard, it is noteworthy that 99mTc-DPD can be considered the standard noninvasive technique for CA diagnosis. Finally, we did not perform T-1 mapping, which has been shown to be accurate in detecting interstitial CA deposition.33
Conclusions
99mTc-DPD HR displays the extent of cardiac amyloid deposition because it correlates well with BNP values, morphologic echocardiographic parameters such as LV septal thickness, and diastolic (E/E’) and systolic (longitudinal) dysfunction in patients with CA and preserved EF. LV longitudinal function decreases with increasing amyloid deposition, while circumferential and radial deformations increase with severe cardiac deposition as a compensatory phenomenon. These findings might be of help in detecting early cardiac amyloidosis without using ionizing radiation; namely, for surveillance of patients with TTR mutation. Further studies in a larger sample of patients are needed to confirm our results.
Acknowledgments
The authors gratefully acknowledge Susan Nord and Jennifer Pfaff of Aurora Cardiovascular Services, Aurora St. Luke’s Medical Center for editorial preparation of the manuscript, Brian Miller and Brian Schurrer of Aurora Research Institute for help with the figures, and Stefano Pedri for his critical suggestion on echocardiographic analysis.
Conflicts of Interest
None.
References
- 1.
Merlini G, Seldin DC, Gertz MA. Amyloidosis: Pathogenesis and new therapeutic options. J Clin Oncol 2011; 29: 1924–1933.
- 2.
Sipe JD, Benson MD, Buxbaum JN, Ikeda S, Merlini G, Saraiva MJ, et al. Amyloid fibril protein nomenclature: 2010 recommendations from the nomenclature committee of the International Society of Amyloidosis. Amyloid 2010; 17: 101–104.
- 3.
Russo M, Mazzeo A, Stancanelli C, Di Leo R, Gentile L, Di Bella G, et al. Transthyretin-related familial amyloidotic polyneuropathy: Description of a cohort of patients with Leu64 mutation and late onset. J Periph Nerv Syst 2012; 17: 385–390.
- 4.
Mazzeo A, Russo M, Di Bella G, Minutoli F, Stancanelli C, Fentile L, et al. Transthyretin-related familial amyloid polyneuropathy (TTR-FAP): A single-center experience in Sicily, an Italian endemic area. J Neuromusc Dis 2015; 2: 539–548.
- 5.
Di Bella G, Pizzino F, Minutoli F, Zito C, Donato R, Dattilo G, et al. The mosaic of the cardiac amyloidosis diagnosis: Role of imaging in subtypes and stages of the disease. Eur Heart J Cardiovasc Imaging 2014; 15: 1307–1315.
- 6.
Rapezzi C, Quarta CC, Guidalotti PL, Longhi S, Pettinato C, Leone O, et al. Usefulness and limitations of 99 mTc-3,3-diphosphono-1,2-propanodicarboxylic acid scintigraphy in the aetiological diagnosis of amyloidotic cardiomyopathy. Eur J Nucl Med Mol Imaging 2011; 38: 470–478.
- 7.
Minutoli F, Di Bella G, Sindoni A, Vita G, Baldari S. Effectiveness of skeletal scintigraphy in transthyretin-related amyloidosis. Int J Cardiol 2013; 168: 4988–4989.
- 8.
Minutoli F, Di Bella G, Mazzeo A, Donato R, Russo M, Scribano E, et al. Comparison between (99 m)Tc-diphosphonate imaging and MRI with late gadolinium enhancement in evaluating cardiac involvement in patients with transthyretin familial amyloid polyneuropathy. Am J Roentgenol 2013; 200: W256–W265.
- 9.
Kristen AV, Haufe S, Schonland SO, Hegenbart U, Schnabel PA, Röcken C, et al. Skeletal scintigraphy indicates disease severity of cardiac involvement in patients with senile systemic amyloidosis. Int J Cardiol 2013; 164: 179–184.
- 10.
Koyama J, Ikeda S, Ikeda U. Echocardiographic assessment of the cardiac amyloidoses. Circ J 2015; 79: 721–734.
- 11.
Sun JP, Stewart WJ, Yang XS, Donnell RO, Leon AR, Felner JM, et al. Differentiation of hypertrophic cardiomyopathy and cardiac amyloidosis from other causes of ventricular wall thickening by two-dimensional strain imaging echocardiography. Am J Cardiol 2009; 103: 411–415.
- 12.
Di Bella G, Minutoli F, Pingitore A, Zito C, Mazzeo A, Aquaro GD, et al. Endocardial and epicardial deformations in cardiac amyloidosis and hypertrophic cardiomyopathy. Circ J 2011; 75: 1200–1208.
- 13.
Lang RM, Bierig M, Devereux RB, Flachskampf FA, Foster E, Pellikka PA, et al. Recommendations for chamber quantification: A report from the American Society of Echocardiography’s Guidelines and Standards Committee and the Chamber Quantification Writing Group, developed in conjunction with the European Association of Echocardiography, a branch of the European Society of Cardiology. J Am Soc Echocardiogr 2005; 18: 1440–1463.
- 14.
Nagueh SF, Middleton KJ, Kopelen HA, Zoghbi WA, Quiñones MA. Doppler tissue imaging: A noninvasive technique for evaluation of left ventricular relaxation and estimation of filling pressures. J Am Coll Cardiol 1997; 30: 1527–1533.
- 15.
Thomas JD, Badano LP. EACVI-ASE-Industry initiative to standardize deformation imaging: A brief update from the co-chairs. Eur Heart J Cardiovasc Imaging 2013; 14: 1039–1040.
- 16.
D’hooge J, Barbosa D, Gao H, Claus P, Prater D, Hamilton J, et al. Two-dimensional speckle tracking echocardiography: Standardization efforts based on synthetic ultrasound data. Eur Heart J Cardiovasc Imaging 2016; 17: 693–701.
- 17.
Farsalinos KE, Daraban AM, Ünlü S, Thomas JD, Badano LP, Voigt JU. Head-to-head comparison of global longitudinal strain measurements among nine different vendors: The EACVI/ASE Inter-Vendor Comparison Study. J Am Soc Echocardiogr 2015; 28: 1171–1181.
- 18.
Perugini E, Guidalotti PL, Salvi F, Cooke RM, Pettinato C, Riva L, et al. Noninvasive etiologic diagnosis of cardiac amyloidosis using 99 mTc-3,3-diphosphono-1,2-propanodicarboxylic acid scintigraphy. J Am Coll Cardiol 2005; 46: 1076–1084.
- 19.
Bokhari S, Castaño A, Pozniakoff T, Deslisle S, Latif F, Maurer MS. (99 m)Tc-pyrophosphate scintigraphy for differentiating light-chain cardiac amyloidosis from the transthyretin-related familial and senile cardiac amyloidoses. Circ Cardiovasc Imaging 2013; 6: 195–201.
- 20.
Bokhari S, Shahzad R, Castaño A, Maurer MS. Nuclear imaging modalities for cardiac amyloidosis. J Nucl Cardiol 2014; 21: 175–184.
- 21.
Schou M, Gustafsson F, Kjaer A, Hildebrandt PR. Long-term clinical variation of NT-proBNP in stable chronic heart failure patients. Eur Heart J 2007; 28: 177–182.
- 22.
Banypersad SM, Moon JC, Whelan C, Hawkins PN, Wechalekar AD. Updates in cardiac amyloidosis: A review. J Am Heart Assoc 2012; 1: e000364, doi:10.1161/JAHA.111.000364.
- 23.
Tsang W, Lang RM. Echocardiographic evaluation of cardiac amyloid. Curr Cardiol Rep 2010; 12: 272–276.
- 24.
Bogaert J, Rademakers FE. Regional nonuniformity of normal adult human left ventricle. Am J Physiol Heart Circ Physiol 2001; 280: H610–H620.
- 25.
Di Bella G, Gaeta M, Pingitore A, Oreto G, Zito C, Minutoli F, et al. Myocardial deformation in acute myocarditis with normal left ventricular wall motion: A cardiac magnetic resonance and 2-dimensional strain echocardiographic study. Circ J 2010; 74: 1205–1213.
- 26.
Vogelsberg H, Mahrholdt H, Deluigi CC, Yilmaz A, Kispert EM, Greulich S, et al. Cardiovascular magnetic resonance in clinically suspected cardiac amyloidosis: Noninvasive imaging compared to endomyocardial biopsy. J Am Coll Cardiol 2008; 51: 1022–1030.
- 27.
Di Bella G, Minutoli F, Mazzeo A, Vita G, Oreto G, Carerj S, et al. MRI of cardiac involvement in transthyretin familial amyloid polyneuropathy. Am J Roentgenol 2010; 195: W394–W399.
- 28.
Maciver DH, Townsend M. A novel mechanism of heart failure with normal ejection fraction. Heart 2008; 94: 446–449.
- 29.
Nakai H, Takeuchi M, Nishikage T, Lang RM, Otsuji Y. Subclinical left ventricular dysfunction in asymptomatic diabetic patients assessed by two-dimensional speckle tracking echocardiography: Correlation with diabetic duration. Eur J Echocardiogr 2009; 10: 926–932.
- 30.
Palladini G, Campana C, Klersy C, Balduini A, Vadacca G, Perfetti V, et al. Serum N-terminal pro-brain natriuretic peptide is a sensitive marker of myocardial dysfunction in AL amyloidosis. Circulation 2003; 107: 2440–2445.
- 31.
Roberts WC, Waller BF. Cardiac amyloidosis causing cardiac dysfunction: Analysis of 54 necropsy patients. Am J Cardiol 1983; 52: 137–146.
- 32.
Little WC, Ohno M, Kitzman DW, Thomas JD, Cheng CP. Determination of left ventricular chamber stiffness from the time for deceleration of early left ventricular filling. Circulation 1995; 92: 1933–1939.
- 33.
Bulluck H, Maestrini V, Rosmini S, Abdel-Gadir A, Treibel TA, Castelletti S, et al. Myocardial T1 mapping. Circ J 2015; 79: 487–494.