Abstract
Background:
Detection of aortic aneurysm (AA) prior to rupture is crucial to decreasing its mortality. Towards this purpose, a novel detection algorithm was developed from pulse volume recording (PVR), analyzing the propagation loss of pulse waves caused by expansion of the aortic wall. The diagnostic ability of the algorithm was evaluated in this prospective study.
Methods and Results:
PVR were measured for 30 s using the oscillometric device designed for automatic measurement of the ankle-brachial index (ABI). The algorithm processed the data automatically and assessed whether the patient had an AA. CT angiography was used as the reference standard. Sensitivity and specificity of the algorithm were evaluated. A total of 152 AA patients, including 21 patients with thoracic AAs (TAA), and 64 non-aneurysm control subjects were enrolled. The mean diameter of all AAs was 47.2±10.3 mm. After measurements, 121 AA patients and 33 control subjects were judged by the algorithm as having or not having AAs, resulting in sensitivity of 80% and specificity of 52%. The sensitivity was higher for larger AAs. There was no sensitivity difference according to the location of the AA.
Conclusions:
The new diagnostic algorithm installed in the oscillometric device detected AAs with high sensitivity, especially larger aneurysms. For application as a screening tool, the specificity needs to be improved.
Rupture of an aortic aneurysm (AA) is a catastrophic condition, accounting for approximately 2% of the mortality rate in developed countries.1
Half of the patients die before reaching hospital2,3
and among those who reach the hospital alive, the mortality rate after emergency treatment ranges from 30% to 70%,3
with an overall mortality rate between 65% and 85%.4
In a series of patients with ruptured abdominal AA (AAA) who were managed in Scotland, three-quarters were unaware of having had the aneurysm before it ruptured, even though three-quarters of the entire study population had attended medical facilities in the preceding 5 years.5
On the other hand, if AAs are operated on an elective basis, the survival rate can be as high as 95%.6
Therefore, in order to prevent AA rupture, early diagnosis is of the utmost importance. Ultrasound has been the primary modality for AA screening because of its simplicity and high diagnostic value for AAA. Several randomized controlled trials have demonstrated that ultrasonographic screening can reduce the mortality rate of AA rupture by 30–42%,7,8
and this mortality reduction is substantially greater than achieved by any established cancer screening program.9
Despite its efficacy for screening of AAA, the drawback of using ultrasound is the difficulty of evaluating the entire aortic system, particularly thoracic AA (TAA) owing to intervening pulmonary air. The detection of TAA prior to rupture is crucial because the number of deaths from TAA rupture has been reported as higher than that for AAA.6,10
Chest X ray can be a primary method for detecting TAA, but can overlook it because of the difficulty in distinguishing it from overlying structures such as the esophagus or heart.
The ankle-brachial index (ABI) and pulse wave velocity (PWV) have been broadly used as screening parameters to detect peripheral arterial disease and assess the progression of atherosclerotic disease and the risk of cardiovascular death.11,12
The latest version of an automated oscillometric device, the form III-PWV/ABI (Omron Healthcare Co., Kyoto, Japan), has a pneumoplethysmograph, by which measurable changes in the lower limb volume with each cardiac cycle (i.e., pulse volume recording (PVR)) can be simultaneously obtained with the PWV and ABI, enabling an analysis of pulse transfer functions. It has been reported that AAs can alter the pulse transmission pattern because of the abrupt change in the diameter of the aorta. Negative correlation of the PWV and aortic diameter was demonstrated by Bailey et al,13
indicating the propagation loss of pulse waves by AAs. Sato et al also elucidated the PWV loss after the wave passed through a focally dilated tube in an experimental model and they proposed a method of detecting AAs by finding the transfer function from pulse waves measured at 2 points on the arms and legs.14–17
The pulse wave propagation loss in AAs was formulated as changes in impedance and PWV, characteristic of vessel diameter in elastic ducts.17
This formula was applied to develop a novel algorithm for the detection of AAs. In this study, the diagnostic ability of the algorithm for AA detection was prospectively evaluated for the first time.
Methods
Inclusion and Exclusion Criteria
Patients who had been referred to the department of radiology from January 2012 to July 2016 under the diagnosis or suspicion of having an AA or a common iliac artery aneurysm (CIAA) were recruited to this prospective study. Patients with aortic dissection or arterial stenosis affecting both legs were excluded because arterial stenoses might affect the pulse signals. Patients whose bilateral ABI was ≤0.90 were also excluded. Patients with arrhythmia or considerable involuntary body movement were also excluded. Informed consent was given by all subjects participating in the study, and the study was approved by the institutional review board. Patients undergoing CT angiography (CTA) for different purposes (i.e., staging for cancer) and confirmed not to have an AA were recruited as controls.
ABI, baPWV and PVR Measurements
The ABI, brachial-ankle PWV (baPWV) and PVR measurements were obtained simultaneously using an automated oscillometric device (form III-PWV/ABI, Omron Healthcare). This oscillometric method measures blood pressure by detecting the pulsation of the artery. As the pressure in the cuff is decreased slowly, the magnitude of the pressure oscillation in the cuff gradually increases and eventually reaches a peak. Cuff pressure when the oscillation increases rapidly is taken as the systolic pressure. To use the oscillometric device, ankle cuffs and brachial cuffs are wrapped around the prescribed points, allowing simultaneous measurement of systolic blood pressure in the 4 limbs. The measurements were performed by experienced vascular nurses, who were blinded to the clinical information, after patients spent at least 15 min resting supine in a waiting room. CTA and ABI measurements were performed within 3 months of each other.
Aneurysm Detection Algorithm
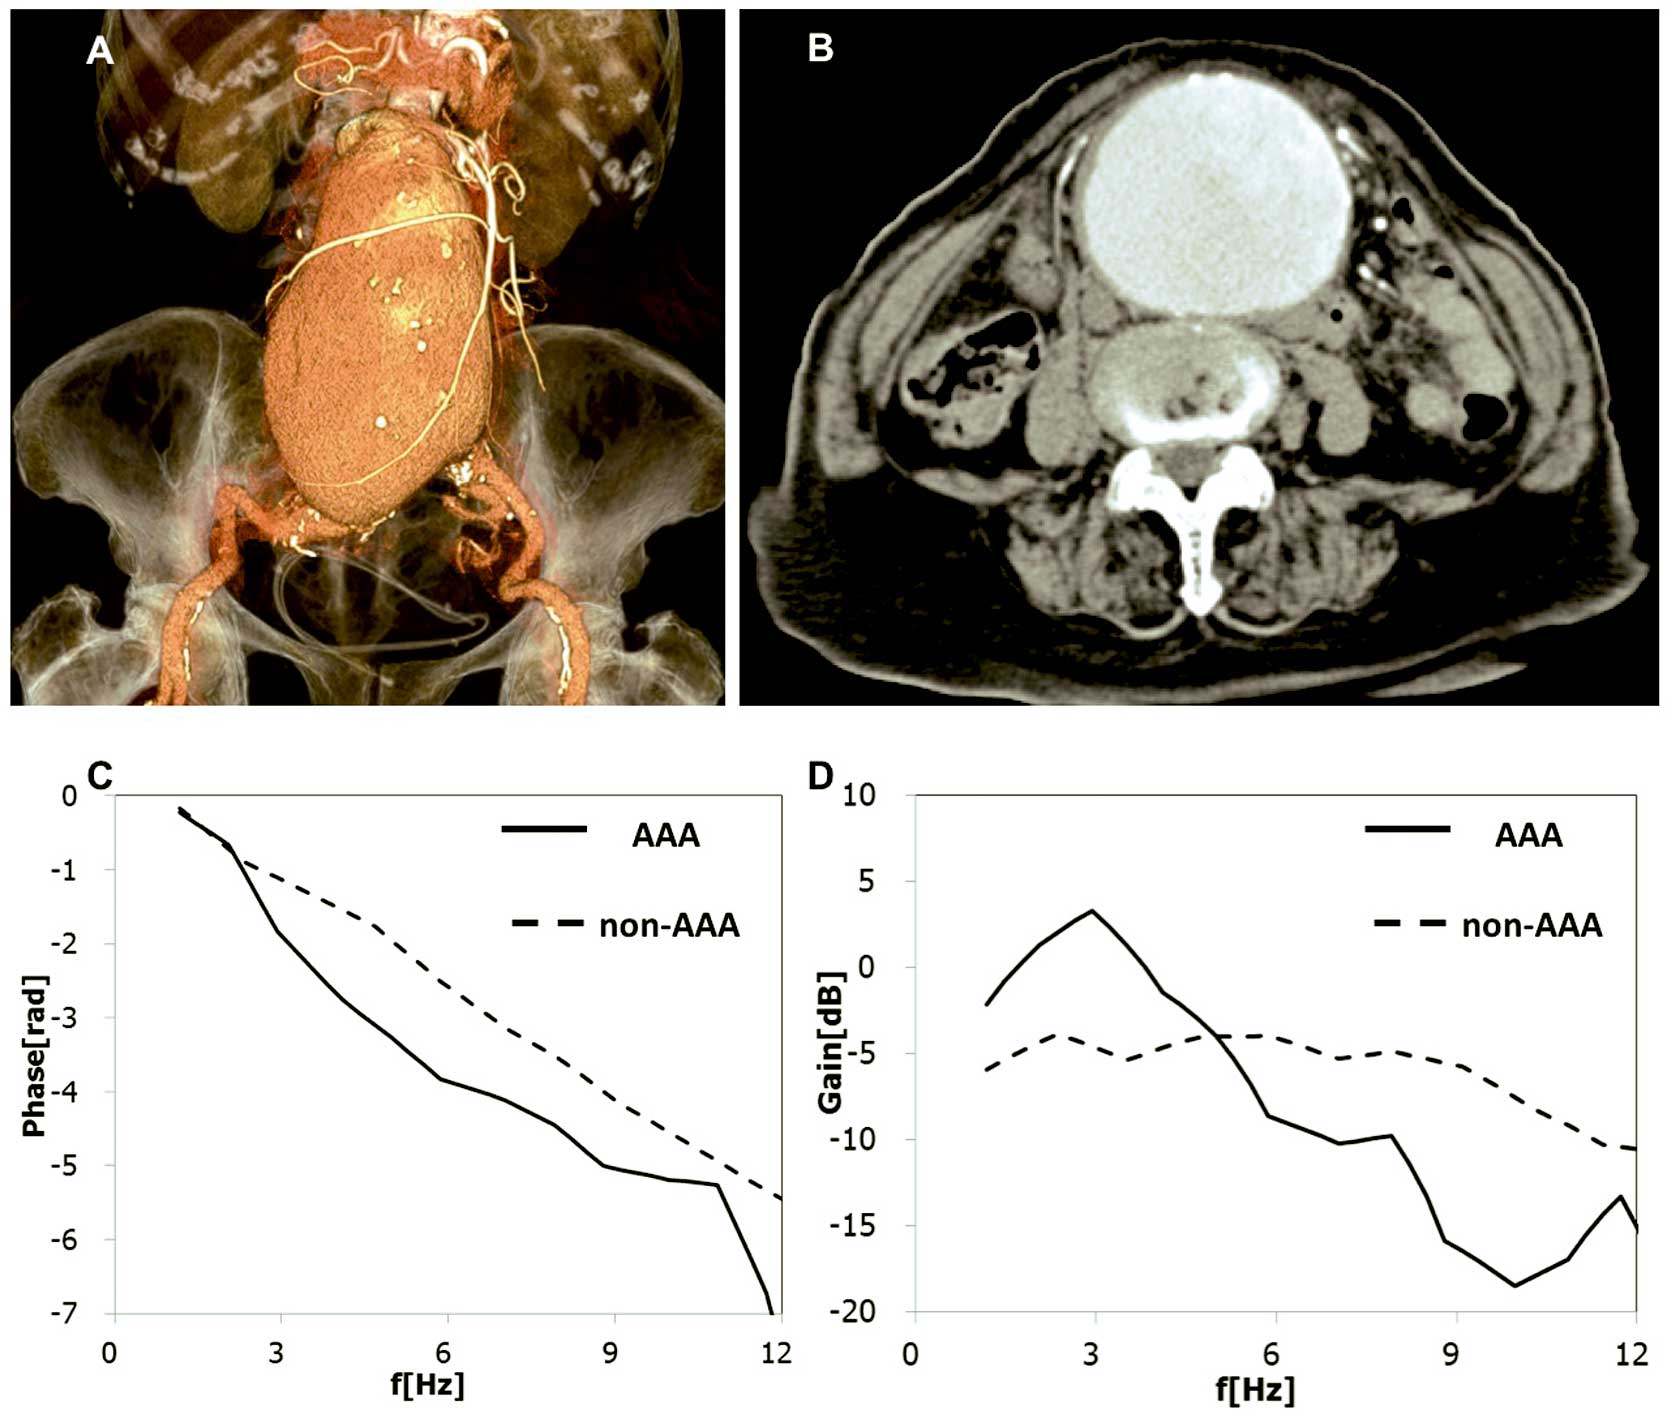
The decision tree model for aneurysm detection was based on the pulse wave signal transfer function obtained from a learning cohort involving 142 AAA patients and 195 healthy volunteers, using the oscillometric PWV/ABI device and described briefly as follows. PVR were recorded and stored for 30 s by the brachial and ankle cuffs under constant holding pressure. Pulse wave signals were divided into blocks for processing, minimizing the effect of fluctuation of the wave interval and amplitude. The 30-s recording resulted in a total of 16 blocks for processing. Gains and phases of the transfer functions between brachial and ankle PVR waveforms were calculated using fast Fourier transform. The phase diagrams obtained from the PVR waveforms were quantified and subsequently classified into 4 groups. Four parameters (parameter 1: the difference in baPWV on the phase diagram; parameter 2: the frequency with the maximum amplitude in the gain diagram; parameter 3: fundamental frequency in the gain diagram; parameter 4: the difference between actual baPWV measurements and estimated nomographic baPWV value) were utilized in addition to the phase diagram grouping, leading to an automated decision on whether or not the patient had an AA. Representative examples of the phase and gain diagram are shown in
Figure 1.
Data on patient demographics and the automated diagnosis judged by the algorithm were collected by one of the authors (T.H.), who had full access to all the data in this study and assumed complete responsibility for its integrity and data analysis.
Diagnosis of Aneurysms by CTA
Diagnosis of the AAs was made by CTA. CTA examinations were performed with a dual-source 64-slice CT scanner (Somatom Definition; Siemens Medical Solutions, Erlangen, Germany). The CTA protocol consisted of plain, arterial and venous phases encompassing the aortic arch to the lower extremity. A total of 100 mL of nonionic-iodinated contrast medium (IOPAMIRON 370 mg/mL; Bayer, Osaka, Japan) was administered at a flow rate of 4 mL/s via an antecubital vein, followed by injection of 50 mL of saline at a flow rate of 4 mL/s as a chaser. Arterial phase scanning was performed using a bolus-tracking technique. The arterial phase data acquisition was initiated 6 s after attenuation reached a predefined threshold of 120 Hounsfield units. Measurement of the aortic diameter on the contrast-enhanced CT images was performed by a single board-certified radiologist (SIc) with 14 years of experience in vascular imaging who was blinded to the patient’s clinical background. For the AA diameter, the minor axis of the maximal transaxial plane was measured. Aortic diameter ≥3 cm was defined as an AAA, ≥2.5 cm as CIAA, and ≥4 cm as TAA. If patients had multiple AAs, the diameter of the largest one was recorded. CTA was performed within 3 months before or after ABI measurements.
Parameters Investigated
Sensitivity and specificity for detection of AAs by the algorithm were evaluated.
Statistical Analysis
Data are shown as basic descriptive statistics, such as means and standard deviations for continuous variables, and proportions and frequencies for categorical variables. Between-group comparisons were made using contingency table analysis with chi-squared test or Fisher’s exact text (categorical variables), and statistically significant differences were determined using t-tests (continuous variables). Confidence intervals (CIs) of sensitivity and specificity were estimated using a normal distribution. If the sample size was small (n<75), exact confidence limits were shown. Statistical analyses were undertaken using the SPSS software version 20 (IBM, New York, NY, USA). The significance level was set at P<0.05.
Results
A total of 207 patients were diagnosed by CTA as having AAs. Among them, 41 patients were excluded from the analysis for the following reasons: bilateral ABI fell ≤0.90 in 19 patients, arterial stenosis ≥50% in both legs detected by CTA in 4 patients, history of bypass surgery or stent placement in aorta or peripheral arteries in 6 patients, and dissecting AAs in 12 patients. Therefore, 166 patients were evaluated by the oscillometric device. The aneurysm detection algorithm failed to analyze 28 of the 244 subjects (failure rate: 11.4%, 14 in 166 AA patients and 14 in 78 controls) for the following reasons: small pulse pressure of the ankle PVR (6 AA patients, 5 controls), irregular pulse (9 A patients, 5 controls), or both reasons (1 AA patient, 2 controls). Accordingly, the remaining 152 AA patients and 64 controls were enrolled in the analysis (Figure 2). The mean age of the AA patients and controls was 75.7±7.4 years and 71.3±8.5years, respectively. Prevalence of dyslipidemia and diabetes mellitus was higher among the AA patients. Among the 152 AA patients, 113 had AAA, 21 had TAA, and 18 had CIAA. The mean AA diameter in all cohorts was 47.2±10.3 mm. Detailed baseline clinical characteristics are shown in the
Table.
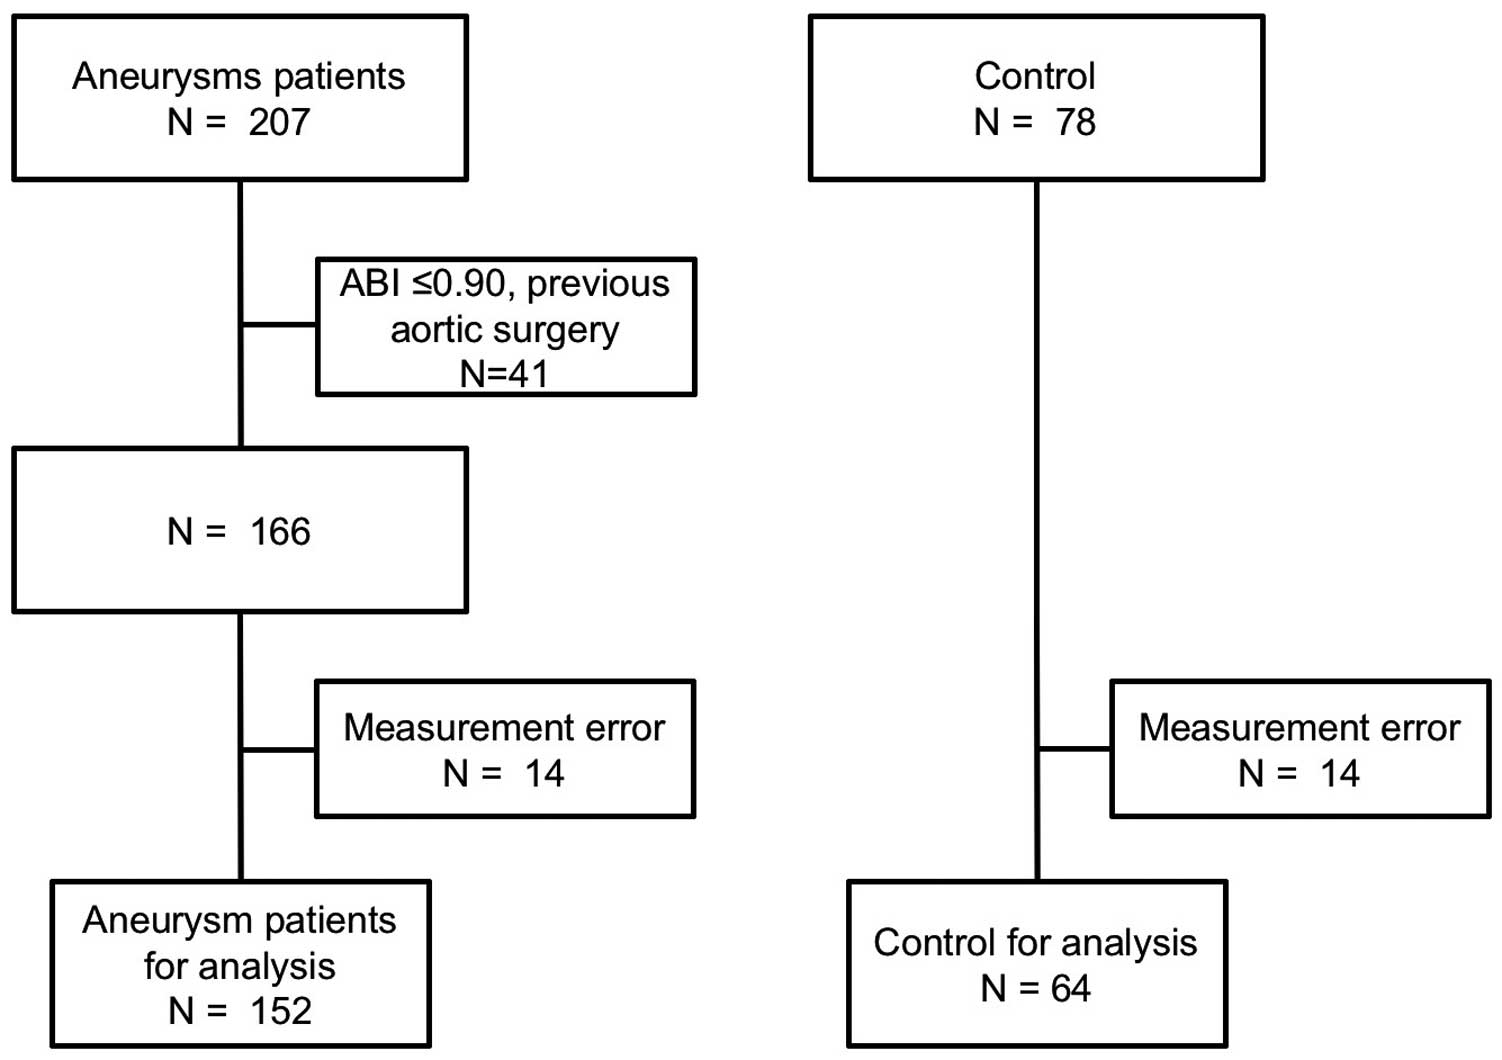
Table.
Characteristics of Aneurysm Patients and Controls in Study of Novel Algorithm Analyzing Pulse Wave Transfer
| |
Aneurysm patients
(n=152) |
Controls
(n=64) |
P value |
| Age (years) |
75.7±7.4 |
71.3±8.5 |
<0.01 |
| Male (%) |
121 (79.6) |
46 (71.9) |
0.22 |
| BMI (kg/m2) |
23.0±3.5 |
23.1±3.1 |
0.89 |
| Smoking habit (%) |
66 (43.4) |
32 (50.0) |
0.38 |
| Maximum aortic diameter (mm) |
47.1±10.2 |
20.2±2.4 |
<0.01 |
| Heart rate (beats/min) |
69.6±12.4 |
69.6±9.8 |
0.99 |
| Brachial SBP (mmHg) |
131.9±17.8 |
137.3±17.8 |
0.04 |
| Brachial DBP (mmHg) |
78.6±11.3 |
78.1±10.8 |
0.75 |
| Ankle SBP (mmHg) |
147.8±22.6 |
137.7±24.3 |
<0.01 |
| Ankle DBP (mmHg) |
78.6±11.7 |
74.3±12.4 |
<0.01 |
| ABI |
1.11±0.10 |
0.99±0.14 |
<0.01 |
| baPWV (cm/s) |
1,877.9±490.3 |
1,703.1±382.7 |
0.01 |
| Hypertension (%) |
134 (88.2) |
56 (87.5) |
0.89 |
| Dyslipidemia (%) |
42 (27.6) |
27 (42.2) |
0.04 |
| Diabetes mellitus (%) |
24 (15.8) |
23 (35.9) |
<0.01 |
| CAD (%) |
48 (31.6) |
26 (40.6) |
0.20 |
| CVD (%) |
22 (14.5) |
9 (14.1) |
0.97 |
| CKD (%) |
17 (11.2) |
7 (10.9) |
0.96 |
| Hemodialysis (%) |
4 (2.6) |
3 (4.7) |
0.43 |
ABI, ankle-brachial index; baPWV, brachial-ankle pulse wave velocity; BMI, body mass index; CAD, coronary artery disease; CKD, chronic kidney disease; CVD, cerebrovascular disease.
Among 152 patients with AAs, 121 were diagnosed as having AAs by the algorithm. Sensitivity, specificity and accuracy have been estimated at 80% (95% CI: 73–86%), 52% (95% CI: 39–64%), and 71% (95% CI: 65–77%), respectively. The sensitivity for AA detection according to size is shown in
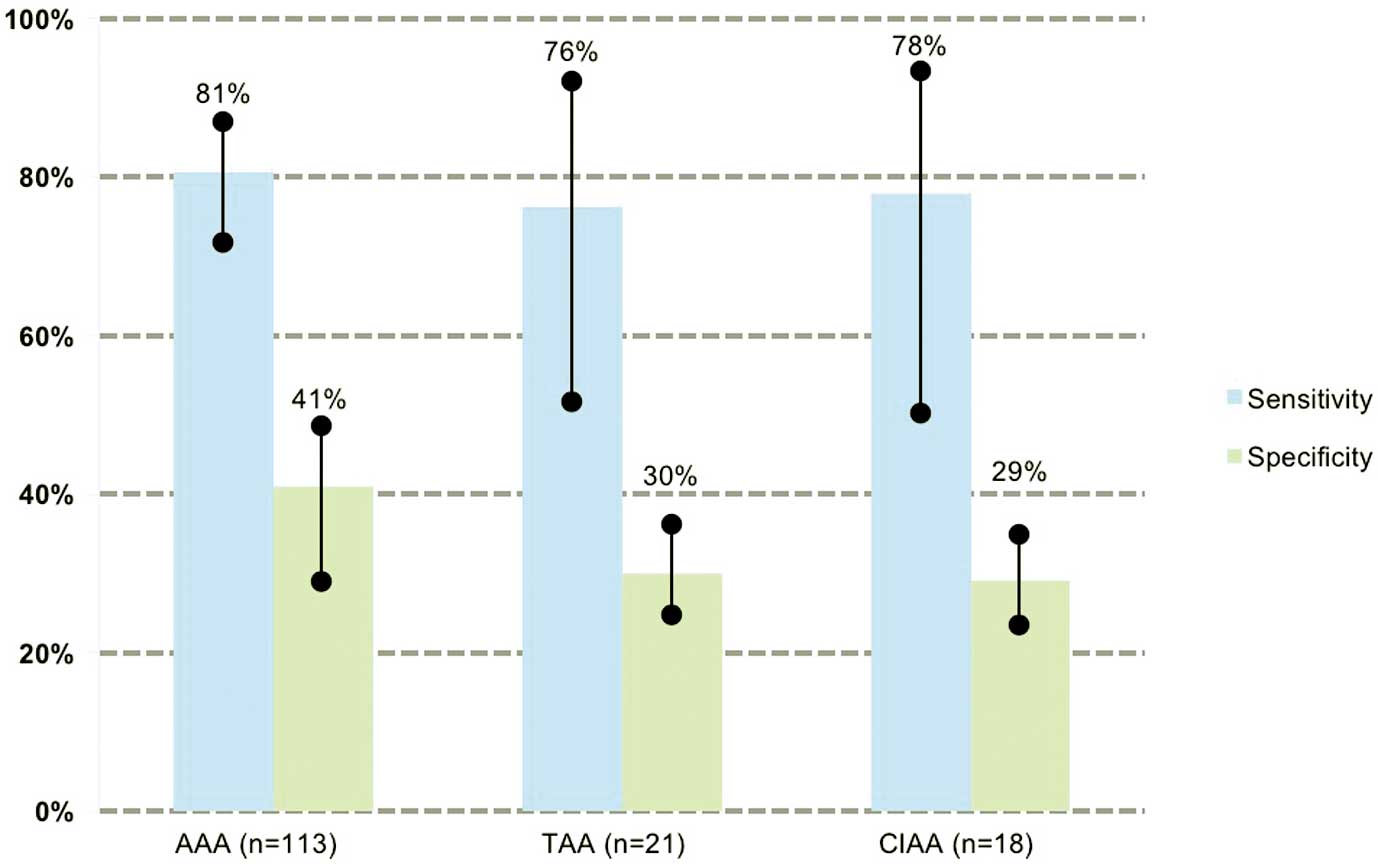
Figure 3. Notably, sensitivity tended to be higher for larger AAs, with the sensitivity for detection of AA ≥45 mm being 85% (95% CI: 78–92%), and for AA ≥55 mm being 93% (95% CI: 77–99%). There was no sensitivity difference according to the aneurysm’s location, with the sensitivity for detection of AAA being 80% (95% CI: 73–88%), 76% for TAA (95% CI: 53–92%), and 78% for CIAA (95% CI: 52–94%) (Figure 4). Likewise, AA morphology (i.e., saccular vs. fusiform) did not affect the sensitivity.
Discussion
PWV in AAA patients has been reported to be lower than in controls, possibly caused by an alteration in the pulse transmission pattern. There is controversy regarding the relationship between the PWV and aortic diameter. Although Bailey et al reported an inverse, weak correlation of PWV and aortic diameter,13
Paraskevas et al reported that the aortic PWV did not correlate with AAA diameter.18
Therefore, it seems unlikely that only PWV would be sensitive enough as a screening tool of AAs. By incorporating the PVR waveforms and PWV into the algorithm, in the current study the overall sensitivity for AA detection was 80%. Furthermore, the detection sensitivity for large AAs ≥55 mm reached 93%. The risk of AA rupture increases with size. The UK Small Aneurysm Trial found that for AAs <4 cm, 4–4.9 cm, and 5–5.9 cm, the annual risk of rupture was 0.3%, 1.5%, and 6.5%, respectively.19
Even though the number of large AAs included in this study was small, our result showed that they can be detected with a high sensitivity. Another point is that TAA was also effectively detected, with a detection sensitivity of 83%, comparable to that for AAA. Until now there has not been any practical screening approach for TAA, as ultrasonographic detection of TAA is challenging because of pulmonary air interfering with the ultrasound beam. AA screening by CTA imposes a substantial amount of radiation exposure, while MR angiography increases the medical costs because of the long scanning time. Our screening method is simple and easily performed with 4 oscillometric cuffs wrapped around both ankles and arms, taking only a few minutes. However, as the number of cases of TAA in the study was also small, a larger prospective study is required to validate the detection ability for TAA.
Study Limitations
First, the current algorithm could not evaluate patients whose ABI values in both legs were ≤0.90. In addition, measurement failures were observed in 11.4% of the subjects, precluding evaluation of diagnostic performance in a realworld practice. Second, despite the high sensitivity for large AAs, the specificity was low, which can increase the need for ultrasound or CT scan to rule out the presence of AAs. Because the number of controls recruited was small, recruitment of more controls including healthy volunteers without atherosclerotic burden would improve the sensitivity. Finally, 2 patients with AAs ≥55 mm were not detected. The aortic wall was heavily calcified in the first patient, possibly affecting the pulse wave change. In the second patient, the number of blocks used for the pulse analysis was only 2 of the 16 blocks recorded, which might not have been enough for the pulse analysis. In this study, any effects of calcification, aortic tortuosity, or thrombus burden in the aneurysmal sac on the pulse waves were not systematically analyzed. These factors should be evaluated in the future.
Conclusions
In this preliminary evaluation, a new algorithm for AA detection was demonstrated to have high diagnostic sensitivity, especially for larger aneurysms. However, to be used as a screening tool in the future, the specificity needs to be improved.
Conflicts of Interest
T.H. is an employee of Omron Healthcare and K.K. received joint research funds provided by Omron Healthcare.
References
- 1.
Vardulaki KA, Walker NM, Day NE, Duffy SW, Ashton HA, Scott RA. Quantifying the risks of hypertension, age, sex and smoking in patients with abdominal aortic aneurysm. Br J Surg 2000; 87: 195–200.
- 2.
Scott RA, Ashton HA, Kay DN. Abdominal aortic aneurysm in 4237 screened patients: Prevalence, development and management over 6 years. Br J Surg 1991; 78: 1122–1125.
- 3.
Wilmink TB, Quick CR, Hubbard CS, Day NE. The influence of screening on the incidence of ruptured abdominal aortic aneurysms. J Vasc Surg 1999; 30: 203–208.
- 4.
Kniemeyer HW, Kessler T, Reber PU, Ris HB, Hakki H, Widmer MK. Treatment of ruptured abdominal aortic aneurysm, a permanent challenge or a waste of resources?: Prediction of outcome using a multi-organ-dysfunction score. Eur J Vasc Endovasc Surg 2000; 19: 190–196.
- 5.
Macdonald AJ, Faleh O, Welch G, Kettlewell S. Missed opportunities for the detection of abdominal aortic aneurysms. Eur J Vasc Endovasc Surg 2008; 35: 698–700.
- 6.
Erbel R, Aboyans V, Boileau C, Bossone E, Bartolomeo RD, Eggebrecht H, et al. 2014 ESC Guidelines on the diagnosis and treatment of aortic diseases: Document covering acute and chronic aortic diseases of the thoracic and abdominal aorta of the adult: The Task Force for the Diagnosis and Treatment of Aortic Diseases of the European Society of Cardiology (ESC). Eur Heart J 2014; 35: 2873–2926.
- 7.
Scott RA, Wilson NM, Ashton HA, Kay DN. Influence of screening on the incidence of ruptured abdominal aortic aneurysm: 5-year results of a randomized controlled study. Br J Surg 1995; 82: 1066–1070.
- 8.
Ashton HA, Buxton MJ, Day NE, Kim LG, Marteau TM, Scott RA, et al. The Multicentre Aneurysm Screening Study (MASS) into the effect of abdominal aortic aneurysm screening on mortality in men: A randomised controlled trial. Lancet 2002; 360: 1531–1539.
- 9.
Takagi H, Goto SN, Matsui M, Manabe H, Umemoto T. Regarding “preoperative statin therapy is associated with improved outcomes and resource utilization in patients undergoing aortic aneurysm repair”. J Vasc Surg 2010; 52: 820–822; author reply 822.
- 10.
Johansson G, Markstrom U, Swedenborg J. Ruptured thoracic aortic aneurysms: A study of incidence and mortality rates. J Vasc Surg 1995; 21: 985–988.
- 11.
Aboyans V, Criqui MH, Abraham P, Allison M, Creager M, Dieham C, et al; on behalf of the American Heart Association Council on Peripheral Vascular Disease, Council on Epidemiology and Prevention, Council on Clinical Cardiology, Council on Cardiovascular Nursing, Council on Cardiovascular Radiology and Intervention, and Council on Cardiovascular Surgery and Anesthesia. Measurement and interpretation of the ankle-brachial index: A scientific statement from the American Heart Association. Circulation 2012; 126: 2890–2909.
- 12.
Mattace-Raso FU, van der Cammen TJ, Hofman A, van Popele NM, Bos ML, Schalekamp MA, et al. Arterial stiffness and risk of coronary heart disease and stroke: The Rotterdam Study. Circulation 2006; 113: 657–663.
- 13.
Bailey MA, Davies JM, Griffin KJ, Bridge KI, Johnson AB, Sohrabi S, et al. Carotid-femoral pulse wave velocity is negatively correlated with aortic diameter. Hypertens Res 2014; 37: 926–932.
- 14.
Sato H, Iseki Y, Utsuno H, Matsuhisa H, Yamada K, Sawada K. Identification of pulse wave propagation characteristics in viscoelastic tube. Trans Jpn Soc Mech Eng 2010; 76: 961–969.
- 15.
Sato H, Yamashita S, Utsuno H, Matsuhisa H, Yamada K, Sawada K. Identification of pulse wave velocity and reflection ratio from peripheral vessels using frequency response. Trans Jpn Soc Mech Eng 2011; 77: 989–1003.
- 16.
Sato H, Iseki Y, Utsuno H, Matsuhisa H, Yamada K, Sawada K. An elaborated multi-branched model of human arteries. Trans Jpn Soc Mech Eng 2011; 77: 2695–2710.
- 17.
Sato H, Matsuhisa H, Utsuno H, Yamada K, Ogura T. Screening method of an arterial aneurysm by the pulse wave transfer function. Proc Symposium Sports Hum Dynam 2011; 2011: 179–184.
- 18.
Paraskevas KI, Bessias N, Psathas C, Akridas K, Dragios T, Nikitas G, et al. Evaluation of aortic stiffness (aortic pulse-wave velocity) before and after elective abdominal aortic aneurysm repair procedures: A pilot study. Open Cardiovasc Med J 2009; 3: 173–175.
- 19.
Brown PM, Pattenden R, Vernooy C, Zelt DT, Gutelius JR. Selective management of abdominal aortic aneurysms in a prospective measurement program. J Vasc Surg 1996; 23: 213–220.