Abstract
Background:
This study aimed to evaluate the diagnostic performance of coronary flow reserve (CFR), hyperemic myocardial blood flow (hMBF), and CFR ratio for detecting significant coronary artery disease (CAD) on 13N-ammonia positron emission tomography (PET).
Methods and Results:
We analyzed 63 patients (mean age, 71±9 years; 43 males) with suspected CAD who underwent both pharmacological stress/rest 13N-ammonia PET and coronary angiography. CFR and hMBF for PET were calculated automatically using quantitative PET software, and the CFR ratio was defined as the ratio of per-vessel CFR to maximum CFR in a standard 17-segment model. We compared the diagnostic performance among the 3 quantitative values. In the per-vessel analysis, 55 vessels were diagnosed as significant CAD (≥70% stenosis and/or fraction flow reserve ≤0.8). CFR, hMBF, and CFR ratio of significant CAD were significantly lower than for non-significant CAD (1.85±0.69 vs. 2.38±0.69; P<0.01, 1.67±0.54 vs. 2.19±0.52 mL·min−1·g−1; P<0.01, and 0.66±0.15 vs. 0.82±0.09; P<0.01, respectively). In the receiver-operating characteristic curve analysis, CFR, hMBF, and CFR ratio had areas under the curve of 0.71, 0.75, and 0.85 respectively, and the CFR ratio was significantly higher than CFR and hMBF (P<0.05). The sensitivity, specificity, and accuracy of the CFR ratio with an optimal cutoff value of 0.75 were 75%, 85%, and 82%, respectively.
Conclusions:
Clinically, the CFR ratio in 13N-ammonia PET was more effective in detecting significant CAD.
Visual assessment of coronary angiography (CAG) has limitations in the diagnosis of physiologically significant stenosis of coronary artery disease (CAD) that requires intervention, but the identification of physiologically significant stenosis of CAD that truly requires revascularization is crucial. To date, coronary flow reserve (CFR) has been widely used for the physiological assessment of CAD.1,2
Several modalities as non-invasive tests for myocardial blood flow (MBF), such as computed tomography (CT),3
magnetic resonance imaging,4
and single photon emission CT (SPECT),5
have been validated by positron emission tomography (PET). CFR obtained by these modalities has been used in clinical decision-making for the treatment of CAD. Among these modalities, PET has been established as the gold standard for quantification of myocardial perfusion imaging.
However, abnormal CFR does not necessarily imply significant CAD because CFR is an inclusive parameter of epicardial stenosis, diffuse atherosclerosis, and microvascular function.6
In fact, excluding microvascular dysfunction is difficult when we assess ischemia using myocardial perfusion imaging. Furthermore, because the CFR is a ratio of hyperemic (hMBF) and rest MBF, the fluctuation in rest MBF by hemodynamic changes (i.e., blood pressure, heart rate) in individual patients causes misinterpretation of the CFR independent of epicardial stenosis.7
Baumgart et al reported that the relative CFR, the ratio between CFR in the stenosed target vessel and that in a nonstenotic reference vessel using Doppler guide wire, had a closer correlation with fractional flow reserve (FFR) than traditional CFR.8
Because factors associated with decreased microvascular dysfunction (i.e., hypertension, diabetes, dyslipidemia, and smoking) or rest MBF will similarly affect both target and reference vessels, the influence of microcirculation or hemodynamics can be omitted by dividing the “normal” reference value. However, this method is invasive and complicated because measurements of 2 vessels using Doppler wire are mandatory.
Danad et al have recently reported that absolute hMBF alone using 15O-water PET provided higher diagnostic performance than CFR.9
In addition to this parameter, we hypothesized that the CFR ratio, the CFR in the target vessel to that in reference vessel, derived from quantitative PET, also has better accuracy for diagnosis of CAD based on the concept of Doppler-guided wire era. Accordingly, we evaluated the diagnostic performance of CFR, hMBF, and the CFR ratio for predicting CAD using 13N-ammonia PET.
Methods
Study Design and Subjects
From April 2014 to November 2016, 290 patients with suspected or known CAD who were referred for 13N-ammonia PET at Ehime Prefectural Central Hospital were prospectively enrolled in this study. The exclusion criteria were as follows: (1) previous percutaneous coronary intervention (PCI) and coronary artery bypass grafting (CABG); (2) history of myocardial infarction; (3) unstable angina; (4) cardiomyopathy; (5) symptomatic congestive heart failure; (6) greater than first-degree atrioventricular block; and (7) symptomatic asthma.
We excluded 113 patients based on the exclusion criteria (PCI/CABG, n=73; myocardial infarction, n=37; cardiomyopathy, n=2; heart failure, n=1). Furthermore, 8 patients were excluded because the PET image was not suitable for analysis for mechanical reasons or because the patient moved during the dynamic scan. Of the remaining 169 patients, 63 underwent diagnostic CAG for clinical reasons within 3 months of undergoing 13N-ammonia PET. None of the patients experienced no cardiac events in the time between 13N-ammonia PET and CAG. Finally, we analyzed the data for the 63 patients (mean age 70.8±9.2 years; 43 males) in this study. A pretest probability of CAD was determined based on the Diamond and Forrester criteria.10
Pretest probability <10%, 10–90%, and >90% was classified as low, intermediate, and high, respectively.
The institutional ethics committee approved this study protocol (Ehime Prefectural Central Hospital, No. 27-5), and all patients provided informed consent.
PET Acquisition Protocol
All patients underwent single-day rest/stress 13N-ammonia PET with a PET/CT scanner (Discovery ST elite, GE Healthcare, USA). Dynamic PET scans at rest and during the pharmacologic stress were performed in the 2D list mode, and dynamic frames were reconstructed (12×10 s, 4×60 s, 2×120 s, and 1×10 min, for a total of 20 min).
CT scans (120 kVp, 10–440 mA) were used for attenuation correction. The patients were asked to fast for more than 6 h and instructed to refrain from consuming beverages containing caffeine for at least 12 h before the test. The rest scan was performed with 370 MBq of 13N-ammonia as a bolus injection with saline flush. After 1 h, the pharmacological stress scan was performed during adenosine triphosphate disodium (ATP)-induced hyperemia at a rate of 160 μg·kg−1·min−1
over 5–6 min.11,12
After a 4-min ATP infusion, 13N-ammonia was injected at the same dose and the same protocol as described above was followed. Heart rate and blood pressure were recorded at the time of rest test and every minute during and after ATP infusion with continuous ECG monitoring.
PET Image Analysis
PET images were quantitatively analyzed using commercially available dedicated software package (Syngo MBF, Siemence Healthcare, Germany). Quantitative analysis was almost automatic using a 2-compartment model for the model previously developed by Hutchins et al.13
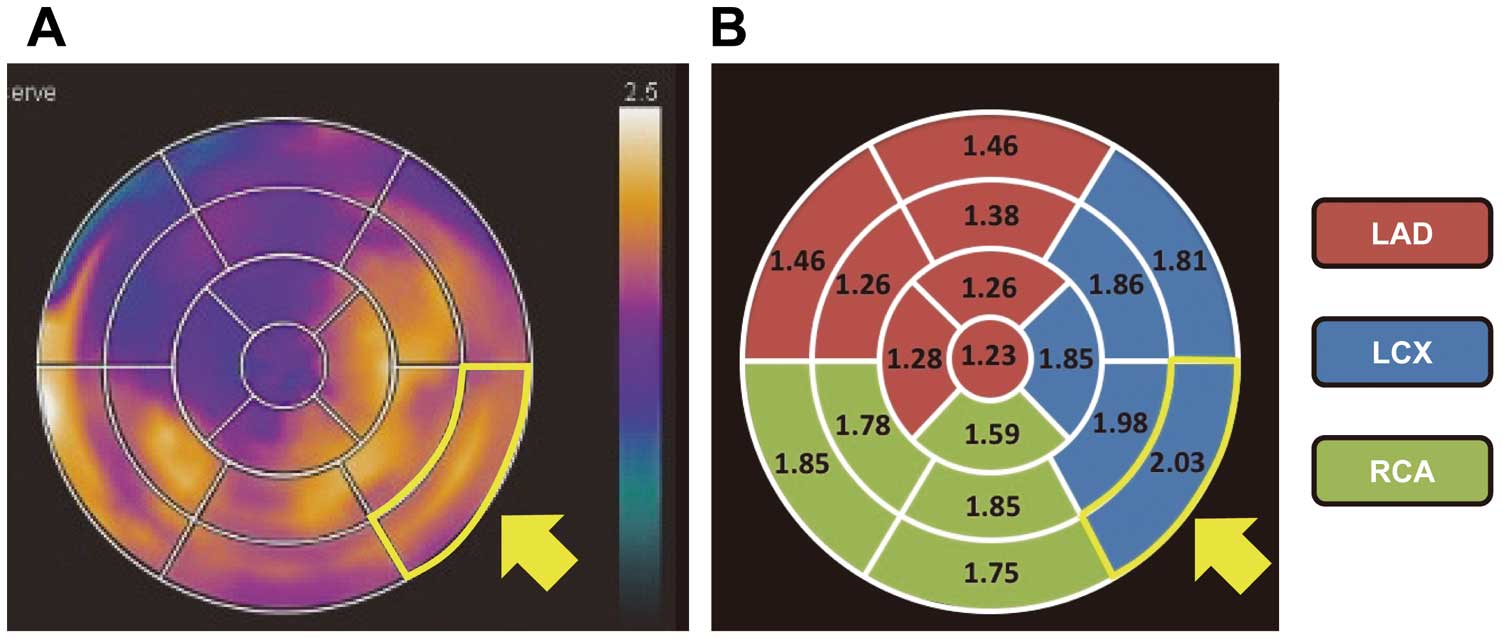
The mean MBF values (mL·min−1·g−1) were measured for the regions of the left anterior descending (LAD), left circumflex (LCX), and right coronary artery (RCA) using known standard coronary anatomy in the 17-segment standard American Heart Association model at both rest and during stress. The mean CFR was calculated as the ratio of hMBF (stress scan) to rest MBF (rest scan) in each region. The CFR ratio was defined as the ratio of per-vessel CFR to maximum CFR in the 17-segment model (Figure 1).
CAG and FFR Measurement
Diagnostic CAG was performed with the percutaneous radial approach using 5Fr catheters. Coronary angiograms were obtained after injection of 1.25 mg isosorbide dinitrate to obtain maximal epicardial coronary dilatation. Quantitative CAG analysis (QCA) of percent diameter stenosis was performed with QAngio XA software (Medis Image Systems, Leiden, The Netherlands). If the stenosis was judged as intermediate (≈40–70%) by visual assessment, FFR was measured with a 0.014-inch Radi PressureWireTM
(St. Jude Medical, Inc., St. Paul, USA) at the operators’ discretion. After part of the pressure sensor was advanced to the distal segment of the target vessel, intravenous infusion of ATP (160 μg·kg−1·min−1) was administered to obtain maximal coronary hyperemia. FFR was calculated as the ratio of the mean distal coronary pressure by the pressure wire to the mean aortic pressure measured by the catheter. Significant stenosis was defined as coronary artery stenosis ≥70% on CAG with QCA and/or FFR ≤0.8. When FFR was performed during CAG, stenosis with FFR >0.8 was classified as non-significant.
Statistical Analysis
Data are expressed as mean±SD or number and percentage (%). Variables for the hemodynamic conditions during PET and quantitative parameters of myocardial perfusion scan were compared using Student’s t-test or Wilcoxon rank-sum test as appropriate. The optimal cutoff points for CFR, hMBF, and the CFR ratio for the detection of significant lesion were obtained through receiver-operating characteristic (ROC) analyses, and the areas under the curve (AUCs) were compared similar to the previously described method with Bonferroni correction.14,15
The diagnostic performance was assessed with sensitivity, specificity, positive predictive value (PPV), negative predictive value (NPV), and accuracy on a per-vessel basis. Spearman’s correlation coefficient was used to assess the relationship between FFR and quantitative parameters of myocardial perfusion. Statistical analyses were performed using JMP12 statistical software (SAS Institute, Cary, NC, USA). P<0.05 was considered statistically significant.
Results
This study analyzed 63 patients who underwent both 13N-annmonia PET and CAG. The patients’ clinical characteristics are shown in
Table 1. The pretest probability of CAD was low, intermediate, and high for 9 (14%), 37 (59%), and 17 (27%) patients, respectively. In 189 vessels, FFR was performed for 32 vessels, showing FFR ≤0.80 in 20 vessels. In the remaining 157 vessels, 35 vessels had stenosis ≥70% on QCA. Finally, 55 vessels (29%) were defined as significantly stenotic, and 134 vessels (71%) were defined as non-significantly stenotic. Of the 63 patients, 39 had significant stenosis, with 1-vessel disease in 26, 2-vessel disease in 10, and 3-vessel disease in 3; 24 patients had no significant stenosis in all vessels.
Table 1.
Clinical Characteristics of the Patients With Significant CAD
| Characteristics |
|
| Sex, male, n (%) |
43 (68) |
| Age (years) |
70.8±9.2 |
| Body weight (kg) |
60.1±12.0 |
| Body mass index (kg/m2) |
23.6±2.9 |
| Risk factor, n (%) |
| Hypertension |
46 (73) |
| Diabetes mellitus |
28 (44) |
| Hyperlipidemia |
26 (41) |
| Smoking |
33 (52) |
| Family history of CAD |
22 (35) |
| Medication, n (%) |
| Statin |
33 (52) |
| β-blocker |
21 (33) |
| Calcium-channel blocker |
39 (62) |
| ACEI/ARB |
38 (60) |
| Aspirin |
20 (32) |
| Symptoms, n (%) |
| Typical chest pain |
18 (29) |
| Atypical chest pain |
12 (19) |
| Chest discomfort |
16 (25) |
| Asymptomatic |
17 (27) |
| Pretest probability of CAD, n (%) |
| Low |
9 (14) |
| Intermediate |
37 (59) |
| High |
17 (27) |
Data given as mean±SD or number (%). CAD, coronary artery disease; ACEI, angiotensin-converting enzyme inhibitor; ARB, angiotensin-receptor blocker.
The variables of hemodynamic conditions during PET scan are shown in
Table 2. The heart rate and rate-pressure product increased significantly from the rest scan to ATP-induced hyperemia, whereas systolic blood pressures decreased significantly (P<0.01). All symptoms and hemodynamic changes were tolerated and disappeared within 1–2 min after discontinuation of ATP infusion. No severe adverse events were observed during pharmacological stress induction.
Table 2.
Hemodynamics Conditions During PET Scanning of Patients With Significant CAD
| Variable |
Rest |
Hyperemia |
P value |
| Heart rate (beats/min) |
63.6±11.2 |
80.0±12.4 |
<0.01 |
| Systolic blood pressure (mmHg) |
143.1±25.1 |
126.7±22.4 |
<0.01 |
| Diastolic blood pressure (mmHg) |
74.3±15.0 |
74.0±14.6 |
0.90 |
| Rate-pressure product |
9,107±2,367 |
10,146±2,443 |
<0.01 |
Data given as mean±SD. Rate-pressure product=heart rate×systolic blood pressure. CAD, coronary artery disease.
On a per-vessel analysis, quantitative myocardial perfusion in relation to significant CAD is shown in
Table 3. CFR and hMBF were significantly lower in the territories for vessels with significant stenosis compared with those without significant CAD: 1.85±0.69 vs. 2.38±0.69 and 1.67±0.54 mL·min−1·g−1
vs. 2.19±0.52 mL·min−1·g−1
(all, P<0.01). Rest MBF showed no significant difference between patients with and without significant CAD: 0.94±0.21 vs. 0.97±0.27 (P=0.47). The CFR ratio was calculated for all vessels and was significantly lower in territories for vessels with significant stenosis than for those without significant CAD: 0.66±0.15 vs. 0.82±0.09 (P<0.01).
Table 3.
Quantitative Myocardial Perfusion Parameters in Relation to Significant CAD (Vessel-Based Analysis)
| |
Significant CAD |
Non-significant CAD |
P value |
| Rest MBF (mL·min−1·g−1) |
0.94±0.21 |
0.97±0.27 |
0.47 |
| Hyperemic MBF (mL·min−1·g−1) |
1.67±0.54 |
2.19±0.52 |
<0.01 |
| CFR |
1.85±0.69 |
2.38±0.69 |
<0.01 |
| CFR ratio |
0.66±0.15 |
0.82±0.09 |
<0.01 |
Data given as mean±SD. CAD, coronary artery disease; MBF, myocardial blood flow; CFR, coronary flow reserve.
ROC analysis revealed an AUC of 0.71, 0.75, and 0.85 for CFR, hMBF, and CFR ratio, respectively (P<0.05 for CFR ratio vs. hMBF, P<0.05 for CFR ratio vs. CFR, and P=0.23 for hMBF vs. CFR;
Figure 2). The optimal cutoff values for CFR, hMBF, and the CFR ratio were 1.97, 1.91 mL·min−1·g−1, and 0.75, respectively. Sensitivity, specificity, PPV, NPV, and accuracy of CFR, hMBF, and the CFR ratio to detect significant CAD are shown per-vessel in
Table 4. The CFR ratio had a higher diagnostic performance for detection of significant CAD than hMBF and CFR.
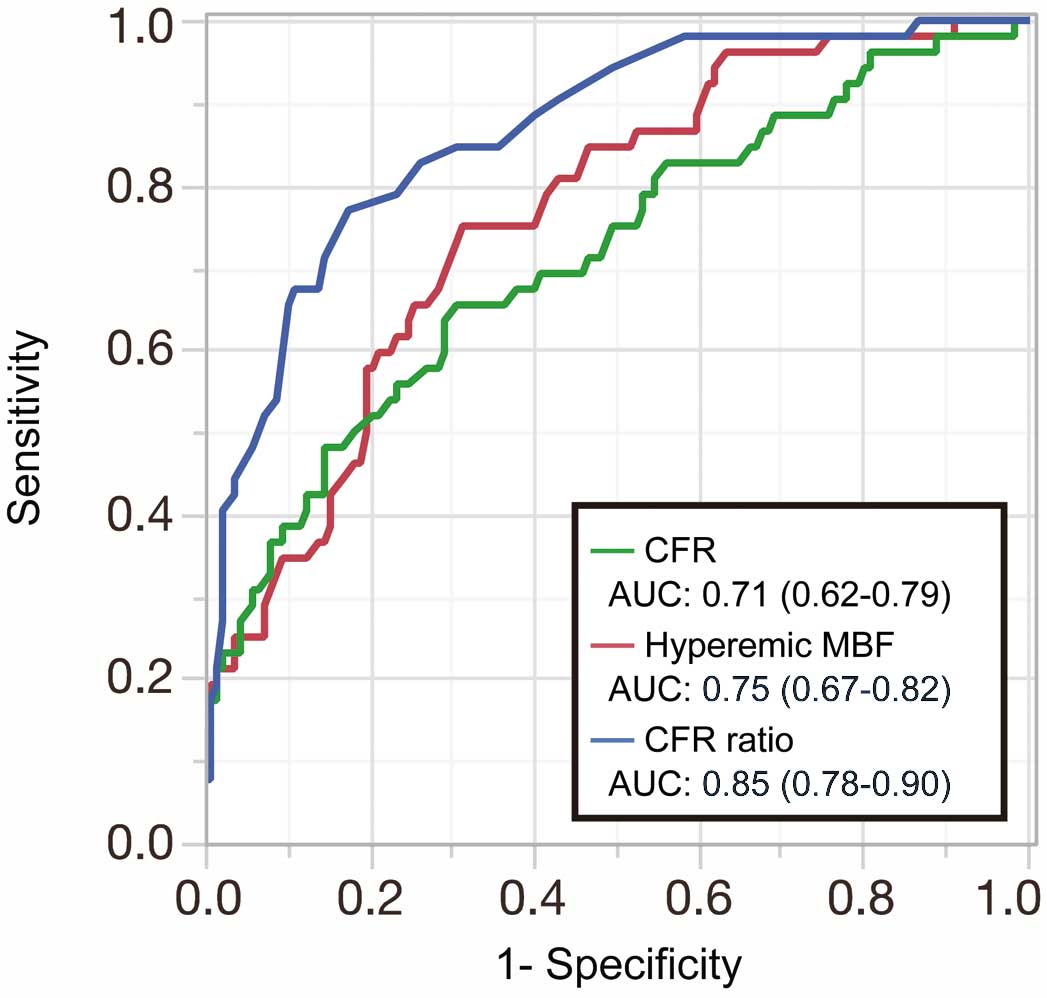
Table 4.
Diagnostic Performance of PET for Detecting Significant CAD (Vessel-Based Analysis)
| |
CFR |
Hyperemic MBF |
CFR ratio |
| Optimal cutoff value |
1.97 |
1.91 (mL·min−1·g−1) |
0.75 |
| Sensitivity (%) |
64 (50–76) |
75 (61–85) |
75 (61–85) |
| Specificity (%) |
69 (61–77) |
69 (61–77) |
85 (78–91) |
| PPV (%) |
46 (38–54) |
50 (43–57) |
67 (57–76) |
| NPV (%) |
82 (76–87) |
87 (81–91) |
89 (84–93) |
| Accuracy (%) |
68 (61–74) |
71 (64–77) |
82 (76–87) |
Data given as % (95% confidence interval). CAD, coronary artery disease; MBF, myocardial blood flow; CFR, coronary flow reserve; PPV, positive predictive value; NPV, negative predictive value.
Figure 3
shows scatter plots illustrating the relationship between FFR and quantitative parameters of myocardial perfusion (CFR, hMBF, and the CFR ratio). Among all the quantitative parameters, the CFR ratio showed the highest correlation coefficient with FFR (r=0.71, P<0.01). Hyperemic MBF revealed a significant but modest correlation (r=0.58, P<0.01). CFR had no significant correlation (r=0.32, P=0.078). In the representative case shown in
Figure 4, only the CFR ratio was able to accurately detect significant CAD.
Discussion
The main findings of this study were as follows: (1) diagnostic performance of the CFR ratio derived by quantitative 13N-ammonia PET in the detection of significant CAD significantly better than that of conventional CFR and hMBF; (2) no significant statistical difference in discriminant function observed between CFR and hMBF; and (3) the CFR ratio significantly correlated with pressure-derived FFR. The relationship between FFR and hMBF was significant but modest, and there was no significant correlation between FFR and CFR.
CFR on Quantitative PET
In addition to qualitative evaluations such as SPECT, PET has the advantage of estimating MBF and CFR. Indeed, studies of the quantification of CFR using PET for detecting CAD have provided added diagnostic value to qualitative assessment. Fiechter et al demonstrated sensitivity, specificity, PPV, NPV, and accuracy of 96%, 80%, 93%, 89%, and 92%, respectively, for detecting significant CAD after incorporating CFR measured by 13N-ammonia,16
which is outstanding compared with our data. The PPV of CFR in the present study was particularly low (46%), which means reduced CFR did not necessarily reflect significant epicardial stenosis in approximately half of the vessels. The main reason for this discordant result could be differences in patients’ characteristics that are associated with microvascular function. Because quantitative PET perfusion includes the entire coronary tree, microvascular dysfunction could affect hMBF.17
A higher prevalence of risk factors related to microvascular dysfunction compared with other studies is associated with relatively low diagnostic performance of CFR. The higher age of candidates in this study (mean, 70.8 years) than in the previous studies (mean, 61–64 years) may have also affected the poor diagnostic performance of CFR.9,16,18
Aging is associated with microvascular dysfunction and causes diminished hyperemic perfusion.7,19
Moreover, rest MBF is enhanced with increasing heart rate and blood pressure, which lead to reduced CFR despite significant epicardial stenosis. The cutoff value for CFR in this study was low (1.97) compared with previous studies using 15O-water PET.9
This inconsistency is considered to be related to the PET tracers in addition to patients’ characteristics. Consequently, the reported “normal” CFR value varied considerably.20
Therefore, even quantitative CFR measurement is likely to have substantial limitation in patients with cumulative risk factors related to microvascular impairment.
Absolute MBF on Quantitative PET
Joutsiniemi et al have shown that hMBF alone is superior to CFR in the detection of hemodynamically significant CAD using 15O-water PET.18
Danad et al also demonstrated that hMBF revealed a significantly greater diagnostic performance than CFR in a multicenter large-scale cohort study.9
Hyperemic MBF alone is not influenced by changes in rest MBF, so it should not be affected by changes in heart rate and blood pressure. In the present study, however, the diagnostic performance had no significant difference between hMBF and CFR (P=0.23). The inconsistent results between this study and those of previous studies may be related to the small numbers of patients and thus lower statistical power in this study. Hyperemic MBF in this study could exclude significant CAD with high NPV (87%). However, reduced hMBF does not always reflect significant epicardial stenosis similar to CFR, as shown by low PPV (50%). Jin et al recently demonstrated that elderly patients with intermediate CAD have higher FFR values compared with younger patients despite a similar degree of epicardial stenosis.21
The pressure gradient across the lesion will diminish in patients with diminished microvascular function compared with those with preserved hyperemic response despite the same degree of stenosis. The prevalence of diffuse atherosclerosis has been reported to increase with aging.22
Because MBF measurement using PET depends on all coronary trees and because FFR is the pressure gradient at focal but not diffuse epicardial stenosis, discordance between hMBF and FFR can occur. Indeed, in our study, the relationship between FFR and hMBF was significant but modest. With regard to the result for CFR, the higher prevalence of risk factors related to microvascular dysfunction and aging compared with other studies could be associated with the relatively low diagnostic performance of hMBF.
Relative Analysis on Quantitative PET
The relative flow reserve (FR), similar to the concept of FFR, was initially validated by De Bruyne et al using 15O-water PET, wherein the ratio of the maximal absolute flow in the stenotic region to the maximal absolute flow in the reference region, as an alternative of the maximal absolute flow in the absence of stenosis, is calculated.23
The concept of relative value is based on the assumption that the hMBF in the reference territory is similar to that in diseased territory in the absence of stenosis. High agreement between pressure-derived FFR and relative FR (r=0.87) suggested the feasibility of non-invasive estimation of FFR using quantitative PET. A similar concept of relative CFR, using the CFR ratio in the stenosed target vessel and that in a non-stenotic reference vessel using Doppler guide wire, has been reported.8
Theoretically, because both target and reference resting flows are omitted from the calculation, relative CFR is ultimately also a similar concept to FFR and relative FR. Because conventional CFR is routinely shown by a dedicated program in the PET study and has a well-known cutoff value, which is approximately 2.0, we can easily recognize an approximate abnormality by further calculation of CFR in 17 segments compared with hyperemic MBF analysis. Furthermore, relative CFR is not influenced by changes in resting flow. In fact, a close correlation has been found between pressure-derived FFR and relative CFR (r=0.91).8
Indeed, the relative value is theoretically promising, but the studies included patients with an isolated, discrete lesion of the proximal or mid LAD in the absence of other lesions on CAG that fulfill the ideal conditions for FFR estimation. Stuijfzand et al recently showed that the diagnostic accuracy of relative FR derived from 15O-water PET was not significantly better than that of hMBF and CFR.24
Furthermore, the correlation between relative FR and FFR was modest (r=0.44, P<0.01). In contrast, Lee et al25
suggested that relative FR showed better discriminant function than hMBF alone or CFR using 13N-ammonia PET. In addition, the correlation between relative FR and FFR was high (r=0.780, P<0.001).25
In the present study, the CFR ratio had significantly better discriminant function compared with CFR and hMBF. It had a significant correlation with invasive FFR (r=0.71, P<0.01). Our data were consistent with those of Lee et al25
in terms of the usefulness of relative analysis for detecting CAD.
Precise selection of the normal reference segment is crucial in the present methodology. In the recent study by Lee et al, the 6 basal segments were not quantified, and the averaged 3 segments of hMBF within the remaining 11 segments were used as the reference.25
To minimize dilution of the CFR value near the vascular segment border, we defined the reference CFR value as the maximum among the 17 myocardial segments. The present study’s methodology is simple and possibly can be applied even if there are differences in tracer, acquisition protocol, and quantitative analysis software; hence, it would be useful in the clinical setting. Lee et al recently demonstrated that the capacity of hMBF outperformed that of CFR, whereas our study could not show this. Several factors, such as the lack of statistical power of our study, patients’ backgrounds, definitions, and method of calculating the relative analysis, may be associated with this discordant result. Nevertheless, relative analyses of both relative FR and the CFR ratio were superior to hMBF alone and CFR for detection of significant CAD.
It is controversial which parameter – hMBF or relative analysis – is superior for detecting CAD.24–26
Theoretically, the CFR ratio could provide a better discriminant capacity for detecting physiologically significant epicardial stenosis because its concept is similar to that of FFR. The relative analysis causes misinterpretation, particularly in multivessel disease, if CFR in the selected reference vessel was decreased. In fact, multivessel disease that causes balanced ischemia was not correctly assessed by relative FR in a previous report. In our study, as expected, the CFR ratio in 2- or 3-vessel disease (13 patients, 39 vessels) showed less accuracy (72%) compared with that of 0- or 1-vessel disease (85%) mainly because of reduced CFR in the reference vessel. Therefore, absolute MBF analysis may have an advantage compared with relative analysis, particularly in multivessel disease. In other words, the accuracy of relative analysis relies on the prevalence of multivessel disease in the study population. Based on the present study, if hMBF and/or CFR was equally reduced <1.91 mL·min−1·g−1
or <1.97 in all territories, we should take into account the possibility of balanced ischemia and may be use them properly.
Taken together, the recent reports and ours indicate that relative analysis is, at least, superior to conventional CFR for detecting functionally significant epicardial stenosis. However, our data did not indicate at a lower clinical significance that conventional CFR was a useful parameter in clinical practice. Global CFR measured using PET is reported to be associated with major cardiac events in patients with CAD,27–29
suggesting a crucial role of microvascular function for prognosis. No significant correlation was found between global CFR and global CFR ratio in the present study (r=0.21, P=0.088). Therefore, global CFR ratio might not be applicable for the prediction of future cardiovascular events. Van de Hoef et al demonstrated that the risk for major cardiovascular events associated with FFR/CFR discordance was mainly from stenosis in cases where where CFR was abnormal.30
Thus, assessment of CFR and FFR are respectively important for prediction of future cardiac events and for detection of hemodynamically significant stenosis. Compared with other invasive indexes (wire-derived FFR and CFR), PET has the great advantage of enabling measurement of MBF in the whole left ventricle. Using quantitative PET measurement, a better treatment strategy could be selected by combining the use of CFR and the CFR ratio in the clinical setting.
Future Directions
Microvascular dysfunction and diffuse atherosclerosis in the epicardial artery are likely to hamper the correct diagnosis using aperfusion study even if non-invasive imaging and parameters are used. Hybrid PET/CT imaging may partially resolve this issue, because coronary CT angiography (CTA) can predict atherosclerotic plaque distribution (i.e., local or diffuse) with considerable diagnostic capacity, and thus an appropriate reference vessel and multivessel disease could be correctly selected.31,32
In fact, because the NPV for significant CAD in coronary CTA is high, reference vessel selection should be reliable. Conversely, although CT can show intermediate stenosis or unassessable lesions because of calcified plaque, quantitative PET can provide physiological information. Furthermore, because there are variations in the myocardial area at risk in each patient, vascular territory misinterpretation on PET corresponding to the culprit or reference vessel can occur.33
Therefore, quantitative PET and coronary CTA may be complementary for better non-invasive diagnosis.
Study Limitations
First, our study consisted of a small number of patients, and was a single-center study. Recent progress in coronary CTA has allowed us to determine CAD easily and rapidly in the daily clinical setting. Therefore, in a considerable number of cases of simple CAD the patient might undergo coronary CTA alone, so that more complex cases that could not be diagnosed using CTA alone might be assigned PET evaluation, when compared with the pre-coronary CTA era. Thus, the present study results might not be comparable with historical PET data. Second, some of the patients diagnosed as having normal coronary perfusion by PET might not undergo CAG based on comprehensive clinical judgment and be excluded from our final analysis group. In the present study, a relatively higher (27%) prevalence of patients with high pretest probability may have affected our results. Third, as mentioned, in patients with multivessel disease, the discriminant function will be reduced with our methodology. Increasing the number of patients with multivessel disease might abolish the superiority of CFR ratio to hMBF in the present study. Further examination is needed, particularly in patients with multivessel disease. Fourth, FFR values in all vessels were not measured. Park et al demonstrated that FFR <0.80 was observed in 16% of lesions among those with angiographic diameter stenosis <50% (reverse mismatch) in non-left main lesions.34
This visual-functional mismatch could modify the prevalence of a functionally significant lesion. In addition, the ideal FFR value as reference vessel is 1.0, but De Bruyne reported that an angiographically “normal” coronary artery with significant stenosis in another coronary artery has a substantially diminished FFR value.35
Complete exclusion of atherosclerosis is likely to be difficult even if localized stenosis is not obvious by visual assessment. Fifth, we determined that ≥70% diameter stenosis on QCA was a significant lesion. However, the FAME study subanalysis using FFR showed that 20% was not functionally significant in the 70–90% stenosis category.36
Finally, the cutoff value used in this study does not apply to other studies using a different tracer (i.e., 15O-water or 82Rb) because 13N-ammonia has a non-linear relationship between signal and perfusion. In fact, the optimal cutoff values are different among studies, including this study,9,24,25
because of the use of different tracers, scan protocols, and patient backgrounds.
Conclusions
The CFR ratio on 13N-ammonia PET had higher diagnostic performance in the detection of significant CAD than conventional CFR and hMBF. This simple quantitative analysis would be useful in clinical decision-making for revascularization.
Acknowledgments
We thank all staff (radiologist, radiological technologist, and nurse) at the PET center in the Ehime Prefectural Central Hospital for the assistance with PET examination and analysis.
Disclosures
The authors declare no conflict of interest.
References
- 1.
Nakazato R, Heo R, Leipsic J, Min JK. CFR and FFR assessment with PET and CTA: Strengths and limitations. Curr Cardiol Rep 2014; 16: 484.
- 2.
Naya M, Tamaki N, Tsutsui H. Coronary flow reserve estimated by positron emission tomography to diagnose significant coronary artery disease and predict cardiac events. Circ J 2015; 79: 15–23.
- 3.
Kikuchi Y, Oyama-Manabe N, Naya M, Manabe O, Tomiyama Y, Sasaki T, et al. Quantification of myocardial blood flow using dynamic 320-row multi-detector CT as compared with 15O-H2O PET. Eur Radiol 2014; 24: 1547–1556.
- 4.
Morton G, Chiribiri A, Ishida M, Hussain ST, Schuster A, Indermuehle A, et al. Quantification of absolute myocardial perfusion in patients with coronary artery disease. J Am Coll Cardiol 2012; 60: 1546–1555.
- 5.
Hsu B, Hu LH, Yang BH, Chen LC, Chen YK, Ting CH, et al. SPECT myocardial blood flow quantitation toward clinical use: A comparative study with 13N-Ammonia PET myocardial blood flow quantitation. Eur J Nucl Med Mol Imaging 2017; 44: 117–128.
- 6.
Johnson NP, Kirkeeide RL, Gould KL. Is discordance of coronary flow reserve and fractional flow reserve due to methodology or clinically relevant coronary pathophysiology? JACC Cardiovasc Imaging 2012; 5: 193–202.
- 7.
Czernin J, Müller P, Chan S, Brunken RC, Porenta G, Krivokapich J, et al. Influence of age and hemodynamics on myocardial blood flow and flow reserve. Circulation 1993; 88: 62–69.
- 8.
Baumgart D, Haude M, Goerge G, Ge J, Vetter S, Dagres N, et al. Improved assessment of coronary stenosis severity using the relative flow velocity reserve. Circulation 1998; 98: 40–46.
- 9.
Danad I, Uusitalo V, Kero T, Saraste A, Raijmakers PG, Lammertsma AA, et al. Quantitative assessment of myocardial perfusion in the detection of significant coronary artery disease: Cutoff values and diagnostic accuracy of quantitative [15O] H2O PET Imaging. J Am Coll Cardiol 2014; 64: 1464–1475.
- 10.
Diamond GA, Forrester JS. Analysis of probability as an aid in the clinical diagnosis of coronary-artery disease. N Engl J Med 1979; 300: 1350–1358.
- 11.
Coma-Canella I, Palazuelos J, Bravo N, García Velloso MJ. Myocardial perfusion imaging with adenosine triphosphate predicts the rate of cardiovascular events. J Nucl Cardiol 2006; 13: 316–323.
- 12.
Yoshinaga K, Tomiyama Y, Suzuki E, Tamaki N. Myocardial blood flow quantification using positron-emission tomography. Circ J 2013; 77: 1662–1671.
- 13.
Hutchins GD, Schwaiger M, Rosenspire KC, Krivokapich J, Schelbert H, Kuhl DE. Non-invasive quantification of regional myocardial blood flow in the human heart using [13N] ammonia and dynamic positron emission tomography imaging. J Am Coll Cardiol 1990; 15: 1032–1342.
- 14.
DeLong ER, DeLong DM, Clarke-Pearson DL. Comparing the areas under two or more correlated receiver operating characteristic curves: A nonparametric approach. Biometrics 1988; 44: 837–845.
- 15.
Shaffer JP. Multiple hypothesis testing. Annul Rev Psychol 1995; 46: 561–584.
- 16.
Fiechter M, Ghadri JR, Gebhard C, Fuchs TA, Pazhenkottil AP, Nkoulou RN, et al. Diagnostic value of 13N-ammonia myocardial perfusion PET: Added value of myocardial flow reserve. J Nucl Med 2012; 53: 1230–1234.
- 17.
Gould KL, Johnson NP, Bateman TM, Beanlands RS, Bengel FM, Bober R, et al. Anatomic versus physiologic assessment of coronary artery disease: Role of coronary flow reserve, fractional flow reserve, and positron emission tomography imaging in revascularization decision-making. J Am Coll Cardiol 2013; 62: 1639–1653.
- 18.
Joutsiniemi E, Saraste A, Pietila M, Maki M, Kajander S, Ukkonen H, et al. Absolute flow or myocardial flow reserve for the detection of significant coronary artery disease? Eur Heart J Cardiovasc Imaging 2014; 15: 659–665.
- 19.
Uren NG, Camici PG, Melin JA, Bol A, de Bruyne B, Radvan J, et al. Effect of aging on myocardial perfusion reserve. J Nucl Med 1995; 36: 2032–2036.
- 20.
Baumgart D, Haude M, Liu F, Ge J, Goerge G, Erbel R. Current concepts of coronary flow reserve for clinical decision making during cardiac catheterization. Am Heart J 1998; 136: 136–149.
- 21.
Jin X, Lim HS, Tahk SJ, Yang HM, Yoon MH, Choi SY, et al. Impact of age on the functional significance of intermediate epicardial artery disease. Circ J 2016; 80: 1583–1589.
- 22.
Hong YJ, Jeong MH, Ahn Y, Sim DS, Chung JW, Cho JS, et al. Age-related differences in intravascular ultrasound findings in 1,009 coronary artery disease patients. Circ J 2008; 72: 1270–1275.
- 23.
De Bruyne B, Baudhuin T, Melin JA, Pijls NH, Sys SU, Bol A, et al. Coronary flow reserve calculated from pressure measurements in humans: Validation with positron emission tomography. Circulation 1994; 89: 1013–1022.
- 24.
Stuijfzand WJ, Uusitalo V, Kero T, Danad I, Rijnierse MT, Saraste A, et al. Relative flow reserve derived from quantitative perfusion imaging may not outperform stress myocardial blood flow for identification of hemodynamically significant coronary artery disease. Circ Cardiovasc Imaging 2015; 8: e002400.
- 25.
Lee JM, Kim CH, Koo BK, Hwang D, Park J, Zhang J, et al. Integrated myocardial perfusion imaging diagnostics improve detection of functionally significant coronary artery stenosis by 13N-ammonia positron emission tomography. Circ Cardiovasc Imaging 2016; 9: e004768.
- 26.
Kajander SA, Joutsiniemi E, Saraste M, Pietila M, Ukkonen H, Saraste A, et al. Clinical value of absolute quantification of myocardial perfusion with 15O-water in coronary artery disease. Circ Cardiovasc Imaging 2011; 4: 678–684.
- 27.
Herzog BA, Husmann L, Valenta I, Gaemperli O, Siegrist PT, Tay FM, et al. Long-term prognostic value of 13N-ammonia myocardial perfusion positron emission tomography added value of coronary flow reserve. J Am Coll Cardiol 2009; 54: 150–156.
- 28.
Taqueti VR, Hachamovitch R, Murthy VL, Naya M, Foster CR, Hainer J, et al. Global coronary flow reserve is associated with adverse cardiovascular events independently of luminal angiographic severity and modifies the effect of early revascularization. Circulation 2015; 131: 19–27.
- 29.
Murthy VL, Naya M, Foster CR, Hainer J, Gaber M, Di Carli G, et al. Improved cardiac risk assessment with noninvasive measures of coronary flow reserve. Circulation 2011; 124: 2215–2224.
- 30.
Van de Hoef TP, Van Lavieren MA, Damman P, Delewi R, Piek MA, Chamuleau SA, et al. Physiological basis and long-term clinical outcome of discordance between fractional flow reserve and coronary flow velocity reserve in coronary stenoses of intermediate severity. Circ Cardiovasc Interv 2014; 7: 301–311.
- 31.
Kajander S, Joutsiniemi E, Saraste M, Pietilä M, Ukkonen H, Saraste A, et al. Cardiac positron emission tomography/computed tomography imaging accurately detects anatomically and functionally significant coronary artery disease. Circulation 2010; 122: 603–613.
- 32.
Thomassen A, Petersen H, Diederichsen AC, Mickley H, Jensen LO, Johansen A, et al. Hybrid CT angiography and quantitative 15O-water PET for assessment of coronary artery disease: Comparison with quantitative coronary angiography. Eur J Nucl Med Mol Imaging 2013; 40: 1894–1904.
- 33.
Kurata A, Kono A, Sakamoto T, Kido T, Mochizuki T, Higashino H, et al. Quantification of the myocardial area at risk using coronary CT angiography and Voronoi algorithm-based myocardial segmentation. Eur Radiol 2015; 25: 49–57.
- 34.
Park SJ, Kang SJ, Ahn JM, Shim EB, Kim YT, Yun SC, et al. Visual-functional mismatch between coronary angiography and fractional flow reserve. JACC Cardiovasc Interv 2012; 5: 1029–1236.
- 35.
De Bruyne B, Hersbach F, Pijls NH, Bartunek J, Bech JW, Heyndrickx GR, et al. Abnormal epicardial coronary resistance in patients with diffuse atherosclerosis but “Normal” coronary angiography. Circulation 2001; 104: 2401–2406.
- 36.
Tonino PA, Fearon WF, De Bruyne B, Oldroyd KG, Leesar MA, Ver Lee PN, et al. Angiographic versus functional severity of coronary artery stenoses in the FAME study fractional flow reserve versus angiography in multivessel evaluation. J Am Coll Cardiol 2010; 55: 2816–2821.