Abstract
Background:
Percutaneous coronary intervention for heavily calcified lesions requires rotational atherectomy (RA). Long-term clinical outcomes after drug-eluting stent (DES) implantation following (RA) for heavily calcified lesions remain unclear. We assessed 5-year clinical outcomes after DES implantation following RA.
Methods and Results:
Between March 2006 and September 2011, 219 consecutive patients with 219 lesions treated with DES following RA, were retrospectively enrolled. The cumulative 5-year incidence of target-lesion revascularization (TLR) and definite stent thrombosis (ST) were assessed. The cumulative incidence of TLR within (≤) the first year was 18.6%. Late TLR beyond (>) 1 year continued to occur at 1.9% per year without a decrease in the rate (5-year incidence, 26.0%). The cumulative incidence of definite ST at 30 days, 1 and 5 years was 0.9%, 2.3% and 2.9%, respectively. The annual rate of definite ST beyond 1 year was 0.15%. On multivariate analysis, the significant predictor of TLR within 1 year was use of first-generation DES (hazard ratio [HR], 2.09; 95% CI: 1.10–4.03, P=0.02) and that of TLR beyond 1 year was hemodialysis (HR, 3.29; 95% CI: 1.06–10.55, P=0.04).
Conclusions:
Late TLR beyond 1 year continued to occur up to 5 years at a constant annual incidence, whereas very late ST was rare. Careful long-term clinical follow-up is continually needed in patients who have already received DES following RA for heavily calcified lesions.
Percutaneous coronary intervention (PCI) for heavily calcified lesions is challenging due to low procedural success, inadequate expansion of calcified lesions and difficulty of stent delivery.1,2
Furthermore, there is a concern that the stent polymer may be damaged during the delivery of stents through heavily calcified lesions, causing insufficient effect of drug on the intima underneath sites of calcification.3,4
Rotational atherectomy (RA; RotablatorTM
Boston Scientific, Maple Grove, MN, USA) is useful and effective for modifying calcified lesions, and results in better stent expansion in severely calcified lesions.2,5–8
Editorial p 946
Drug-eluting stents (DES) have dramatically improved the rate of in-stent restenosis and subsequent target lesion revascularization (TLR) compared with bare metal stents (BMS).9,10
Even in complex lesions such as diffuse, bifurcation, chronic total occlusion (CTO) and heavily calcified lesions, DES are more effective than BMS.11–14
With regard to mid-term clinical outcomes in patients treated only with DES following RA, the TLR rate was 6.8–21.2%.4,11,15–17
Long-term outcomes of DES after RA, however, have not yet been fully evaluated. The aim of this study was therefore to assess 5-year clinical outcomes after DES following RA.
Methods
Subjects and Procedure
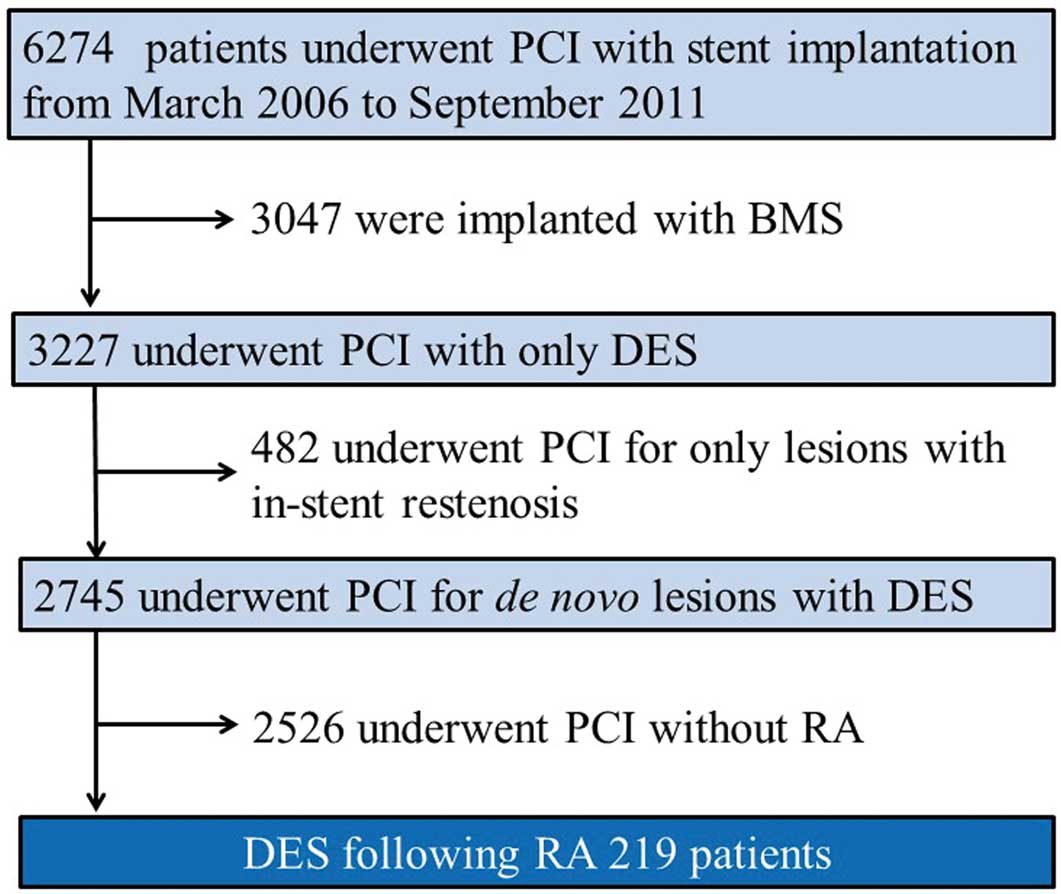
Between March 2006 and September 2011, 3,227 consecutive patients underwent PCI only with DES implantation at Kokura Memorial Hospital, Fukuoka, Japan. Of these patients, 219 (6.8%) with 219 lesions who underwent RA and then were treated only with DES were enrolled in this study, which included only the initial procedure (Figure 1). Heavy calcification was defined visually as the presence of calcium within the vessel wall at the site of the stenosis before contrast injection, which generally compromises both sides of the vessel wall.15,18
At Kokura Memorial Hospital, RA was indicated in patients who met the following criteria: (1) coronary artery disease with severe calcification on angiography and/or intravascular ultrasound (IVUS); (2) target lesion deemed undilatable by a balloon according to angiography and/or IVUS; (3) inability to fully expand the target lesion even after balloon dilatation; (4) inability to cross the stents even after balloon dilatation and with any devices. The procedural details of RA have been described elsewhere.19
In brief, the procedure began with the smallest possible rotablation burr (1.25, 1.5 or 1.75 mm). The rotational speed was between 180,000 and 210,000 r.p.m. Continuous i.c. infusion of verapamil, nitroglycerin and unfractionated heparin and pause of rotablation were used to avoid slow flow. Care was taken to avoid any full of rotational speed, which exceeded 5,000 rpm. After the procedure, all patients were advised to continue aspirin (81–162 mg daily) for life unless there were contraindications. Either ticlopidine (200 mg daily) or clopidogrel (75 mg daily) was also prescribed for at least 1 year after stent implantation. Routine follow-up angiography 6–12 months after stent implantation was recommended to all patients regardless of clinical symptoms. All patients gave written informed consent for the procedure and the follow-up protocol, which was approved by the institutional review board of Kokura Memorial Hospital. Follow-up data until September 2016 were obtained either from a review of hospital records based on clinic visits or scripted telephone interviews with the patients, family members or primary care physicians.
Quantitative Coronary Angiography (CAG)
CAG was performed after 0.2 mg i.c. nitroglycerin. Quantitative CAG (QCA) was performed before and after stenting, using a guiding catheter to calibrate the magnification and a validated automated edge-detection algorithm (CASS 5.7, Pie Medical Imaging, Eindhoven, Netherlands). The analyses were performed independently by 2 experienced observers in the Angiographic Core Laboratory, Kokura Memorial Hospital, who were blinded to all clinical information. Procedural success was defined as final residual stenosis <30% and grade 3 Thrombolysis in Myocardial Infarction (TIMI) flow. The target lesion for measurement of the minimum luminal diameter (MLD) included 5-mm margins proximal and distal to the stent as well as the stent itself.
Study Endpoints and Definitions
The primary study endpoints were the cumulative 5-year incidence of TLR and definite stent thrombosis (ST). We also evaluated the cumulative incidence of all-cause death, cardiac death, ischemia-driven TLR (ID-TLR), target vessel revascularization (TVR) and ID-TVR. Clinical endpoint definitions were based on the Academic Research Consortium (ARC) definitions.20
Cardiac death was defined as any death due to a proximate cardiac cause, unwitnessed death or death of unknown cause, and all procedure-related death.20
Myocardial infarction (MI) was defined according to the ARC.20
TLR was defined as either repeated PCI or coronary artery bypass graft (CABG) inside the stent or within 5 mm proximal or distal to the stent. TVR was defined as repeated PCI or repeated CABG on the target vessel. Revascularization was considered ischemia driven if associated with any of the following: (1) positive functional ischemia study; (2) ischemic symptoms and angiographic diameter stenosis ≥50%; and (3) angiographic diameter stenosis ≥70% without angina or positive functional study.20,21
The timing and diagnostic certainty of ST were assessed according to the ARC definition.20
Clinical events were adjudicated by consensus of 2 interventional cardiologists (H.J and S.K.).
Statistical Analysis
Data are presented as number (%) or mean±SD. For each endpoint, the cumulative incidence probability through 5 years was estimated using the Kaplan-Meier method. To evaluate the incidence of late TLR and very late ST (VLST) beyond 1 year, landmark analysis at 1 year, which resets the risk set at a landmark point of 1 year, was applied to the Kaplan-Meier estimates. Similarly, Cox proportional hazards models were used to identify independent risk factors among 17 candidate variables for TLR within (≤) and beyond (>) the 1-year landmark point. The continuous variables were dichotomized by clinically meaningful reference values. Variables with P<0.10 in univariable Cox models were entered into a multivariable Cox model. If clinically similar variables remained, we selected the variable that we considered to be more clinically relevant. Finally, first- and second-generation DES were compared in terms of the 5-year incidence of TLR and ST, using log-rank test and hazard ratio (HR) estimates. For TLR, landmark analysis at the 1-year point and multivariable adjustment for the chosen variables were applied, and the directly adjusted (i.e., standardized to the total population) cumulative incidence probabilities were estimated.
All statistical analysis was performed by a physician (H.J.) and a statistician (T.S.) using JMP version 10.0.2 and SAS version 9.4 (SAS Institute, Cary, NC, USA). Two-sided P<0.05 was considered to indicate statistical significance.
Results
Baseline Characteristics
Five-year clinical follow-up was 98.6% complete in all patients. The current group predominantly included patients with stable angina. The great majority of patients, however, had high-risk features such as advanced age, diabetes mellitus (DM), hemodialysis and multivessel disease (Table 1). In addition, the great majority of patients had American Heart Association/American College of Cardiology type B2/C lesions with complex lesion characteristics such as small reference diameter, long lesion length or severe calcification (Table 2). The procedural success rate was extremely high, and the complication rate was remarkably low (Table 2).
Table 1.
Baseline Patient Characteristics
| Characteristics |
|
| No. patients |
219 |
| Age (years) |
71.9±10.1 |
| Male |
151 (69.0) |
| Risk factors |
| Hypertension |
183 (83.6) |
| Hyperlipidemia |
107 (48.9) |
| Diabetes mellitus |
109 (49.8) |
| Current smoker |
24 (11.0) |
| Family history of CAD |
9 (4.1) |
| Past medical history |
| Previous MI |
43 (19.6) |
| Previous PCI |
65 (29.7) |
| Previous CABG |
20 (9.1) |
| CVD |
33 (15.1) |
| PAD |
60 (27.4) |
| Chronic kidney disease |
79 (36.1) |
| Hemodialysis |
63 (28.8) |
| ACS |
4 (1.8) |
| EF on admission (%) |
56.6±12.9 |
| HbA1c (%) |
6.1±1.2 |
| eGFR (mL/min/1.73 m2) |
50.4 (6.7–69.6) |
| Syntax score |
14 (10–19) |
| MVD |
116 (53.0) |
| Type of stents |
| SES |
33 (15.1) |
| PES |
59 (26.9) |
| ZES |
2 (0.9) |
| BES |
42 (19.2) |
| CoCr-EES |
83 (37.9) |
| Medication at discharge |
| ACEI or ARB |
125 (57.1) |
| β-blocker |
82 (37.4) |
| Statin |
122 (55.7) |
| Insulin |
30 (13.7) |
| Oral diabetes mellitus drug |
58 (26.5) |
Data given as mean±SD, median (IQR) or n (%) for categorical variables. ACEI, angiotensin-converting enzyme inhibitor; ACS, acute coronary syndrome; ARB, angiotensin II receptor blocker; BES, biolimus-eluting stent; CABG, coronary artery bypass graft; CAD, coronary artery disease; CoCr, cobalt chromium; CVD, cerebrovascular disease; EES, everolimus-eluting stent; EF, ejection fraction; eGFR, estimated glomerular filtration rate; MI, myocardial infarction; MVD, multi-vessel disease; PAD, peripheral artery disease; PCI, percutaneous coronary intervention; PES, paclitaxel-eluting stent; SES, sirolimus-eluting stent; ZES, zotarolimus-eluting stent.
Table 2.
Baseline Lesion Characteristics, Procedure and QCA Parameters
| Characteristics |
|
| No. lesions |
219 |
| Culprit lesions |
| Right coronary artery |
70 (32.0) |
| LAD |
111 (50.7) |
| Left circumflex artery |
28 (12.8) |
| Left main trunk |
10 (3.2) |
| AHA/ACC lesion classification |
| A |
0 (0.0) |
| B1 |
71 (32.4) |
| B2 |
84 (38.4) |
| C |
64 (29.2) |
| Chronic total occlusion |
14 (6.4) |
| Aorta ostial lesion |
10 (4.6) |
| Bifurcation lesion |
53 (24.2) |
| Tortuosity |
17 (7.8) |
| Reference diameter (mm) |
2.40±0.52 |
| Diameter stenosis rate (%) |
75.6±13.0 |
| Minimum lumen diameter (mm) |
0.58±0.34 |
| Lesion length (mm) |
30.2±16.0 |
| Procedural success |
217 (99.1) |
| Type of procedure |
| Pre-balloon before stenting |
219 (100.0) |
| Post-high-pressure balloon |
135 (61.6) |
| IABP support |
7 (3.2) |
| No. stents per culprit |
2 (1–2) |
| Total stent length (mm) |
38 (20–51) |
| Stent diameter (mm) |
2.75 (2.5–3.0) |
| Stent balloon max pressure (atm) |
14.8±4.1 |
| Final balloon max pressure (atm) |
17.0±4.4 |
| Rotational atherectomy |
| Final burr size (mm) |
1.5 (1.5–1.75) |
| No. burrs used |
1 (1–2) |
| Procedural outcome |
| Slow flow |
2 (0.9) |
| Dissection |
5 (2.3) |
| Perforation |
5 (2.3) |
| Pericardial effusion |
2 (0.9) |
| Myocardial infarction |
4 (1.8) |
| Post-procedural QCA |
| Reference diameter (mm) |
2.67±0.54 |
| Diameter stenosis rate (%) |
16.4±7.6 |
| Minimum diameter (mm) |
2.23±0.51 |
Data given as mean±SD, median (IQR) or n (%). ACC, American College of Cardiology; AHA, American Heart Association; IABP, intra-aorta balloon pumping; LAD, left anterior descending artery; QCA, quantitative coronary angiography.
The cumulative 5-year incidence of all-cause death and cardiac death were 34.9% and 10.8%, respectively (Table 3;
Figure 2A). Cardiac death comprised 30.9% of all-cause death. The cumulative 5-year incidence of MI was relatively low (annual incidence, 1.6%).
Table 3.
Five-Year Clinical Outcome
| |
30 days |
1 year |
3 years |
5 years |
| All-cause death |
3 (1.4) |
14 (6.4) |
49 (22.5) |
76 (34.9) |
| Cardiac death |
3 (1.4) |
8 (3.7) |
15 (7.2) |
21 (10.8) |
| Non-cardiac death |
0 (0.0) |
6 (2.7) |
34 (15.3) |
55 (24.1) |
| Sudden death |
0 (0.0) |
2 (1.0) |
6 (3.0) |
9 (4.8) |
| Myocardial infarction |
2 (0.9) |
6 (2.8) |
10 (4.9) |
15 (8.0) |
| Definite stent thrombosis |
2 (0.9) |
5 (2.3) |
6 (2.9) |
6 (2.9) |
| Probable stent thrombosis |
0 (0.0) |
0 (0.0) |
0 (0.0) |
0 (0.0) |
| Possible stent thrombosis |
0 (0.0) |
2 (1.0) |
6 (3.0) |
9 (4.8) |
| Any TLR |
2 (0.9) |
39 (18.6) |
44 (21.1) |
52 (26.0) |
| ID-TLR |
2 (0.9) |
28 (13.4) |
31 (14.9) |
37 (18.6) |
| Any TVR |
2 (0.9) |
47 (22.8) |
55 (26.4) |
63 (31.3) |
| ID-TVR |
2 (0.9) |
29 (13.8) |
34 (16.4) |
41 (20.7) |
Data given as n (%). ID, ischemia-driven; MACE, major adverse cardiovascular events; TLR, target lesion revascularization; TVR, target vessel revascularization.

In this cohort, 79.4% of patients underwent follow-up angiography within 1 year. The cumulative incidence of TLR within the first year was high (18.6%;
Figures 2B,3A). Late TLR beyond 1 year continued to occur at a constant rate up to 5 years (1.9%/year;
Table 3,
Figure 3B). ID-TLR within 1 year was relatively high (13.4%) and also continued to occur at a constant rate of 1.3%/year (Table 3,
Figure 2B). Of 37 patients who received ID-TLR, 21 had positive functional ischemia (electrocardiographic changes at rest, n=10; positive stress test results, n=11), 28 had ischemic symptoms with angiographic diameter stenosis ≥50% (effort angina, n=16; symptom at rest, n=12), and 5 had angiographic diameter stenosis ≥70% without angina or positive functional study.

The cumulative incidence of definite ST within the first year was relatively high (30 days, 0.9%; 1 year, 2.3%;
Table 3,
Figure 3). VLST, however, occurred only in 1 patient up to 5 years (Table 3,
Figure 3). All ST patients had MI; and ST was the cause of MI during follow-up in 40.0% of 15 MI events. All patients with early ST and VLST were on dual antiplatelet therapy (DAPT) at the time of ST, whereas DAPT was interrupted in 2 (66.6%) of 3 patients with late ST before the occurrence of ST, but continued in the remaining patient. Regarding the DES type associated with ST, 4 patients (1 early ST and 3 late ST) received paclitaxel-eluting stents (PES). The remaining 2 patients (1 early ST and 1 VLST) received biolimus-eluting stent and sirolimus-eluting stent (SES), respectively. The independent risk factor for TLR within 1 year was first-generation DES use (HR, 2.09; 95% CI: 1.10-4.03, P=0.02); DM and post-intervention MLD ≤2.25 mm tended to be associated with TLR within 1 year (HR, 1.80; 95% CI: 0.94–3.59, P=0.08; HR, 1.85; 95% CI: 0.94–3.87, P=0.07, respectively). In addition, the independent risk factor for TLR beyond 1 year was hemodialysis (HR, 3.29; 95% CI: 1.06–10.6, P=0.04;
Table 4).
Table 4.
Indicators of TLR
| |
TLR within (≤) 1 year |
TLR beyond (>) 1 year |
| Univariate |
Multivariate |
Univariate |
Multivariate |
| HR (95% CI) |
P-value |
HR (95% CI) |
P-value |
HR (95% CI) |
P-value |
HR (95% CI) |
P-value |
| Age ≥80 years |
0.75
(0.30–1.60) |
0.48 |
|
|
0.62
(0.10–2.32) |
0.52 |
|
|
| Male |
1.34
(0.68–2.89) |
0.41 |
|
|
2.73
(0.73–17.7) |
0.14 |
|
|
| Diabetes |
1.91
(1.01–3.78) |
0.047 |
1.80
(0.94–3.59) |
0.08 |
1.06
(0.34–3.18) |
0.92 |
|
|
| Hypertension |
0.62
(0.30–1.38) |
0.22 |
|
|
1.96
(0.39–35.6) |
0.48 |
|
|
| Hyperlipidemia |
1.03
(0.55–1.94) |
0.93 |
|
|
0.74
(0.24–2.23) |
0.59 |
|
|
| Current smoker |
0.94
(0.28–2.34) |
0.90 |
|
|
1.36
(0.21–5.08) |
0.70 |
|
|
| Previous MI |
0.76
(0.29–1.69) |
0.52 |
|
|
0.78
(0.12–2.91) |
0.74 |
|
|
| Previous PCI |
1.29
(0.64–2.46) |
0.46 |
|
|
1.13
(0.31–3.46) |
0.84 |
|
|
| Previous CABG |
1.54
(0.53–3.60) |
0.39 |
|
|
2.32
(0.36–8.65) |
0.32 |
|
|
| CVD |
1.63
(0.70–3.38) |
0.24 |
|
|
1.30
(0.20–4.83) |
0.74 |
|
|
| Hemodialysis |
1.45
(0.73–2.75) |
0.28 |
|
|
4.09
(1.35–12.8) |
0.01 |
3.29
(1.06–10.6) |
0.04 |
| PAD |
1.34
(0.67–2.55) |
0.40 |
|
|
1.49
(0.40–4.58) |
0.52 |
|
|
| ACS |
1.74
(0.10–7.99) |
0.62 |
|
|
1.4875e-8
(10.7–10.7) |
0.54 |
|
|
| MVD |
1.33
(0.70–2.55) |
0.38 |
|
|
0.77
(0.25–2.33) |
0.65 |
|
|
| Statin |
0.90
(0.48–1.71) |
0.74 |
|
|
0.58
(0.19–1.76) |
0.33 |
|
|
| EF ≤40% |
1.43
(0.54–3.20) |
0.44 |
|
|
1.57
(0.24–5.85) |
0.58 |
|
|
| First-generation DES |
1.81
(0.96–3.45) |
0.07 |
2.09
(1.10–4.03) |
0.02 |
3.28
(1.07–12.1) |
0.04 |
2.52
(0.80–9.58) |
0.12 |
RD before procedure
≤2.25 mm |
1.12
(0.59–2.11) |
0.72 |
|
|
2.25
(0.75–7.43) |
0.15 |
|
|
Post-intervention MLD
≤2.25 mm |
1.75
(0.91–3.59) |
0.09 |
1.85
(0.94–3.87) |
0.07 |
0.47
(0.14–1.42) |
0.18 |
|
|
| Lesion length ≥30 mm |
1.07
(0.56–2.00) |
0.85 |
|
|
0.58
(0.16–1.78) |
0.35 |
|
|
DES, drug-eluting stent; HR, hazard ratio; MLD, minimum luminal diameter; RD, reference diameter. Other abbreviations as in Tables 1,3.
In the present crude cohort, the second-generation DES group had a lower cumulative 5-year incidence of TLR than the first-generation DES group (HR, 0.48; 95% CI: 0.27–0.83, P<0.01;
Figure 4A). Even after multivariable adjustment, there was a significant difference between first- and second-generation DES (HR, 0.48; 95% CI: 0.27–0.83, P<0.01;
Figure 4B). In the landmark analysis at 1 year, there was a significant difference between the 2 groups within the first year (TLR within the first year: HR, 0.52; 95% CI: 0.26–0.99, P=0.047), whereas late TLR beyond 1 year did not show significant difference (HR, 0.43; 95% CI: 0.11–1.34, P=0.18;
Figure 4C). In the present crude cohort, there was significant difference in ST between first- and second-generation DES (HR, 0.15; 95% CI: 0.008–0.97, P=0.04;
Figure 4D).
Discussion
In the present study, the main findings were as follows: (1) the cumulative incidence of TLR within the first year was very high, and late TLR beyond 1 year continued to occur at a constant rate; (2) the cumulative incidence of ST within the first year was high, but VLST was rare; (3) the risk factors for TLR within and beyond 1 year were first-generation DES use and hemodialysis, respectively; and (4) second-generation DES had a lower rate of TLR than first-generation DES.
In previous studies, patients with calcified lesions had a high TLR rate because they had predominantly unfavorable patient and lesion characteristics.22
Therefore, the TLR rate after PCI requiring RA due to calcified lesions remained high (6.8–21.2%).4,11,15,17
Recently, Furuichi et al showed that TLR at 13 months was 9.8% in patients treated with first-generation DES.17
More recently, the Rotational Atherectomy Prior to Taxus Stent Treatment for Complex Native Coronary Artery Disease (ROTAXUS) trial reported that the rates of TLR after PES implantation were 11.7% at 9 months and 13.8% at 2 years, respectively.4,23
In the present study, the TLR rate was 18.6% at 1 year, which was higher than previously reported. This might be due to a higher angiographic follow-up rate within the first year, and more complex patient and lesion characteristics in the present study than in previous studies.4,17,23
Late adverse events such as VLST and late TLR beyond 1 year after DES implantation have emerged as unsolved issues.24
In the j-Cypher Registry, VLST and late TLR beyond 1 year continued to occur at a constant rate up to 5 years after first-generation SES implantation (0.26%/year and 2.2%/year, respectively).25
Recently, Miura et al and Kuramitsu et al reported a similar tendency in terms of late adverse events up to 10 years after first-generation SES implantation.26,27
As shown in the present study, the patient and lesion characteristics associated with RA were more complex, which might lead to worse long-term clinical outcome. The long-term clinical outcome of DES following RA, however, remains unclear. In the present study, late TLR beyond 1 year after DES implantation continued to occur at a constant rate up to 5 years (1.9%/year). Interestingly, the annual rate of late TLR beyond 1 year was similar to that of an unselected population, regardless of the fact that the present cohort had high-risk baseline characteristics.25,26
Considering these findings, late TLR beyond 1 year after DES implantation requiring RA remains a concerning problem for at least 5 years, but it was reassuring that we found no evidence for increase or decrease of late TLR rate beyond 1 year in those patients.
ST is a rare, but potentially life-threatening, complication that has raised an intriguing issue in the DES era.20
Although the cause of ST is multifactorial, a lesion with severe calcification requiring RA is a risk factor for ST because of inadequate stent expansion and incomplete stent apposition.20
Definite ST in patients treated with first-generation DES following RA was reported to occur in 0.9–2.1% at 9–13 months, which is similar to the present rate but higher than that in unselected patients.4,17
To date, however, data on the incidence of VLST during long-term follow-up in patients treated with DES following RA are scarce. In the present study, it was intriguing that VLST occurred only in 1 patient treated with SES, which was remarkably lower than in previous studies.4,17
Furthermore, most ST patients were treated with first-generation DES. Recently, network meta-analyses have shown that second-generation DES, especially cobalt-chromium everolimus-eluting stents, are safer than first-generation DES.28,29
The current study suggests better long-term safety of second-generation DES even in lesions requiring RA.
Previous studies have reported on the risk factors for TLR within and beyond 1 year in patients treated with DES. The risk factors for TLR after DES implantation following RA, however, have not been fully evaluated. Abdel-Wahab et al reported that the risk factors for TLR after DES implantation following RA at a median follow-up period of 15 months were DM and age.15
In addition, Rathore et al also showed that male gender, previous CABG, CTO and non-aorta ostial lesion predicted restenosis at 6–9 months after BMS or DES implantation following RA.11
In the present study, first-generation DES (vs. second-generation DES) was a risk factor for TLR within 1 year. In addition, we suggested the possibility of DM and post-intervention MLD ≤2.25 mm (which are well-known predictors of TLR) as predictors of TLR within 1 year. Furthermore, the predictors of TLR in the long-term after DES implantation following RA are still unknown. The present study has identified hemodialysis as a risk factor for late TLR beyond 1 year. Therefore, careful long-term follow-up is needed in patients who have already received DES following RA, especially in those patients who require hemodialysis.
Second-generation DES have improved safety and similar efficacy compared with first-generation DES, whereas there has been to date no study comparing the difference in clinical outcomes of RA between first- and second-generation DES.25,26
In the current study, the cumulative 5-year incidence of TLR was significantly lower for second-generation DES than for first-generation DES. Stent under-expansion, stent recoil, damage to the polymer and secondary insufficient drug effect are potential causes of a high TLR rate in calcified lesions.3,4
Compared with first-generation DES, second-generation DES have improved stent delivery systems and stent platforms. These features may reduce the damage to the polymer in severely calcified lesions requiring RA, which might account for the significant difference in TLR rate between first- and second-generation DES.3,4
Considering these findings, second-generation DES may improve long-term clinical outcomes compared with first-generation DES in patients with complex lesions such as calcified lesions requiring RA.
Clinical Implications
At 5 years, the cumulative incidence of TLR was very high in patients with DES following RA. In addition, late TLR beyond 1 year continued to occur up to 5 years. Therefore, careful long-term clinical follow-up is mandatory, especially in patients who have already been treated with first-generation DES following RA and who have been on hemodialysis. Furthermore, it may be important for interventionists to obtain larger post-intervention MLD in heavily calcified lesions using RA and balloon at index procedure.
Study Limitations
There were several limitations in the present study. First, this study was a retrospective and observational study at a single center. Therefore, selection bias might have affected the conclusions. To our knowledge, however, this is the first study to report on 5-year clinical outcomes of DES implantation following RA. Second, routine follow-up CAG might have biased the incidence of TLR. Third, we did not have information on bleeding complications and antiplatelet therapy during follow-up. Fourth, we could not assess the predictors of ST and compare first-generation DES with second-generation DES after multivariable adjustment, because the incidence of ST was low. Finally, very long-term clinical outcomes in patients undergoing PCI with DES following RA remain unclear. Therefore, careful follow-up should be continued, in order to assess very long-term clinical outcomes in these patients.
Conclusions
Late TLR beyond 1 year continued to occur up to 5 years at a constant rate, but VLST was rare in patients treated only with DES following RA. The risk factor for TLR beyond 1 year was hemodialysis, and second-generation DES might improve the TLR rate for complex lesions such as calcified lesions compared with first-generation DES.
Acknowledgments
The authors thank Naoka Katsumi, Yukie Ochi and Miho Hasegawa for assistance with this work.
Disclosures
The authors declare no conflicts of interest.
References
- 1.
Sharma SK, Israel DH, Kamean JL, Bodian CA, Ambrose JA. Clinical, angiographic, and procedural determinants of major and minor coronary dissection during angioplasty. Am Heart J 1993; 126: 39–47.
- 2.
Hoffmann R, Mintz GS, Popma JJ, Satler LF, Kent KM, Pichard AD, et al. Treatment of calcified coronary lesions with Palmaz-Schatz stents: An intravascular ultrasound study. Eur Heart J 1998; 19: 1224–1231.
- 3.
Khattab AA, Otto A, Hochadel M, Toelg R, Geist V, Richardt G. Drug-eluting stents versus bare metal stents following rotational atherectomy for heavily calcified coronary lesions: Late angiographic and clinical follow-up results. J Interv Cardiol 2007; 20: 100–106.
- 4.
Abdel-Wahab M, Richardt G, Joachim Buttner H, Toelg R, Geist V, Meinertz T, et al. High-speed rotational atherectomy before paclitaxel-eluting stent implantation in complex calcified coronary lesions: The randomized ROTAXUS (Rotational Atherectomy prior to Taxus Stent Treatment for Complex Native Coronary Artery Disease) trial. JACC Cardiovasc Interv 2013; 6: 10–19.
- 5.
Hoffmann R, Mintz GS, Kent KM, Pichard AD, Satler LF, Popma JJ, et al. Comparative early and nine-month results of rotational atherectomy, stents, and the combination of both for calcified lesions in large coronary arteries. Am J Cardiol 1998; 81: 552–557.
- 6.
Yabushita H, Takagi K, Tahara S, Fujino Y, Warisawa T, Kawamoto H, et al. Impact of rotational atherectomy on heavily calcified, unprotected left main disease. Circ J 2014; 78: 1867–1872.
- 7.
Moussa I, Di Mario C, Moses J, Reimers B, Di Francesco L, Martini G, et al. Coronary stenting after rotational atherectomy in calcified and complex lesions. Angiographic and clinical follow-up results. Circulation 1997; 96: 128–136.
- 8.
Sakakura K, Funayama H, Taniguchi Y, Tsurumaki Y, Yamamoto K, Matsumoto M, et al. The incidence of slow flow after rotational atherectomy of calcified coronary arteries: A randomized study of low speed versus high speed. Catheter Cardiovasc Interv 2017; 89: 832–840.
- 9.
Moses JW, Leon MB, Popma JJ, Fitzgerald PJ, Holmes DR, O’Shaughnessy C, et al. Sirolimus-eluting stents versus standard stents in patients with stenosis in a native coronary artery. N Engl J Med 2003; 349: 1315–1323.
- 10.
Stone GW, Ellis SG, Cox DA, Hermiller J, O’Shaughnessy C, Mann JT, et al. A polymer-based, paclitaxel-eluting stent in patients with coronary artery disease. N Engl J Med 2004; 350: 221–231.
- 11.
Rathore S, Matsuo H, Terashima M, Kinoshita Y, Kimura M, Tsuchikane E, et al. Rotational atherectomy for fibro-calcific coronary artery disease in drug eluting stent era: Procedural outcomes and angiographic follow-up results. Catheter Cardiovasc Interv 2010; 75: 919–927.
- 12.
Kelbaek H, Klovgaard L, Helqvist S, Lassen JF, Krusell LR, Engstrom T, et al. Long-term outcome in patients treated with sirolimus-eluting stents in complex coronary artery lesions: 3-year results of the SCANDSTENT (Stenting Coronary Arteries in Non-Stress/Benestent Disease) trial. J Am Coll Cardiol 2008; 51: 2011–2016.
- 13.
Schofer J, Schluter M, Gershlick AH, Wijns W, Garcia E, Schampaert E, et al. Sirolimus-eluting stents for treatment of patients with long atherosclerotic lesions in small coronary arteries: Double-blind, randomised controlled trial (E-SIRIUS). Lancet 2003; 362: 1093–1099.
- 14.
Stone GW, Ellis SG, Cannon L, Mann JT, Greenberg JD, Spriggs D, et al. Comparison of a polymer-based paclitaxel-eluting stent with a bare metal stent in patients with complex coronary artery disease: A randomized controlled trial. JAMA 2005; 294: 1215–1223.
- 15.
Abdel-Wahab M, Baev R, Dieker P, Kassner G, Khattab AA, Toelg R, et al. Long-term clinical outcome of rotational atherectomy followed by drug-eluting stent implantation in complex calcified coronary lesions. Catheter Cardiovasc Interv 2013; 81: 285–291.
- 16.
Tamekiyo H, Hayashi Y, Toyofuku M, Ueda H, Sakuma T, Okimoto T, et al. Clinical outcomes of sirolimus-eluting stenting after rotational atherectomy. Circ J 2009; 73: 2042–2049.
- 17.
Furuichi S, Sangiorgi GM, Godino C, Airoldi F, Montorfano M, Chieffo A, et al. Rotational atherectomy followed by drug-eluting stent implantation in calcified coronary lesions. EuroIntervention 2009; 5: 370–374.
- 18.
Mintz GS, Popma JJ, Pichard AD, Kent KM, Satler LF, Chuang YC, et al. Patterns of calcification in coronary artery disease: A statistical analysis of intravascular ultrasound and coronary angiography in 1155 lesions. Circulation 1995; 91: 1959–1965.
- 19.
Cavusoglu E, Kini AS, Marmur JD, Sharma SK. Current status of rotational atherectomy. Catheter Cardiovasc Interv 2004; 62: 485–498.
- 20.
Cutlip DE, Windecker S, Mehran R, Boam A, Cohen DJ, van Es GA, et al. Clinical end points in coronary stent trials: A case for standardized definitions. Circulation 2007; 115: 2344–2351.
- 21.
Kimura T, Kozuma K, Tanabe K, Nakamura S, Yamane M, Muramatsu T, et al. A randomized trial evaluating everolimus-eluting Absorb bioresorbable scaffolds vs. Everolimus-eluting metallic stents in patients with coronary artery disease: ABSORB Japan. Eur Heart J 2015; 36: 3332–3342.
- 22.
Genereux P, Madhavan MV, Mintz GS, Maehara A, Palmerini T, Lasalle L, et al. Ischemic outcomes after coronary intervention of calcified vessels in acute coronary syndromes: Pooled analysis from the HORIZONS-AMI (Harmonizing Outcomes With Revascularization and Stents in Acute Myocardial Infarction) and ACUITY (Acute Catheterization and Urgent Intervention Triage Strategy) trials. J Am Coll Cardiol 2014; 63: 1845–1854.
- 23.
de Waha S, Allali A, Buttner HJ, Toelg R, Geist V, Neumann FJ, et al. Rotational atherectomy before paclitaxel-eluting stent implantation in complex calcified coronary lesions: Two-year clinical outcome of the randomized rotaxus trial. Catheter Cardiovasc Interv 2016; 87: 691–700.
- 24.
Kimura T, Morimoto T, Nakagawa Y, Kawai K, Miyazaki S, Muramatsu T, et al. Very late stent thrombosis and late target lesion revascularization after sirolimus-eluting stent implantation: Five-year outcome of the j-Cypher Registry. Circulation 2012; 125: 584–591.
- 25.
Natsuaki M, Morimoto T, Furukawa Y, Nakagawa Y, Kadota K, Yamaji K, et al. Late adverse events after implantation of sirolimus-eluting stent and bare-metal stent: Long-term (5–7 years) follow-up of the Coronary Revascularization Demonstrating Outcome study-Kyoto registry Cohort-2. Circ Cardiovasc Interv 2014; 7: 168–179.
- 26.
Miura K, Kadota K, Habara S, Miyawaki H, Shimada T, Ohya M, et al. Ten-year clinical outcomes after sirolimus-eluting stent implantation: Impact of an in-stent restenosis target lesion. Am Heart J 2016; 175: 47–55.
- 27.
Kuramitsu S, Matsuda H, Jinnouchi H, Yamaji K, Hiromasa T, Matsumura Y, et al. Long-term (7 to 10 years) clinical outcome after first-generation sirolimus-eluting stent implantation. AsiaIntervention 2016; 2: 93–100.
- 28.
Smits PC, Kedhi E, Royaards KJ, Joesoef KS, Wassing J, Rademaker-Havinga TA, et al. 2-year follow-up of a randomized controlled trial of everolimus- and paclitaxel-eluting stents for coronary revascularization in daily practice: COMPARE (Comparison of the everolimus eluting XIENCE-V stent with the paclitaxel eluting TAXUS LIBERTE stent in all-comers: A randomized open label trial). J Am Coll Cardiol 2011; 58: 11–18.
- 29.
Stone GW, Rizvi A, Newman W, Mastali K, Wang JC, Caputo R, et al. Everolimus-eluting versus paclitaxel-eluting stents in coronary artery disease. N Engl J Med 2010; 362: 1663–1674.


